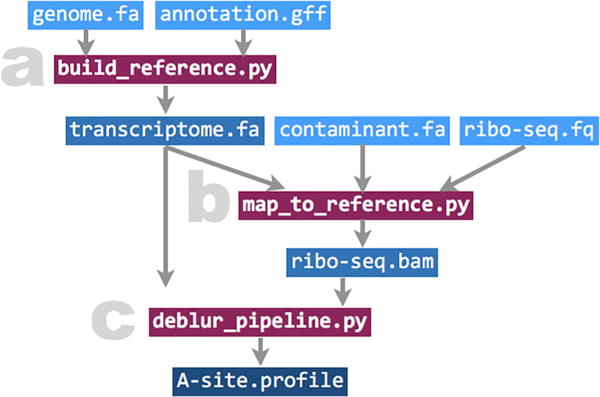
Fig. 1.

Diagram of the Ribodeblur pipeline. Input and output files are marked in blue, and scripts for each step are marked in red. (For interpretation of the references to colour in this figure legend, the reader is referred to the web version of this article.)
