

Abstract
Tuberous Sclerosis Complex (TSC) is a multi-system developmental disorder caused by mutations in the TSC1 or TSC2 genes, whose protein products are negative regulators of mTOR complex 1 signaling. Hallmark pathologies of TSC are cortical tubers; regions of dysmorphic, disorganized neurons and glia in the cortex that are linked to epileptogenesis. To determine the developmental origin of tuber cells, we established human cellular models of TSC by CRISPR/Cas9-mediated gene editing of TSC1 or TSC2 in human pluripotent stem cells (hPSCs). Using heterozygous TSC2 hPSCs with a conditional mutation in the functional allele, we show that mosaic biallelic inactivation during neural progenitor expansion is necessary for the formation of dysplastic cells and increased glia production in three-dimensional cortical spheroids. Our findings provide support for the second-hit model of cortical tuber formation and suggest that variable developmental timing of somatic mutations could contribute to the heterogeneity in the neurological presentation of TSC.
Introduction
Tuberous Sclerosis Complex (TSC) is a developmental disorder caused by mutations in the TSC1 or TSC2 genes1,2. TSC affects multiple systems causing non-malignant hamartomas that can affect the skin, heart, kidney, lung, and brain3. Among the most debilitating aspects of TSC are the neurological symptoms. Approximately 90% of TSC patients have epilepsy that begins in infancy and early childhood and in many cases becomes intractable4. Intellectual disability and autism spectrum disorder occur in about half of TSC patients, with other psychiatric conditions prevalent5. The origins of the neurological aspects of TSC are not well understood; however, patients present with characteristic pathologies, called cortical tubers, which are macroscopic regions of disorganized and dysmorphic cells in the cortex6. Tubers and perituberal cortex often become epileptic foci7,8 and increased tuber load is correlated with more severe epilepsy and cognitive impairment9.
Work from mouse models indicates that loss of Tsc1 or Tsc2 from cortical progenitor cells results in altered neuronal differentiation, morphology, and migration10–15, consistent with histological observations in patient tissue6. However, bona fide tubers are not found in rodent models6,11,12,16,17. This may be a result of differences between mouse and human cortical development. Human cortical neurogenesis occurs over a longer time period (about 140 days in humans18 compared with 8 days in mice19), requires many more cell divisions, and exhibits unique proliferative zones and progenitor cell types18,20,21. Therefore, an experimental system that recapitulates early human cortical development is needed to understand the molecular and cellular origins of tubers.
At the biochemical level, the protein products of TSC1 and 2 form a heterodimeric protein complex that is an essential negative regulator of mTOR complex 1 signaling (mTORC1)22. mTORC1 is a kinase that controls key cellular processes including nutrient sensing, protein synthesis, and autophagy23. Two primary effectors of mTORC1 signaling are p70S6 kinase, which phosphorylates the ribosomal protein S6, and 4E-BP1 that controls formation of the translation initiation complex24. TSC2 is a GTPase-activating protein (GAP) for the small GTPase Rheb, which is a direct activator of mTORC125. TSC1 is required to stabilize TSC226 and loss of either protein disrupts TSC1/2 complex function. In the absence of the TSC1/2 complex, mTORC1 signaling is constitutively active, leading to alterations in cell growth, metabolism, and proliferation27.
The proposed model of cortical tuber formation is that somatic “second-hit” mutations in patients with heterozygous germline mutations result in loss of function of the TSC1/2 complex and hyperactivation of mTORC1 signaling in a subset of cortical progenitor cells28,29. In line with this, there is clear evidence that loss of heterozygosity of TSC1 or 2 causes TSC-associated hamartomas including those in the brain, lung, and kidney30–34. However, second-hit mutations have only been observed in a minority of surgically resected cortical tubers from TSC patients31,35–37, giving rise to the idea that haploinsufficiency may contribute to the neurological and cognitive aspects of TSC38. Here we investigated the developmental origins of tuber cells using two- and three-dimensional human neuronal cultures with engineered mutations in the TSC1 or TSC2 genes. We find that homozygous, but not heterozygous, loss of TSC1 or TSC2 profoundly affects the development of human cortical neurons and glia, giving rise to dysplastic cells resembling those found in tubers.
Results
Gene editing TSC1 and TSC2 in hESCs
To establish a genetically controlled platform for assessing the impact of loss-of-function mutations in TSC1 and TSC2 on human neural development, we used CRISPR/Cas9 to delete either exon 17 of TSC1 (Fig. 1a) or exon 5 of TSC2 (Fig. 1b) in human embryonic stem cells (hESCs). We chose these exons for targeted deletion based on their small size and expected introduction of a frameshift and premature stop codon. Mutations were engineered in the same hESC line, and cell lines were generated with heterozygous or homozygous mutations for each gene (Supplementary Fig. 1a,b). All hESC lines expressed pluripotency markers, exhibited normal morphology, and had no major chromosomal abnormalities (Supplementary Fig. 1c-g and Supplementary Table 1).
Figure 1. Generation of heterozygous and homozygous knock-out TSC1 and TSC2 hESC lines.
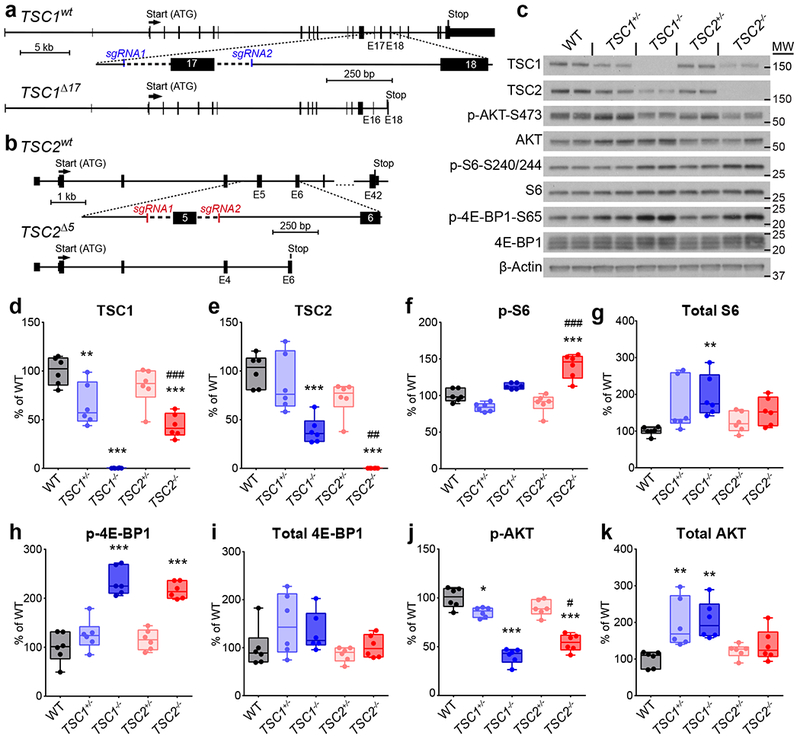
(a,b) CRISPR/Cas9-mediated targeting strategies for TSC1 (a) and TSC2 (b). Two single-guide RNAs (sgRNA1 and sgRNA2) were designed to target either side of exon 17 of TSC1 (a) or exon 5 of TSC2 (b). Excision of these exons causes a frameshift and premature stop codon. (c) Representative western blots of hESC lysates from the indicated genotypes. Two hESC culture samples per genotype are shown; this experiment was replicated three times. Western blots were cropped to show the relevant bands and molecular weight (MW) markers are indicated on the right (in kD). See Supplementary Figure 2 for uncropped western blots. (d-k) Box-and-whisker plots display western blot quantification for TSC1 (d), TSC2 (e), p-S6 Ser240/244 (f), S6 (g), p-4E-BP1 Ser65 (h), 4E-BP1 (i), p-AKT Ser473 (j), and AKT (k); center line, median; box limits, 25th to 75th percentile; whiskers, minimum to maximum. Dots represent individual hESC cultures, n=6 cultures per genotype. Data were analyzed using a one-way ANOVA with Bonferroni’s multiple comparisons test. Significant differences compared to wild-type (WT) are indicated: *, P<0.05; **, P<0.01; ***, P<0.001. Significant differences between TSC1−/− and TSC2−/− are indicated: #, P<0.05; ##, P<0.01; ###, P<0.001. See Supplementary Table 2 for sample sizes, sample definition, exact P values, F values, t values, degrees of freedom, and confidence intervals for all comparisons.
We verified by western blotting that homozygous mutant hESCs exhibited complete loss of TSC1 or TSC2 protein and heterozygous cells exhibited partial loss (Fig. 1c-e, Supplementary Fig. 2, and Supplementary Table 2). We observed a significant reduction in TSC2 protein in TSC1−/− cells and TSC1 protein in TSC2−/− cells, consistent with prior data showing that the TSC1 and 2 proteins stabilize each other and that in the absence of one protein, the other is degraded26. We examined the phosphorylation state of the mTORC1 pathway targets ribosomal protein S6 and 4E-BP1 and found significant elevations in p-S6 in TSC2−/− cells and p-4E-BP1 in TSC1−/− and TSC2−/− hESCs (Fig. 1c,f,h). Total levels of S6 protein were also significantly increased in TSC1−/− cells (Fig. 1c & g), consistent with mTORC1’s role in promoting the synthesis of ribosomal proteins39,40. Notably, hESCs with heterozygous mutations in TSC1 or 2 did not display activation of mTORC1 signaling (Fig. 1c,f-i).
AKT is an upstream activator of mTORC1 that controls its activity through phosphorylation and inhibition of TSC241. AKT and other upstream regulators of mTORC1 are subject to potent negative feedback regulation41. Consistent with engagement of a negative feedback pathway, we observed significantly reduced phosphorylation of AKT at serine 473 in both TSC1−/− and TSC2−/− hESCs, and a small but significant decrease in TSC1+/− hESCs (Fig. 1c, j). Interestingly, we also observed increased total AKT protein in TSC1+/− and TSC1−/− hESCs, which was not observed in hESCs with TSC2 mutations (Fig. 1c,k). Together, these results demonstrate that homozygous, but not heterozygous, disruption of TSC1 or TSC2 increases mTORC1 signaling and decreases AKT phosphorylation in hESCs.
Phenotypes of neural progenitor cells lacking TSC1 or TSC2
To investigate how mutations in TSC1 or 2 affect early human neural development, we differentiated our panel of hESCs into two-dimensional (2D) cultures of forebrain neural progenitor cells (NPCs)42. We found that nestin-positive NPCs could be generated from hESCs of all genotypes (Supplementary Fig. 3a). However, TSC1−/− and TSC2−/− NPCs were hypertrophic (Supplementary Fig. 3a-b), consistent with observations in other cell types exhibiting high mTORC1 signaling23. We observed a large increase in p-S6 in both TSC1−/− and TSC2−/− NPCs, with TSC2−/− NPCs exhibiting significantly higher p-S6 levels than TSC1−/− cells (Supplementary Fig. 3c-f). TSC1−/− NPCs displayed increased 4E-BP1 phosphorylation as well as total levels of S6 and 4E-BP1 (Supplementary Fig. 3c,g-i). We observed strongly reduced S473 AKT phosphorylation in TSC2−/− NPCs, and to a more variable extent in TSC1−/− NPCs (Supplementary Fig. 3c,j). In contrast to hESCs, total levels of AKT were reduced in TSC1−/− and TSC2−/− NPCs (Supplementary Fig. 3c,k).
3D cortical spheroid differentiation
The human cortex develops from neuroepithelial cell precursors that generate radial glia progenitors, which divide asymmetrically to produce excitatory neurons followed by astrocytes, a type of glia18,20. To investigate how mutations in TSC1 or 2 affect neural development in a three-dimensional (3D) tissue context that recapitulates this progression, we differentiated our panel of hESCs into cortical spheroids using an established protocol43 (Fig. 2a). At 20 days post-differentiation, rosette structures resembling cortical ventricular zones could be observed in spheroids of all genotypes (Fig. 2b,c). These structures contained cells that expressed the neural progenitor markers PAX6 and SOX2. There were no significant differences in the percentage of PAX6 or SOX2-positive cells in spheroids derived from hESCs with mutations in TSC1 or TSC2 (Fig. 2d,e), indicating that TSC mutations do not strongly affect differentiation into forebrain progenitors. We performed staining for the cell proliferation marker Ki-67 and found that 49.7% +/− 5.5% of cells in wild-type (WT) spheroids were proliferating at day 20 (Fig. 2c,f). We did not find significant differences in the proportion of Ki-67-positive cells in spheroids with mutations in TSC1 or TSC2 (Fig. 2f).
Figure 2. TSC1−/− and TSC2−/− cortical spheroids have impaired neuronal and enhanced glial differentiation.
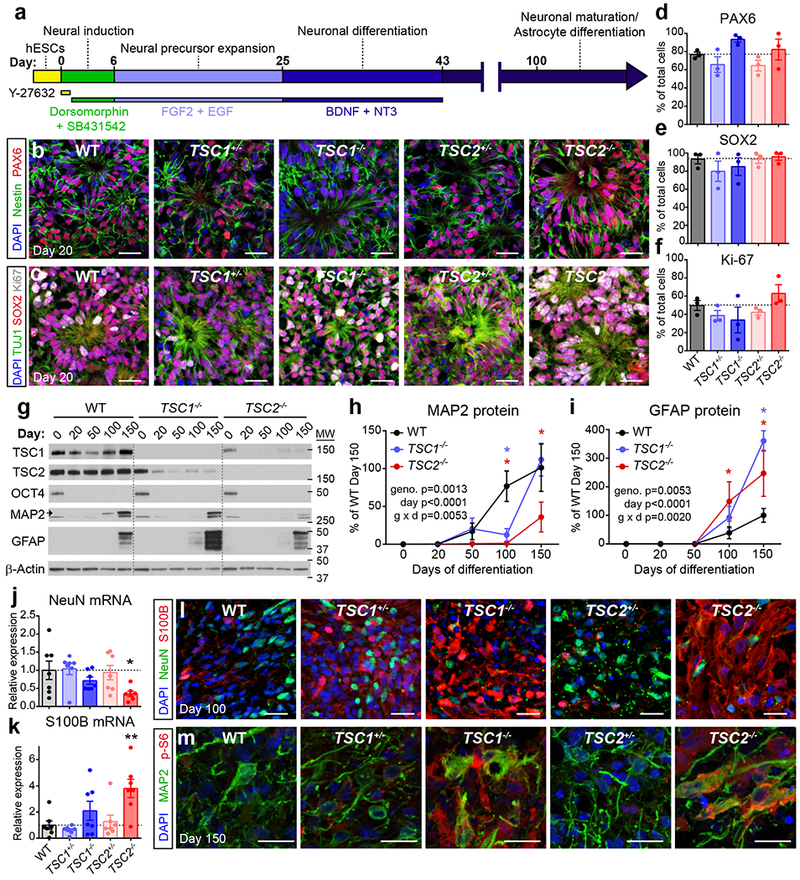
(a) Schematic of the 3D cortical spheroid differentiation protocol (based on Pasca, A.M. et al, 2015)43. (b,c) Confocal images of day 20 cortical spheroid sections from the indicated genotypes, stained with antibodies against nestin (green) and PAX6 (red) (b) or TUJ1 (green), SOX2 (red), and Ki-67 (grey) (c). DAPI staining is in blue. Scale bars represent 25 μm. The experiments in panels b and c were replicated three times (three separate differentiations). (d-f) Bars graphs (mean +/− s.e.m) display quantification of PAX6 (d), SOX2 (e), or Ki-67 (f) positive cells expressed as a percentage of total DAPI-labeled cells in day 20 cortical spheroids. Dots represent data from individual spheroids, n=3 spheroids per genotype from three separate differentiations. (g) Representative western blots of wild-type (WT), TSC1−/−, and TSC2−/− cortical spheroids harvested at different time points post-differentiation from hESCs (day 0). Western blots were cropped to show the relevant bands and molecular weight (MW) markers are indicated on the right (in kD). See Supplementary Figure 2 for uncropped western blots. This experiment was replicated six times (three separate differentiations). (h,i) Quantification of western blot results for the neuronal protein MAP2 (h) and the glial protein GFAP (i) across cortical spheroid development (mean +/− s.e.m.). Day 0, n=6 hESC cultures per genotype. Days 20-150, n=6 spheroids per genotype per time point, from three separate differentiations. Two-way ANOVA P values are shown. Significant differences with Dunnett’s multiple comparisons test are indicated by blue asterisks for WT vs TSC1−/− (PMAP2 d100=0.0021, PGFAP d150<0.0001) and red asterisks for WT vs TSC2−/− (PMAP2 d100=0.0003, PMAP2 d150=0.0018, PGFAP d100=0.0297, PGFAP d150=0.0028). (j,k) Quantitative PCR results (mean +/− s.e.m.) for RBFOX3 (NeuN) (j) and S100B (k) mRNA in day 100 cortical spheroids. Dots represent individual spheroids, n=7 spheroids per genotype from five separate differentiations. Data were analyzed with a one-way ANOVA followed by Sidak’s multiple comparisons test: *, PNeuN WT vs TSC2−/−=0.0461; **, PS100B WT vs TSC2−/−=0.0029. (l) Confocal images of day 100 cortical spheroid sections stained with antibodies against NeuN (green) and S100B (red). DAPI staining is in blue. Scale bars represent 25 μm. This experiment was replicated three times (three separate differentiations). (m) Confocal images of day 150 cortical spheroid sections stained with antibodies against MAP2 (green) and phosphorylated S6 (p-S6, ser240/244, red). DAPI staining is in blue. Scale bars represent 20 μm. This experiment was performed once. See Supplementary Table 2 for sample sizes, sample definition, P values, F values, t values, degrees of freedom, and confidence intervals for all comparisons.
In WT spheroids, expression of neuronal markers including NeuN and MAP2 began around day 30-50 post-differentiation and increased through day 150 (Fig. 2g,h and Supplementary Fig. 4a). Markers of glial-lineage cells, which include astrocytes, emerged later with expression of GFAP and S100B beginning around day 100 and increasing through day 150, consistent with in vivo human cortical development18 (Fig. 2g,i and Supplementary Fig. 4b). While spheroids with heterozygous mutations in TSC1 or TSC2 showed a normal profile of neuron and glia development (Fig. 2g-m and Supplementary Fig. 4a-f), TSC1−/− and TSC2−/− spheroids exhibited reduced or delayed expression of neuronal markers and increased expression of glial-lineage markers. This was demonstrated by significantly reduced MAP2 and increased GFAP protein expression from days 100-150 in TSC2−/− spheroids and on day 100 and 150, respectively, in TSC1−/− spheroids (Fig. 2g-i). mRNA levels showed a similar pattern with decreased RBFOX3 (NeuN) and increased S100B expression in TSC2−/− spheroids on day 100 (Fig. 2j,k). TSC2−/− spheroids also exhibited consistently reduced neuron:glia ratios on day 100, assessed by immunostaining for NeuN and S100B, although this did not reach statistical significance (Fig. 2l and Supplementary Fig. 4c). This may reflect biased differentiation into glial-lineage cells as opposed to enhanced proliferation as we did not find significantly increased numbers of Ki-67/S100B double-positive cells in TSC1−/− or TSC2−/− spheroids (Supplementary Fig. 4d,e). The neurons and glia that were generated in TSC1−/− and TSC2−/− spheroids were enlarged, dysmorphic and had high levels of p-S6 (Fig. 2l,m and Supplementary Fig. 4e,f), similar to those observed in TSC patient tubers6.
We verified that these phenotypes were not specific to the hESC line used for gene editing by using CRISPR/Cas9 to generate a homozygous deletion of TSC2 in an independent human induced pluripotent stem cell (hiPSC) line that we generated from BJ fibroblasts (Supplementary Fig. 1i,j and Supplementary Table 1). BJ;TSC2−/− spheroids exhibited enlarged, dysplastic neurons and glia that had high levels of p-S6 (Supplementary Fig. 4g,h).
TSC1−/− and TSC2−/− spheroids fail to suppress mTORC1 during neurogenesis
To determine how TSC1/2 complex loss might alter neuron and glia development, we monitored mTORC1 signaling in WT and TSC2−/− cortical spheroids over time (Fig. 3a-g). We found that both the total levels and phosphorylation of S6 were strongly reduced in WT spheroids as they transitioned from proliferating to differentiating, with the highest levels at day 0, when cells were still pluripotent (Fig. 3a-c). A similar pattern was observed for 4E-BP1 (Fig. 3a,d,e) suggesting that two downstream targets of mTORC1 signaling involved in translational control are strongly suppressed during human neural differentiation. Notably, although total levels of 4E-BP1 and S6 decreased between days 20 and 100 in TSC2−/− spheroids (Fig. 3c,e), likely reflecting changes in cell type composition of the spheroids, the ratio of phosphorylated to total protein remained as high as in stem cells throughout spheroid development (Fig. 3b,d). This indicates that TSC2−/− cells were unable to suppress mTORC1 signaling during neuronal differentiation. The hyperphosphorylation of mTORC1 pathway targets in TSC2 mutant spheroids was in contrast to AKT phosphorylation, which was strongly reduced throughout development in TSC2−/− spheroids (Fig. 3f,g).
Figure 3. TSC1−/− and TSC2−/− cortical spheroids fail to suppress mTORC1 signaling during neuronal differentiation.
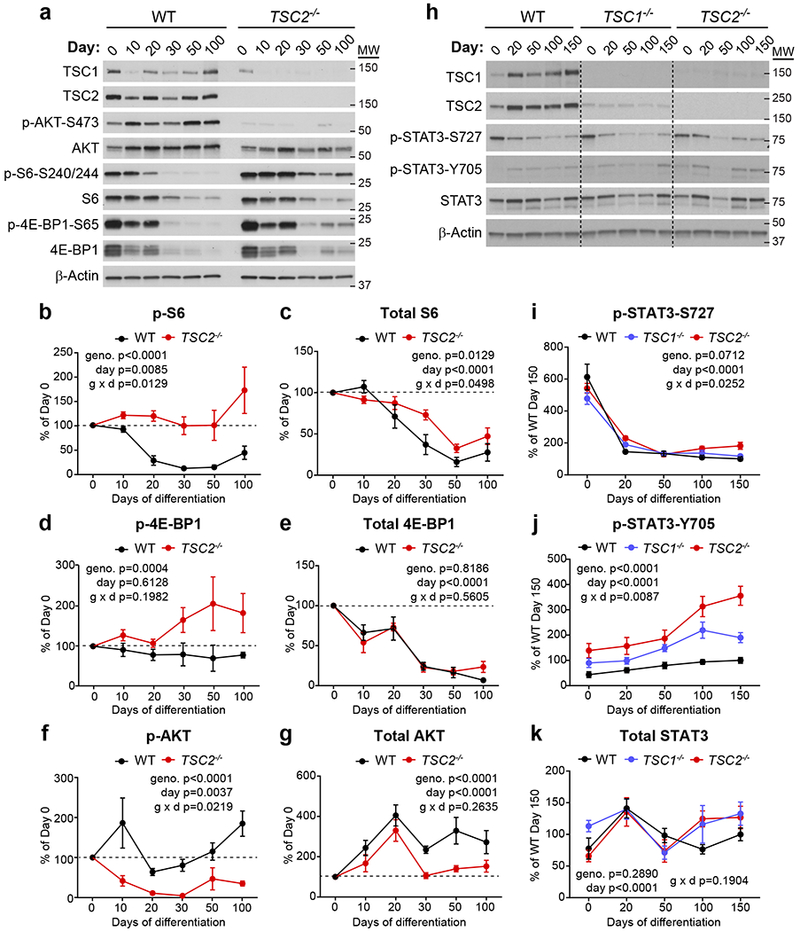
(a) Representative westerns blots of mTORC1 signaling pathway proteins from wild-type (WT) or TSC2−/− cortical spheroids collected on different days post-differentiation. Day 0 is hESCs. This experiment was replicated five times (three separate differentiations). Western blots were cropped to show the relevant bands and molecular weight (MW) markers are indicated on the right (in kD). See Supplementary Figure 2 for uncropped western blots. (b-g) Quantification (mean +/− s.e.m.) of western blot results for p-S6 Ser240/244 (b), S6 (c), p-4E-BP1 Ser65 (d), 4E-BP1 (e), p-AKT Ser473 (f), and AKT (g). Data are expressed as a percentage of Day 0 values within each genotype. Dashed lines at 100% indicate Day 0 values. Two-way ANOVA P values are shown, n=5 hESC cultures (Day 0) or 5 cortical spheroids (Days 10-100) per genotype. See Supplementary Table 2 for P values and complete statistics for Sidak’s multiple comparisons tests. (h) Representative western blots of phosphorylated and total STAT3 protein from WT, TSC1−/− or TSC2−/− cortical spheroids collected on different days post-differentiation. This experiment was replicated six times (three separate differentiations). Western blots were cropped to show the relevant bands and molecular weight (MW) markers are indicated on the right (in kD). (i-k) Quantification (mean +/− s.e.m.) of western blot results for p-STAT3 Ser727 (i), p-STAT3 Tyr705 (j), and STAT3 (k). Data are expressed as a percentage of WT Day 150 values. Two-way ANOVA P values are shown, n=6 hESC cultures (Day 0) or 6 cortical spheroids (Days 20-150) per genotype. See Supplementary Table 2 for P values and complete statistics for Tukey’s multiple comparisons tests.
Given the dynamic regulation of mTORC1 signaling we observed during cortical spheroid development, we quantitatively compared mTORC1 signaling across all genotypes at multiple developmental time points (Supplementary Fig. 5a-g). Homozygous loss of TSC1 or TSC2 produced overall similar changes in mTORC1 signaling. However, TSC2 loss increased S6 phosphorylation to a greater extent than TSC1 deletion on days 20-100 post-differentiation (Supplementary Fig. 5b). The phosphorylation of 4E-BP1 was significantly increased over WT levels in TSC2−/− spheroids on days 20-100 and in TSC1−/− spheroids on days 30 and 50 (Supplementary Fig. 5d). By contrast, AKT phosphorylation was strongly reduced in TSC2−/− spheroids at all time points and on days 20-100 in TSC1−/− spheroids (Supplementary Fig. 5f). Heterozygous spheroids exhibited a normal developmental pattern of mTORC1 signaling, with no significant differences in S6, 4E-BP1, or AKT phosphorylation at any time point compared to WT spheroids (Supplementary Fig. 5a-g).
In addition to TSC1 and TSC2, the TSC complex contains a third requisite protein, TBC1D7, which binds to TSC1 and is required for complex stability44. We measured protein levels of TBC1D7 in TSC1−/− and TSC2−/− spheroids over time and found that TBC1D7 was strongly reduced in TSC1−/− spheroids from day 20 onwards, likely due to degradation in the absence of TSC1 protein (Supplementary Fig. 5h,i). We also observed smaller but significant reductions in TBC1D7 in TSC2−/− spheroids compared to wild-type on days 20, 50 and 150 (Supplementary Fig. 5h,i), which may reflect the approximately 60% loss of TSC1 protein in these cells.
Taken together, these data demonstrate that mTORC1 signaling is strongly suppressed during human neuronal differentiation and that homozygous mutations in TSC1 or TSC2 prevent this developmental regulation.
STAT3 phosphorylation is activated in TSC1−/− and TSC2−/− spheroids
The cortical radial glial lineage generates excitatory neurons first, followed by astrocytes. Studies in rodent models have shown that the gene expression programs that drive neuron and astrocyte differentiation are regulated by competitive cell intrinsic and extrinsic signals45. Since the strong developmental suppression of mTORC1 signaling that we observed in WT spheroids coincided with the time when neurogenesis begins, we hypothesized that mTORC1 signaling may promote gliogenic signals, which are normally suppressed to allow neurogenesis.
In rodent models, the JAK-STAT signaling pathway induces astrocyte differentiation from cortical precursor cells46. Specifically, activation of the transcription factor STAT3 promotes the transcription of genes involved in astrocyte differentiation including gfap46. We investigated the phosphorylation of STAT3 at two key residues, S727 and Y705, in WT, TSC1−/−, and TSC2−/− cortical spheroids over time. We found that S727 was high in hESCs and reduced in all genotypes during neural differentiation (Fig. 3h,i). By contrast, Y705 was low in hESCs and increased in wild-type spheroids from days 100 to 150 when astrocytes begin to appear (Fig. 3h,j). Notably, TSC1−/− and TSC2−/− spheroids exhibited increased p-STAT3-Y705, an effect that was most pronounced in TSC2−/− spheroids (Fig. 3j). Total STAT3 levels did not change significantly with development or TSC1 or TSC2 loss (Fig. 3h,k).
The increased p-STAT3-Y705 was mTOR-dependent as it was strongly reduced in day 100 TSC2−/− spheroids treated chronically with the mTOR inhibitor rapamycin (20 nM, treatment started on day 12 of differentiation, 49.9% +/− 23.7% of vehicle control, Supplementary Fig. 5j). Rapamycin also strongly reduced the expression of GFAP (4.4% +/− 1.6% of control) and increased the expression of neuronal proteins including doublecortin (DCX, 348.1% +/− 15.9% of control), CAMK2A (193.8% +/− 48.3% of control) and GluA1 (153.1% +/− 22.1% of control) in TSC2−/− spheroids (Supplementary Fig. 5j). These data support the idea that mTORC1 signaling is gliogenic and are consistent with a previous report in mice showing that genetic inactivation of mTORC1 suppresses cortical gliogenesis47.
Engineering a conditional TSC2 allele to model a second-hit mutation
Our results in 2D and 3D human neural cultures indicated that homozygous loss of TSC1 or TSC2 profoundly affects the developmental regulation of mTORC1 signaling, cell morphology, and neuron-glia differentiation. Notably, we found minimal to no alterations in heterozygous cells. These results are consistent with the idea that tuber cells arise from a somatic second-hit mutation that causes biallelic inactivation of TSC1 or TSC2. To test this, we generated a model that recapitulates a second-hit mutation by engineering hESCs with a conditional allele of TSC2. This cell line has a constitutive loss-of-function mutation in one allele and a Cre-inducible conditional mutation in the second allele (TSC2−/c; Fig. 4a and Supplementary Fig. 1b). We chose to target TSC2 since the majority of patient mutations are in TSC248 and homozygous loss of TSC2 generally caused more severe phenotypes compared to TSC1 (see Fig. 2, 3 and Supplementary Fig. 3 and 5). We confirmed that viral delivery of Cre recombinase to neurons differentiated in 2D from TSC2−/c hESCs resulted in loss of TSC2 protein and upregulation of mTORC1 signaling (Fig. 4b). To allow for the visualization and fate mapping of Cre-expressing cells, we generated a tdTomato Cre-reporter allele in the TSC2−/c hESCs by targeting the AAVS1 safe harbor locus49 with CRISPR/Cas9 (we refer to this cell line as TSC2−/c;LSL-tdTom, Fig. 4c). We validated the pluripotency of TSC2−/c;LSL-tdTom hESCs with OCT4 and NANOG staining and teratoma formation assays (Supplementary Fig. 1h,m-r).
Figure 4. Conditional inactivation of TSC2 models a second-hit mutation.

(a) CRISPR/Cas9-based gene editing strategy to create a conditional allele of TSC2. (b) Representative western blots of lysates from TSC2−/c neurons in 2D culture treated with either GFP or Cre lentivirus on day 2 of differentiation and harvested on day 21. This experiment was replicated two times (only one experiment with two cultures per treatment is shown). (c) To generate a Cre-reporter allele, a gene trap approach was used to insert a CAGGS promoter-floxed-STOP-tdTomato cassette into the AAVS1 locus of TSC2−/c hESCs (TSC2−/c;LSL-tdTom). (d) TSC2−/c;LSL-tdTom hESCs were differentiated into 2D cultures of neural precursor cells (NPCs). Sub-saturating amounts of Cre-GFP and GFP lentivirus were added on day 10 post-neural induction (passage 3) and cells were harvested on day 25 (passage 6). Scale bar represents 50 μm. This experiment was replicated with four separate cultures, from one differentiation. (e) Cre-GFP and GFP viruses were added to neurons on day 5 post-neuronal differentiation and neurons were harvested on day 75. Cre-expressing cells are marked by tdTomato expression (red). This experiment was replicated with five separate cultures, from one differentiation. (f-i) Box-and-whisker plots display quantification of p-S6 Ser240/244 levels per cell for NPCs (f) and neurons (g), and cross-sectional area for NPCs (h) and neuron somas (i) in 2D culture; center line, median; box limits, 25th to 75th percentile; whiskers, minimum to maximum. n= 58 GFP-positive NPCs, 83 Cre-positive NPCs, 83 GFP-positive neurons, and 24 Cre-positive neurons. ***, P<0.001, Kolmogorov-Smirnov test (PNPC pS6=0.0003, Pneuron pS6<0.0001, PNPC size=0.0001, Pneuron size<0.0001). (j) Sholl analysis (mean +/− s.e.m.) of dendritic arborization of day 75 neurons in 2D culture expressing either GFP or Cre. Two-way repeated measures ANOVA P values are shown, see Supplementary Table 2 for F values and degrees of freedom. n=16 GFP-positive neurons and 7 Cre-positive neurons (from five separate cultures from one differentiation). (k) Representative confocal image of a section from a day 110 TSC2−/c;LSL-tdTom cortical spheroid showing a region of tdTomato-positive TSC2 homozygous mutant cells (arrow). Scale bar represents 250 μm. (l) Higher magnification image from panel k showing enlarged and dysmorphic tdTomato-positive cells. Scale bar represents 25 μm. The experiment in panels k and l was replicated three times (three separate differentiations). (m) Confocal image of a section from a day 205 TSC2−/c;LSL-tdTom cortical spheroid. Scale bar represents 250 μm. (n) Higher magnification image from panel m. Scale bar represents 25 μm. The experiment in panels m and n was performed once. (o) Confocal images of a day 110 TSC2−/c;LSL-tdTom cortical spheroid section stained with an antibody against nestin (green). Scale bars represent 25 μm. This experiment was performed once. For panels k-o, DAPI staining is in blue.
To test how biallelic inactivation of TSC2 cell autonomously affects neuronal development, we differentiated TSC2c/−;tdTom hESCs, treated with Cre just prior to differentiation, into 2D cultures of NPCs and neurons42 (Fig. 4d,e). We found that Cre-expressing tdTomato-positive cells, which were homozygous mutant for TSC2, exhibited significantly increased p-S6 levels compared to neighboring GFP-expressing heterozygous cells (Fig. 4f,g and Supplementary Fig. 6a,b). tdTomato-positive cells were also enlarged compared to neighboring cells (Fig. 4h,i). In addition to soma enlargement, neurons with a second-hit TSC2 mutation exhibited significant dendritic hypertrophy measured by Sholl analysis (Fig. 4j). We also observed highly enlarged, multinucleated tdTomato-positive TSC2 mutant cells that resembled “giant cells”; a unique cell type found in TSC patient tubers6 (Supplementary Fig. 6c). Multiple nuclei were not observed in TSC2 heterozygous cells. These results demonstrate that cell autonomous changes in mTORC1 signaling are sufficient to cause enlarged and dysmorphic cells resembling those found in tubers.
Biallelic inactivation of TSC2 in cortical spheroids
To test whether biallelic inactivation of TSC2 in developing cortical spheroids causes the formation of dysplastic cells, we differentiated TSC2−/c;LSL-tdTom hESCs into cortical spheroids and treated them with a sub-saturating amount of Cre and GFP virus on day 12 post-differentiation, during the neural progenitor expansion phase. We confirmed that tdTomato-positive NPCs in cortical spheroids were enlarged (Supplementary Fig. 5d,e), consistent with complete loss of TSC2 and activation of mTORC1. We found that Cre-expressing TSC2−/c cells gave rise to highly dysmorphic neurons, glial-lineage cells, and giant cells that became larger over time (Fig. 4k-o and Supplementary Fig. 6f-h). These cells were phenotypically similar to those observed in cortical tubers from TSC patients6,50. Specifically, the cells were hypertrophic and dysplastic with high levels of p-S6 and diffuse cytoplasmic expression of the filament proteins nestin, vimentin, and SMI-311 (Fig. 4k-o and Supplementary Fig. 5f,g). In addition, some tdTomato-positive TSC2−/c cells co-expressed neuronal (MAP2) and glial (S100B) proteins (Supplementary Fig. 5h), which has been observed in patient tuber cells50. Importantly, cytomegalic cells did not develop in Cre-treated TSC2+/c spheroids (Supplementary Fig. 5i); indicating that biallelic inactivation of TSC2 is required for the formation of dysplastic cells.
We next tested whether a second-hit mutation is required for dysplastic cells to form in the context of TSC patient cells. To do this we reprogrammed fibroblasts from a TSC patient (Coriell cell line #GM04520) into iPSCs (Supplementary Fig. 1k and Supplementary Table 1). This patient has a heterozygous deletion of exons 1-14 of TSC2 (Supplementary Fig. 7a) and a history of childhood seizures and mild intellectual disability. To generate a conditional second-hit allele, we first deleted exon 5 of the patient’s wild-type TSC2 allele using CRISPR/Cas9 and then introduced a conditional exon 5 allele using the same strategy as for TSC2−/c hESCs (Supplementary Fig. 7b,c). The resulting hiPSC line has the patient mutation in one TSC2 allele and a conditional loss of function mutation in the second allele (referred to as 4520−/c, Supplementary Fig. 1l and Supplementary Table 1).
4520−/c hiPSCs were differentiated into cortical spheroids and Cre-GFP virus was added 12 days post-differentiation. On day 100, we found that Cre-expressing cells were dysmorphic, had high levels of p-S6, and were positive for vimentin (Supplementary Fig. 7d). Neighboring uninfected cells did not exhibit characteristics of tuber cells, indicating that biallelic inactivation is necessary for dysplastic cell formation in TSC patient-derived cortical spheroids.
Rescue of neuronal differentiation and morphology with rapamycin treatment
To test whether the formation of dysplastic cells in TSC2−/c;LSL-tdTom cortical spheroids could be prevented or rescued by blocking mTORC1 signaling, we treated spheroids with rapamycin at different time points during development (Supplementary Fig. 8a). For all conditions, sub-saturating amounts of Cre and GFP virus were added on day 12 and spheroids were harvested on day 110.
We found that chronic rapamycin starting on day 12 strongly reduced mTORC1 signaling in both heterozygous and homozygous TSC2 mutant cells and prevented cellular hypertrophy induced by biallelic TSC2 inactivation (Fig. 5a-e and Supplementary Fig. 8b,c). To assess neuronal differentiation, we calculated the percentage of tdTomato (Cre) or GFP-positive TSC2−/c cells that expressed the neuronal marker HuC/D or the glial protein S100B on day 110 (Fig. 5d-g). For GFP-labeled TSC2 heterozygous cells, 15.8% of cells expressed HuC/D, 34.2% expressed S100B, and 50% were not labeled by either marker (Fig. 5h). The unlabeled cells likely represent neural progenitors or immature neurons and glia. Consistent with findings in the constitutive TSC2−/− spheroids, tdTomato-positive TSC2 homozygous mutant cells preferentially generated glial-lineage cells over neurons at a ratio of 7.3 to 1 (72.6% S100B positive vs. 9.9% HuC/D positive, Fig. 5i). We confirmed that the majority of tdTomato-positive cells were likely astrocytes by immunostaining with additional astrocyte markers including EAAT1 and CD44 (Supplementary Fig. 8f,g). Chronic rapamycin starting on day 12 completely reversed the glial differentiation bias, causing tdTomato-positive TSC2−/c cells to generate neurons at the expense of astrocytes (9.9% S100B positive vs. 70.4% HuC/D positive, Fig. 5i). Chronic rapamycin also nearly tripled the percentage of neurons generated by GFP-positive cells (from 15.8% to 46.5% HuC/D positive, Fig. 5h). These findings are consistent with our western blot results with rapamycin-treated TSC2−/− spheroids (see Supplementary Fig. 5j), indicating that suppression of mTOR signaling acts downstream of the TSC1/2 complex to promote neuronal differentiation and inhibit or delay glial-lineage cell production.
Figure 5. Cellular hypertrophy and neuronal differentiation defects in TSC2 mutant cells can be prevented by early rapamycin treatment.
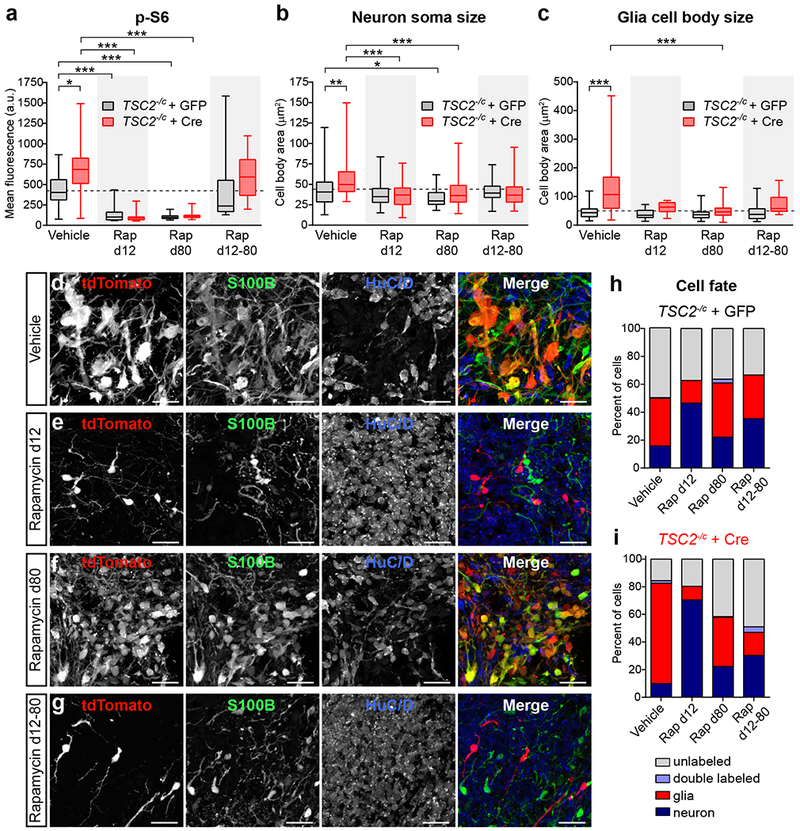
(a-c) Box-and-whisker plots display quantification of p-S6 Ser240/244 levels per cell (a), neuron soma size (b), and glia cell body size (c) for GFP (grey) and Cre (red) expressing cells in TSC2−/c;LSL-tdTom spheroids from the indicated treatment groups; center line, median; box limits, 25th to 75th percentile; whiskers, minimum to maximum. Dashed lines indicated the means of vehicle-treated GFP-positive cells. Rap=20 nM rapamycin. Data were analyzed with a Kruskal-Wallis test followed by Dunn’s multiple comparison test. Significant differences are indicated: *, P=0.05; **, P=0.01; ***, P=<0.001. See Supplementary Table 2 for sample sizes and exact P values for all comparisons. (d-g) Representative confocal images of HuC/D and S100B immunostained sections from day 110 TSC2−/c;LSL-tdTom spheroids treated with vehicle (d), rapamycin from days 12-110 (d12, e), rapamycin from days 80-110 (d80, f), or rapamycin from days 12-80 (d12-80, g). Scale bars represent 25 μm. This experiment was replicated in 2 spheroids for vehicle, 3 spheroids for Rap d12, 3 spheroids for Rap d80, and 4 spheroids for Rap d12-80. (h,i) Graphs display the percentage of GFP (h) or Cre (i) positive cells expressing HuC/D (“neuron”, dark blue), S100B (“glia”, red), both markers (“double labeled”, light blue), or neither marker (“unlabeled”, grey) for each rapamycin condition. See Supplementary Table 2 for the sample sizes for each condition.
To test whether rapamycin treatment could reverse the phenotypes of TSC2 loss, we treated spheroids with rapamycin starting on day 80. Chronic rapamycin from day 80-110 strongly reduced mTORC1 signaling and reversed cellular hypertrophy to a similar extent as day 12-110 rapamycin treatment (Fig. 5a-f and Supplementary Fig. 8b-d). Rapamycin from day 80-110 also improved the neuronal differentiation of tdTomato-positive TSC2−/c cells (from 9.9% to 22.3% HuC/D positive, Fig. 5i); however, the effect was more modest compared to day 12-110 treatment. Rapamcyin from day 80-110 had little effect on neuronal differentiation in GFP-positive cells (15.8% vs. 22.1% HuC/D positive, Fig. 5h). These results suggest that 1) the majority of neuronal cell fate decisions are made prior to day 80 in the cortical spheroid model and 2) rapamycin treatment cannot reverse this decision.
Based on these findings, we tested whether rapamycin treatment during the primary period of neuronal differentiation (from day 12 to 80) could prevent phenotypes due to homozygous loss of TSC2. We found that rapamycin treatment from day 12-80 improved neuronal differentiation in tdTomato-positive TSC2−/c cells (from 9.9% to 30.3% HuC/D positive), albeit to a lesser degree than in spheroids continuously treated with rapamycin (Fig. 5i). Despite improvements in neuronal differentiation, upon rapamycin withdrawal at day 80, tdTomato-positive TSC2−/c cells reactivated mTORC1 signaling to a similar level as vehicle treated mutant cells (Fig. 5a and Supplementary Fig. 8e).
Taken together, these results suggest that there is a developmental window for pharmacologic mTORC1 suppression to prevent neuronal differentiation defects caused by loss of TSC2. Later rapamycin treatment cannot reverse cell fate decisions that have already been made, but can rescue mTORC1 hyperactivation and reduce neuron and glia hypertrophy. Sustained mTORC1 inhibition is required to prevent the reemergence of mTORC1 hyperactivity in differentiated cells.
Discussion
In this study, we generated a panel of human pluripotent stem cell lines with targeted loss-of-function mutations in the TSC1 and TSC2 genes and used this genetically controlled system to investigate the contributions of TSC-mTOR signaling to human cortical development. We found that mTORC1 signaling is strongly suppressed during human neuronal differentiation and that this is required for normal neuro- and gliogenesis. Homozygous, but not heterozygous, loss of TSC1 or TSC2 disrupts the developmental suppression of mTORC1 signaling resulting in abnormal differentiation and hypertrophy of human neurons and glia. We provide direct support for the second-hit hypothesis of cortical tuber formation, as biallelic inactivation of TSC2 in NPCs was necessary and sufficient to cause the formation of dysplastic cells in human cortical spheroids. Lastly, we demonstrate that mTOR inhibition during a critical developmental period prevents the formation of dysplastic cells by promoting neuronal differentiation and preventing cellular hypertrophy.
A major finding of our study is that bidirectional changes in mTORC1 signaling profoundly affect the balance of neurons and glia in developing human cortical spheroids. Specifically, mTORC1 hyperactivation resulted in greater production of glial-lineage cells, which include astrocytes, at the expense of neurons. By contrast, mTORC1 suppression strongly promoted neurogenesis and impaired gliogenesis. These effects were observed both in cortical spheroids with constitutive mutations in TSC2 and in cells with a second-hit TSC2 mutation, which generated seven times more glia than neurons. The latter result suggests a cell autonomous change in cell fate decision, as neighboring TSC2 heterozygous cells produced higher neuron to glia ratios. These findings are consistent with histological observations of large numbers of astrocytes in cortical tubers6,51, mouse studies demonstrating increased GFAP expression following loss of Tsc1 or Tsc210,13,14, and recent studies showing reduced neuronal and increased glial markers in 2D human TSC2−/− neural cultures52,53.
In the developing human cortex, early neuroepithelial progenitors give rise to radial glia, which can divide symmetrically to produce more radial glia, or asymmetrically to produce a neuron or an astrocyte18,21. The mechanisms underlying neuron-astrocyte cell fate decisions in human cortex are not well understood, however studies in mice have identified a cascade of intrinsic and extrinsic signaling events that govern time-dependent shifts from progenitor self-renewal to neurogenesis to gliogenesis45. Our findings demonstrate that suppression of mTORC1 signaling during the transition from proliferation to neuronal differentiation (between day 25 and 43 in the cortical spheroid model) is required for normal neurogenesis.
Mechanistically, mTORC1 could be inhibiting neurogenic gene expression programs, activating gliogenic signaling pathways, or increasing glial proliferation. In contrast to a study using 2D neural cultures derived from a TSC patient hiPSC line54, we did not find significant increases in the proportion of Ki-67-positive glia in cortical spheroids with TSC mutations. Instead, we found that Y705 phosphorylation of the gliogenic transcription factor STAT3 was significantly elevated in TSC1−/− and TSC2−/− cortical spheroids in a rapamycin-sensitive manner, consistent with previous observations in 2D mouse and human neural cultures10,13,52. Importantly, we found that p-STAT3 levels were increased prior to the onset of neurogenesis in TSC mutant spheroids. Since neurogenic and gliogenic signals suppress one another, the activation of STAT3 may directly promote gliogenesis, while at the same time interfering with or delaying neurogenesis. In addition to increased glial cell production, it is also possible that high mTORC1 signaling may impair the survival of newborn neurons10,53, further contributing to altered neuron:glia ratio.
Our finding that rapamycin treatment early in cortical spheroid development alters cell fate decisions, even in TSC2+/− cells, has important clinical implications. Rapamycin derivatives called rapalogues are used clinically to treat TSC and related disorders28, and it has been suggested that prenatal rapalogue treatment could be beneficial to prevent developmental abnormalities in TSC. We find that strong mTORC1 suppression alters the normal pattern of cortical differentiation. This suggests that prenatal rapamycin, while effective at preventing cellular phenotypes caused by mTORC1 hyperactivation, may be detrimental to the developing brain, consistent with behavioral studies in mice exposed to rapamycin in utero55. Our models will facilitate further testing of therapeutics for TSC and allow the definition of critical windows for treatment to have the most impact without causing detrimental outcomes.
Here we provide causal evidence that second-hit mutations are necessary and sufficient to generate dysplastic cells in developing human cortical tissue. While this has been proposed to occur28,29, second-hit mutations have only been detected in a subset of cortical tubers examined31,35–37. This is in contrast to TSC-related hamartomas including subependymal giant cell astrocytomas, in which second-hit events are frequently observed30–34. Using conditional TSC2 knock-out hESCs and patient-derived hiPSCs, we show that a sporadic second-hit mutation in TSC2−/c NPCs causes the formation of dysplastic cells in human cortical spheroids. These cells are strikingly similar to those observed in TSC patient tubers. Specifically, we find cell types resembling dysmorphic neurons, dysplastic glia, and giant cells that are hypertrophic and have high levels of mTORC1 signaling50. These cells express many of the same markers that have been observed in patient tubers6. Importantly, we did not observe tuber cell features in heterozygous TSC1 or TSC2 cells, or in TSC2+/c cells treated with Cre, demonstrating that biallelic inactivation is necessary for the generation of dysplastic cells.
One possible reason that second-hit mutations have not been consistently identified in TSC patient brain tissue is that tubers comprise a mixture of cell types of different origin. Tubers contain dysmorphic cells with high mTORC1 activity as well as normal-appearing neurons and glia. Additionally, immune cells infiltrate the tubers56, further diluting the numbers of cells with biallelic inactivation. Thus, low allelic frequency may have hindered the identification of somatic mutations. Indeed, in a recently reported focal cortical dysplasia case with a second-hit mutation in TSC2, the somatic mutation was present in only ~7% of brain cells57. Alternatively, mutations may occur in introns58, promoters, or other regulatory regions, or could be large copy number variants, which are not detectable by exome sequencing.
Taken together, our findings support the model that second-hit somatic mutations in small populations of NPCs give rise to the dysplastic cells that comprise cortical tubers. Such a stochastic mechanism can explain the large heterogeneity in tuber number and size among TSC patients. Since higher tuber load is linked to increased severity of epilepsy and intellectual disability, somatic mosaicism may be a key factor underlying the significant heterogeneity in the presentation of neurological phenotypes in TSC patients.
Online Methods
Stem cell research was approved by the University of California, Berkeley’s Stem Cell Research Oversight Committee. Animals were used in accordance to protocols approved by the University of California Berkeley’s Animal Care and Use Committee. See Life Sciences Reporting Summary for additional details about experimental design, cell lines, and reagents used in this study.
hESC cell culture
WIBR3 hESCs (NIH stem cell registry # 0079) were obtained from Dr. Rudolf Jaenisch’s lab and authenticated as reported in Lengner et al, 201059. Human embryonic stem cell culture was carried out as previously described60. Briefly, all hESC lines were maintained on a layer of inactivated mouse embryonic fibroblasts (MEFs) in hESC medium composed of DMEM/F12 (ThermoFisher: 11320-033) supplemented with 20% KnockOut Serum Replacement (KSR) (ThermoFisher: 10828028), 2 mM glutamine (ThermoFisher: 25030-081), 1% non-essential amino acids (ThermoFisher: 11140-050), 0.1 mM β-mercaptoethanol (ThermoFisher: 21985-023), 1000 U/ml penicillin/streptomycin (ThermoFisher: 15140-122), and 4 ng/ml FGF2 (ThermoFisher: PHG0261). Cultures were passaged every 7 days with collagenase type IV (ThermoFisher: 17104019, 1.5 mg/ml) and gravitational sedimentation by washing 3 times in wash media composed of DMEM/F12 supplemented with 5% fetal bovine serum (ThermoFisher: 10082–147) and 1000 U/ml penicillin/streptomycin. All hESC lines were tested monthly for mycoplasma contamination.
hiPSC reprogramming
TSC patient (Coriell cell line #GM04520, referred to here as “4520”) and control BJ fibroblasts (ATCC: CRL-2522) were reprogrammed into induced pluripotent stem cells using a commercial kit that delivers the reprogramming factors via an mRNA-based system61 (Stemgent: 00-071). After reprogramming, cell lines were validated by expression of pluripotency markers and aCGH analysis (Supplementary Fig. 1 and Supplementary Table 1). The patient TSC2 genotype was confirmed by qPCR (Supplementary Figure 7a). All hiPSC lines were tested monthly for mycoplasma contamination.
CRISPR/Cas9 genome editing
Single guide RNAs (Supplementary Table 3) targeting the genomic region of interest were inserted into the CRISPR/Cas9-encoding px330 plasmid62. Following trypsinization (ThermoFisher: 25200056) hESCs, 15 μg of each px330 plasmid and 7.5 μg of a GFP-encoding plasmid were electroporated into approximately 1×10⁷ hESCs and re-plated onto MEFs as previously described60. After 72 hours, cells underwent fluorescence activated cell sorting (FACS) to obtain 1×10⁵ GFP-positive single cells and were then re-plated. After 12 days, 48–72 single-cell derived hESC colonies were manually picked and re-plated onto individual wells. After 7 days, colonies were picked and re-plated, with the remaining cells genotyped using PCR. Genotyping primers are listed in Supplementary Table 3. The same guide RNAs and genotyping strategy used to create TSC2−/− WIBR3 hESCs were used create homozygous deletion of TSC2 exon 5 in the BJ hiPSC line.
To generate a conditional allele of TSC2, we inserted an exon 5 cassette that was flanked by loxP sites into TSC2+/− hESCs. To do this we cloned a new guide RNA targeting the NHEJ junction into px330. A repair plasmid consisting of 500 bp long homology arms, exon 5 surrounded by loxP sites, and a puromycin resistance cassette flanked by FRT sites was created. 15 μg of the px330 and 35 μg of the repair plasmid were electroporated into the desired cells and re-plated onto DR4 MEFs. After 72 hours, puromycin (0.5 μg/mL, ThermoFisher: A11138-02) was added to hESC medium for the next 7 days. Surviving single cell-derived colonies were manually picked and re-plated. Genotyping was repeated as above to confirm the insertion of the puromycin cassette and the re-insertion of the exon through homology directed repair (HDR). The puromycin resistance cassette was then removed through transfection of Flp recombinase mRNA (Miltenyi Biotec: 130-106-769) with a Stemfect RNA transfection kit (Stemgent: 00-0069) and subsequent single-cell derived colony isolation and genotyping. To create the TSC2−/c cell line, the WT exon 5 was excised using the same CRISPR/Cas9 strategy as above. 4520c/− hiPSCs were generated using the same approach.
The tdTomato Cre-reporter cassette was based on the Ai9 construct generated by Dr. Hongkui Zeng63 (Addgene plasmid #22799). The reporter cassette was inserted into the AAVS1 safe-harbor locus64, after exon 1 of the PPP1R12C gene, using the same HDR genome editing methods described above. The STOP cassette (3× STOP-SV40 PA) is excised in the presence of Cre recombinase allowing expression of tdTomato from the CAGGS promoter. tdTomato is expressed in all of the progeny of cells initially infected with Cre lentivirus. All gene-edited hPSC lines were validated by expression of pluripotency markers and aCGH analysis (Supplementary Fig. 1 and Supplementary Table 1).
Teratoma Formation
TSC2−/c;LSL-tdTom hESCs were collected by collagenase treatment (1 mg/ml) and separated from feeder cells by sedimentation. Cells were resuspended in 250 μl of DMEM + 5% FBS and injected subcutaneously into adult NOD-SCID mice (Taconic: NODSC). Teratomas formed within 4-8 weeks, at which time teratomas were isolated, fixed in formalin and embedded in paraffin followed by sectioning and hematoxylin and eosin staining. Whole teratoma images were collected at on a Zeiss Axio Scan.Z1 slidescanning microscope (Plan-Apo 20X/0.8 NA)
Array Comparative Genomic Hybridization (aCGH)
hPSC samples were collected by collagenase treatment (1.5 mg/ml) and separated from feeder cells by sedimentation and subsequently pelleted by centrifugation. Samples were frozen and sent to Cell Line Genetics (Madison, WI) for aCGH analysis. For aCGH, >1 μg of DNA was extracted from samples and run on an Agilent SurePrint G3 Human CGH Microarray covering 60,000 probes evenly spaced across the genome.
Two-dimensional neuronal culture
Neural induction was performed as described previously65, with minor alterations. Single hESCs were initially plated at a density of 50,000/cm2 (1.9×10⁵ cells/well of a 12 well plate) and maintained in complete conditioned hESC media until >90% confluent. hESCs were transferred to induction media supplemented with 100 ng/ul Noggin (R&D Systems: 6057-NG) and 10 μM SB431542 (Selleck Chemicals: S1067) with daily media changes for 10 days. The composition of induction media changed throughout induction with 100% induction media A (A) from days 1-4, 75% A and 25% induction media B (B) on days 5-6, 50% A and 50% B on days 7-8 and 25% A and 75% B on days 9-10. Induction media A is composed of Knockout DMEM (ThermoFisher: 10829018) with 15% KSR, 2 mM l-glutamine, 1% non-essential amino acids, 1000 U/ml penicillin/streptomycin) and 55 μM β-mercaptoethanol. Induction media B is composed of 50% DMEM/F12 media (ThermoFisher: 11320-033), 50% Neurobasal media (ThermoFisher: 21103049), 1× N-2 Supplement (ThermoFisher: 17502048), 1× Glutamax (ThermoFisher: 35050061), 1000 U/ml penicillin/streptomycin (ThermoFisher: 15070063), 0.2% human Insulin (Sigma: I9278) and 0.075% BSA (Sigma: A4503) w/v) as previously described65. After neural induction was complete, cells were dissociated with Accutase (ThermoFisher: A1110501), spun down for 4 minutes at 800 rpm, resuspended in N2 media supplemented with 25 ng/ml FGF and 40 ng/ml EGF (R&D Systems: 236-EG) and replated at 1:2. Cells were passaged as such every 5 days until passage 4, when they were split at 1:3.
Neuronal differentiation from NPCs was commenced at passage 8. NPCs were plated at low density: 80,000/cm2 (8×10⁵ cells/well of a 6 well plate) in 4 mLs of growth media. Growth media (N2B27 media) is composed of 50% DMEM/F12, 50% Neurobasal Media, 1× N-2 Supplement, 1× B-27 Supplement (ThermoFisher: 17504044), 1× Glutamax, 1000 U/ml penicillin/streptomycin and 0.075% BSA w/v. For the first 12 days, growth media was supplemented with 20 ng/ml BDNF (Sigma: SRP3014) and 20 ng/ml NT-3 (Sigma: SRP3128), with half volume media changes every 4 days. On day 30, cells in 6-well plates were dissociated with Accutase and replated onto poly-D-lysine (Sigma: P6407) and laminin-coated (ThermoFisher: 23017015) 12 mm glass cover slips in 24-well plates for immunocytochemistry or PDL-coated BioCoat plates (Corning: 62405-749) for western blotting. Cells were matured until day 50-100 when they were harvested for further processing.
Three-dimensional cortical spheroid differentiation
Three-dimensional differentiation of hESCs and hiPSCs into cortical spheroids was performed as described previously43. Briefly, confluent, undifferentiated colonies of hESCs were removed from MEFs using collagenase. Colonies were washed once with media and suspended in hESC media without FGF2, supplemented with 10 μm Y-27632 and plated into 6-well low attachment plates (Corning: 3471). On days 1-5, media was changed to hESC-FGF2 media, supplemented with 10 μm Dorsomorphin (Abcam: ab146597) and 10 μm SB431542. On day 6, developing spheroids were put into neural induction media composed of Neurobasal-A (ThermoFisher: 10888022), B-27 Supplement–A (ThermoFisher: 12587-010), PenStrep, and Glutamax, supplemented with 20 ng/ml FGF and 20 ng/ml EGF. Media was changed in this manner every day from days 6-15 and then every other day until day 25. From days 25-43, the developing spheroids were grown in neural induction media supplemented with 20 ng/ml BDNF and 20 ng/ml NT-3, with media changes every 4 days. From day 43 on, spheroids were maintained in neural induction media without BDNF or NT-3, with media changes every 4 days until harvest.
Western blotting
2D cultured cells were harvested in lysis buffer containing 2 mM EDTA (Sigma: E5134), 2 mM EGTA (Sigma: E3889), 1% Triton-X (Sigma: T8787), and 0.5% SDS (Sigma: 71736) in 1× PBS with Halt phosphatase inhibitor cocktail (ThermoFisher: PI78420) and Complete mini EDTA-free protease inhibitor cocktail (Roche: 4693159001). Three-dimensional spheroids were harvested in lysis buffer containing 1% SDS, phosphatase inhibitor and protease inhibitor in 1× PBS. Total protein was determined by BCA assay (ThermoFisher: PI23227) and 5-15 μg of protein in Laemmli sample buffer (Bio-Rad:161-0747) were loaded onto 4-15% Criterion TGX gels (Bio-Rad: 5671084). Proteins were transferred to PVDF membranes (Bio-Rad: 1620177), blocked in 5% milk in TBS-Tween for one hour at room temperature (RT), and incubated with primary antibodies diluted in 5% milk in TBS-Tween overnight at 4°C. The following day, membranes were incubated with HRP-conjugated secondary antibodies (Bio-Rad: 170-5046, 1705047) for one hour at RT, washed, incubated with chemiluminesence substrate (Perkin-Elmer: NEL105001EA) and developed on GE Amersham Hyperfilm ECL (VWR: 95017-661). Membranes were stripped with 6M guanidine hydrochloride (Sigma: G3272) to re-blot on subsequent days. Bands were quantified by densitometry using Image J software. Phospho-proteins were normalized to their respective total proteins and non-phospho-proteins were normalized to a β-Actin loading control. Antibody vendors, catalog numbers, and dilutions are listed in Supplementary Table 4.
Immunocytochemistry on two-dimensional cultured cells
Cells plated onto 12 mm glass coverslips were washed in ice-cold 1× PBS with Ca/Mg followed by fixation for 10 minutes in 4% paraformaldehyde (PFA, VWR: 100504-940) and three, five-minute washes in 1× PBS. Coverslips were blocked for one hour at RT in buffer containing 5% normal goat serum (NGS) (ThermoFisher: PCN5000) and 0.3% Triton-X in 1× PBS and incubated in primary antibodies in antibody dilution buffer (1% BSA and 0.3% Triton-X in 1× PBS) overnight at 4°C. The following day, coverslips were washed three times for five minutes in 1× PBS, incubated with secondary antibodies in antibody dilution buffer (1:500) for one hour at RT and washed three times for five minutes in 1× PBS. Coverslips were mounted onto slides with ProLong Gold Antifade mountant with or without DAPI (ThermoFisher: P36934 or P36935) and allowed to set for one day before imaging. Antibody vendors, catalog numbers, and dilutions are listed in Supplementary Table 4.
Immunohistochemistry on three-dimensional spheroids
Spheroids were removed from growth media and washed once in ice-cold 1× PBS with Ca/Mg before being fixed in 4% PFA overnight at 4°C. After fixation, spheroids were placed into a conical tube containing 30% sucrose solution overnight at 4°C and allowed to settle. The following day, spheroids were frozen in tissue blocks with OCT compound (Fisher: 23-730-571) and sectioned on a cryostat into 10 or 16 μm sections. Sections were washed once with PBS and blocked in buffer containing 10% NGS, 0.1% BSA and 0.3% Triton-X in 1× PBS for one hour at RT. Sections were then incubated overnight at 4°C in primary antibodies in antibody dilution buffer (2% NGS and 0.1% Triton-X in 1× PBS). The following day, sections were washed three times with 1× PBS, incubated in secondary antibody (1:500 in antibody dilution buffer) for one hour at RT and washed again three times with 1× PBS. Slides were coverslipped with ProLong Gold Antifade mountant with or without DAPI and allowed to set for one day before imaging. Antibody vendors, catalog numbers, and dilutions are listed in Supplementary Table 4.
Quantitative PCR
RNA was extracted from whole spheroids using an RNeasy kit (Qiagen: 74104) with an on-column DNAse digestion. RNA levels and purity were assessed with a NanoDrop spectrophotometer. Reverse transcription was performed using random hexamer primers and Superscript III reverse transcriptase (ThermoFisher: 18080051). Real-time PCR was performed in triplicate on 600 ng of cDNA using an Applied Biosystems QuantStudio 6 Flex Real-Time PCR System with SYBR FAST qPCR Master Mix (Kapa Biosystems: 07959389001). Values for all genes were normalized to β-actin for each sample. qPCR primer sequences are listed in Supplementary Table 3.
Lentiviral infection
CMV promoter-driven Cre-GFP, Cre-RFP, and/or GFP lentivirus (Kerafast: FCT073, FCT192, and FCT004, titer >1.0×10⁸ CFU/ml) were added to cell culture media at the indicated time points. For high efficiency infection for western blot experiments, 2.0 μl per well was used in 24-well plates. For sparse infection, 0.25-0.5 μl per well was used in 6-well plates. This amount of Cre-GFP or Cre-RFP virus resulted in Cre expression in approximately 10-15% of the cells in the spheroid or 2D culture.
Sholl Analysis
Cultured two-dimensional TSC2−/c;LSL-tdtom neurons were treated with Cre lentivirus on day 5 of neural induction and fixed on day 75. Coverslips were stained with MAP2 antibody and subsequently imaged. Multiple cells per coverslip were traced by hand using the MAP2 channel. Cell traces were imported into ImageJ and analyzed using the built-in Sholl analysis feature. Concentric circles of 5 μm up to 160 μm from the center of the soma were used for quantification of dendritic intersections.
Rapamycin treatment
20 mM rapamycin (LC Laboratories: R-5000) stock solution was prepared in ethanol and stored at −20°C. Rapamycin stock was diluted to a final concentration of 20 nM and added to spheroids during every media change for the time periods indicated. Ethanol vehicle was added in the same concentration to control samples.
Confocal microscopy and image analysis
Images were taken on either an FV1000 Olympus Fluoview confocal microscope with 10× or 20× objectives or a Zeiss LSM 719 AxioObserver with 20× or 40× objectives. For experiments where two or more conditions were quantitatively compared, the same exposure and acquisition settings were used for each image. All images were processed using ImageJ. Only healthy regions of the spheroids, defined by intact DAPI nuclei, were used for quantification and analysis. To assess cell body size, regions of interest (ROIs) were drawn around each cell in Image J. ROIs were saved and applied to the p-S6 images where mean fluorescence units averaged across the ROI were used as the p-S6 value for that cell. For images analyzed for the presence or absence of cellular markers, a threshold was set based on the background fluorescence level and applied to all ROIs. If the mean fluorescence units averaged across the ROI were above the threshold, the cell was considered positive for the marker. For the analysis of cell fate in Figure 5, cells were analyzed from 2-4 spheroids per condition (as indicated in Supplementary Table 2) and the percentage of HuC/D and/or S100B positive cells out of the total population of GFP or tdTomato-positive cells analyzed was quantified.
Statistics summary
Sample sizes were chosen based on previous studies. All samples were included in the analysis. Spheroids were randomly assigned to rapamycin or vehicle treatment groups. The investigator was blind to genotype for image analysis of constitutive spheroids. Other quantifications were not performed blindly. Statistical analysis was performed using GraphPad Prism software and the specific test for each experiment is noted in the figure legend and in Supplementary Table 2. To compare the means of two normally distributed groups, an unpaired two-tailed t-test was used. To compare the distributions between two groups, a Kolmogorov-Smirnov test was used. To compare the means of three or more groups, a one-way ANOVA was used followed by Bonferroni’s or Sidak’s multiple comparisons test. For data sets with three or more groups with non-normal distributions or different numbers of samples per condition, a Kruskal-Wallis test was used followed by Dunn’s multiple comparisons test. To compare two independent variables a two-way ANOVA was used with Dunnett’s or Tukey’s multiple comparisons test. Reported P values are adjusted for multiple comparisons for experiments with three or more groups. Supplementary Table 2 lists the statistical test, sample sizes, sample definition, P values, F values, t values, degrees of freedom, and confidence intervals for all comparisons.
Data availability statement
The data that support the findings of this study are available from the corresponding author upon reasonable request.
Supplementary Material
Acknowledgements
We thank the members of the Bateup and Hockemeyer labs for their technical advice and feedback on this work. We would like to acknowledge the Berkeley Stem Cell Center and Siebel Stem Cell Institute. We thank Y. Han for her early work on this project and F. Lorbeer for her help with the teratoma formation assay. This work was supported by a Predoctoral Award from the American Epilepsy Society (to J.D.B.), Frederick Banting and Charles Best Canada Graduate Scholarship from Canadian Institutes for Health Research (no. 356733 to J.D.B.), Brain Research Foundation Seed Grant (no. BRFSG-2014-02 to H.S.B.), Hellman Family Faculty Fund Award (to H.S.B.), NINDS R01 (no. R01NS097823 to H.S.B.), Sloan Research Fellowship in Neuroscience (no. FR-2015-65790 to H.S.B.), and NCI R01 (no. R01CA196884 to D.H.). D.H. is a Pew-Stewart Scholar for Cancer Research supported by the Pew Charitable Trusts and the Alexander and Margaret Stewart Trust.
Footnotes
Competing Interests Statement
The authors declare no competing financial or non-financial interests.
References
- 1.van Slegtenhorst M, et al. Identification of the tuberous sclerosis gene TSC1 on chromosome 9q34. Science 277, 805–808 (1997). [DOI] [PubMed] [Google Scholar]
- 2.Chromosome European 16 Tuberous Sclerosis, C. Identification and characterization of the tuberous sclerosis gene on chromosome 16. Cell 75, 1305–1315 (1993). [DOI] [PubMed] [Google Scholar]
- 3.Crino PB, Nathanson KL & Henske EP The tuberous sclerosis complex. N Engl J Med 355, 1345–1356 (2006). [DOI] [PubMed] [Google Scholar]
- 4.Thiele EA Managing and understanding epilepsy in tuberous sclerosis complex. Epilepsia 51 Suppl 1, 90–91 (2010). [DOI] [PubMed] [Google Scholar]
- 5.Curatolo P, Moavero R & de Vries PJ Neurological and neuropsychiatric aspects of tuberous sclerosis complex. Lancet Neurol 14, 733–745 (2015). [DOI] [PubMed] [Google Scholar]
- 6.Crino PB Evolving neurobiology of tuberous sclerosis complex. Acta Neuropathol 125, 317–332 (2013). [DOI] [PubMed] [Google Scholar]
- 7.Mohamed AR, et al. Intrinsic epileptogenicity of cortical tubers revealed by intracranial EEG monitoring. Neurology 79, 2249–2257 (2012). [DOI] [PubMed] [Google Scholar]
- 8.Sosunov AA, et al. Epileptogenic but MRI-normal perituberal tissue in Tuberous Sclerosis Complex contains tuber-specific abnormalities. Acta Neuropathol Commun 3, 17 (2015). [DOI] [PMC free article] [PubMed] [Google Scholar]
- 9.Jansen FE, et al. Cognitive impairment in tuberous sclerosis complex is a multifactorial condition. Neurology 70, 916–923 (2008). [DOI] [PubMed] [Google Scholar]
- 10.Magri L, et al. Sustained activation of mTOR pathway in embryonic neural stem cells leads to development of tuberous sclerosis complex-associated lesions. Cell Stem Cell 9, 447–462 (2011). [DOI] [PubMed] [Google Scholar]
- 11.Feliciano DM, Su T, Lopez J, Platel JC & Bordey A Single-cell Tsc1 knockout during corticogenesis generates tuber-like lesions and reduces seizure threshold in mice. J Clin Invest 121, 1596–1607 (2011). [DOI] [PMC free article] [PubMed] [Google Scholar]
- 12.Way SW, et al. Loss of Tsc2 in radial glia models the brain pathology of tuberous sclerosis complex in the mouse. Hum Mol Genet 18, 1252–1265 (2009). [DOI] [PMC free article] [PubMed] [Google Scholar]
- 13.Onda H, et al. Tsc2 null murine neuroepithelial cells are a model for human tuber giant cells, and show activation of an mTOR pathway. Mol Cell Neurosci 21, 561–574 (2002). [DOI] [PubMed] [Google Scholar]
- 14.Carson RP, Van Nielen DL, Winzenburger PA & Ess KC Neuronal and glia abnormalities in Tsc1-deficient forebrain and partial rescue by rapamycin. Neurobiol Dis 45, 369–380 (2012). [DOI] [PMC free article] [PubMed] [Google Scholar]
- 15.Goto J, et al. Regulable neural progenitor-specific Tsc1 loss yields giant cells with organellar dysfunction in a model of tuberous sclerosis complex. Proceedings of the National Academy of Sciences of the United States of America 108, E1070–1079 (2011). [DOI] [PMC free article] [PubMed] [Google Scholar]
- 16.Meikle L, et al. A mouse model of tuberous sclerosis: neuronal loss of Tsc1 causes dysplastic and ectopic neurons, reduced myelination, seizure activity, and limited survival. J Neurosci 27, 5546–5558 (2007). [DOI] [PMC free article] [PubMed] [Google Scholar]
- 17.Zeng LH, et al. Tsc2 gene inactivation causes a more severe epilepsy phenotype than Tsc1 inactivation in a mouse model of tuberous sclerosis complex. Hum Mol Genet 20, 445–454 (2011). [DOI] [PMC free article] [PubMed] [Google Scholar]
- 18.Silbereis JC, Pochareddy S, Zhu Y, Li M & Sestan N The Cellular and Molecular Landscapes of the Developing Human Central Nervous System. Neuron 89, 248–268 (2016). [DOI] [PMC free article] [PubMed] [Google Scholar]
- 19.Dehay C & Kennedy H Cell-cycle control and cortical development. Nat Rev Neurosci 8, 438–450 (2007). [DOI] [PubMed] [Google Scholar]
- 20.Florio M & Huttner WB Neural progenitors, neurogenesis and the evolution of the neocortex. Development 141, 2182–2194 (2014). [DOI] [PubMed] [Google Scholar]
- 21.Lui JH, Hansen DV & Kriegstein AR Development and evolution of the human neocortex. Cell 146, 18–36 (2011). [DOI] [PMC free article] [PubMed] [Google Scholar]
- 22.Tee AR, et al. Tuberous sclerosis complex-1 and −2 gene products function together to inhibit mammalian target of rapamycin (mTOR)-mediated downstream signaling. Proceedings of the National Academy of Sciences of the United States of America 99, 13571–13576 (2002). [DOI] [PMC free article] [PubMed] [Google Scholar]
- 23.Saxton RA & Sabatini DM mTOR Signaling in Growth, Metabolism, and Disease. Cell 168, 960–976 (2017). [DOI] [PMC free article] [PubMed] [Google Scholar]
- 24.Ma XM & Blenis J Molecular mechanisms of mTOR-mediated translational control. Nat Rev Mol Cell Biol 10, 307–318 (2009). [DOI] [PubMed] [Google Scholar]
- 25.Inoki K, Li Y, Xu T & Guan KL Rheb GTPase is a direct target of TSC2 GAP activity and regulates mTOR signaling. Genes Dev 17, 1829–1834 (2003). [DOI] [PMC free article] [PubMed] [Google Scholar]
- 26.Chong-Kopera H, et al. TSC1 stabilizes TSC2 by inhibiting the interaction between TSC2 and the HERC1 ubiquitin ligase. J Biol Chem 281, 8313–8316 (2006). [DOI] [PubMed] [Google Scholar]
- 27.Huang J & Manning BD The TSC1-TSC2 complex: a molecular switchboard controlling cell growth. Biochem J 412, 179–190 (2008). [DOI] [PMC free article] [PubMed] [Google Scholar]
- 28.Crino PB The mTOR signalling cascade: paving new roads to cure neurological disease. Nat Rev Neurol 12, 379–392 (2016). [DOI] [PubMed] [Google Scholar]
- 29.Magri L & Galli R mTOR signaling in neural stem cells: from basic biology to disease. Cell Mol Life Sci 70, 2887–2898 (2013). [DOI] [PMC free article] [PubMed] [Google Scholar]
- 30.Au KS, Hebert AA, Roach ES & Northrup H Complete inactivation of the TSC2 gene leads to formation of hamartomas. Am J Hum Genet 65, 1790–1795 (1999). [DOI] [PMC free article] [PubMed] [Google Scholar]
- 31.Henske EP, et al. Allelic loss is frequent in tuberous sclerosis kidney lesions but rare in brain lesions. Am J Hum Genet 59, 400–406 (1996). [PMC free article] [PubMed] [Google Scholar]
- 32.Smolarek TA, et al. Evidence that lymphangiomyomatosis is caused by TSC2 mutations: chromosome 16p13 loss of heterozygosity in angiomyolipomas and lymph nodes from women with lymphangiomyomatosis. Am J Hum Genet 62, 810–815 (1998). [DOI] [PMC free article] [PubMed] [Google Scholar]
- 33.Sepp T, Yates JR & Green AJ Loss of heterozygosity in tuberous sclerosis hamartomas. J Med Genet 33, 962–964 (1996). [DOI] [PMC free article] [PubMed] [Google Scholar]
- 34.Chan JA, et al. Pathogenesis of tuberous sclerosis subependymal giant cell astrocytomas: biallelic inactivation of TSC1 or TSC2 leads to mTOR activation. J Neuropathol Exp Neurol 63, 1236–1242 (2004). [DOI] [PubMed] [Google Scholar]
- 35.Crino PB, Aronica E, Baltuch G & Nathanson KL Biallelic TSC gene inactivation in tuberous sclerosis complex. Neurology 74, 1716–1723 (2010). [DOI] [PMC free article] [PubMed] [Google Scholar]
- 36.Qin W, et al. Analysis of TSC cortical tubers by deep sequencing of TSC1, TSC2 and KRAS demonstrates that small second-hit mutations in these genes are rare events. Brain Pathol 20, 1096–1105 (2010). [DOI] [PMC free article] [PubMed] [Google Scholar]
- 37.Martin KR, et al. The genomic landscape of tuberous sclerosis complex. Nat Commun 8, 15816 (2017). [DOI] [PMC free article] [PubMed] [Google Scholar]
- 38.de Vries PJ & Howe CJ The tuberous sclerosis complex proteins--a GRIPP on cognition and neurodevelopment. Trends Mol Med 13, 319–326 (2007). [DOI] [PubMed] [Google Scholar]
- 39.Blair JD, Hockemeyer D, Doudna JA, Bateup HS & Floor SN Widespread Translational Remodeling during Human Neuronal Differentiation. Cell Rep 21, 2005–2016 (2017). [DOI] [PMC free article] [PubMed] [Google Scholar]
- 40.Thoreen CC, et al. A unifying model for mTORC1-mediated regulation of mRNA translation. Nature 485, 109–113 (2012). [DOI] [PMC free article] [PubMed] [Google Scholar]
- 41.Manning BD & Toker A AKT/PKB Signaling: Navigating the Network. Cell 169, 381–405 (2017). [DOI] [PMC free article] [PubMed] [Google Scholar]
- 42.Chambers SM, et al. Highly efficient neural conversion of human ES and iPS cells by dual inhibition of SMAD signaling. Nat Biotechnol 27, 275–280 (2009). [DOI] [PMC free article] [PubMed] [Google Scholar]
- 43.Pasca AM, et al. Functional cortical neurons and astrocytes from human pluripotent stem cells in 3D culture. Nat Methods 12, 671–678 (2015). [DOI] [PMC free article] [PubMed] [Google Scholar]
- 44.Dibble CC, et al. TBC1D7 is a third subunit of the TSC1-TSC2 complex upstream of mTORC1. Mol Cell 47, 535–546 (2012). [DOI] [PMC free article] [PubMed] [Google Scholar]
- 45.Miller FD & Gauthier AS Timing is everything: making neurons versus glia in the developing cortex. Neuron 54, 357–369 (2007). [DOI] [PubMed] [Google Scholar]
- 46.Bonni A, et al. Regulation of gliogenesis in the central nervous system by the JAK-STAT signaling pathway. Science 278, 477–483 (1997). [DOI] [PubMed] [Google Scholar]
- 47.Cloetta D, et al. Inactivation of mTORC1 in the developing brain causes microcephaly and affects gliogenesis. J Neurosci 33, 7799–7810 (2013). [DOI] [PMC free article] [PubMed] [Google Scholar]
- 48.Au KS, et al. Genotype/phenotype correlation in 325 individuals referred for a diagnosis of tuberous sclerosis complex in the United States. Genet Med 9, 88–100 (2007). [DOI] [PubMed] [Google Scholar]
- 49.Hockemeyer D, et al. Efficient targeting of expressed and silent genes in human ESCs and iPSCs using zinc-finger nucleases. Nat Biotechnol 27, 851–857 (2009). [DOI] [PMC free article] [PubMed] [Google Scholar]
- 50.Mizuguchi M & Takashima S Neuropathology of tuberous sclerosis. Brain Dev 23, 508–515 (2001). [DOI] [PubMed] [Google Scholar]
- 51.Sosunov AA, et al. Tuberous sclerosis: a primary pathology of astrocytes? Epilepsia 49 Suppl 2, 53–62 (2008). [DOI] [PubMed] [Google Scholar]
- 52.Grabole N, et al. Genomic analysis of the molecular neuropathology of tuberous sclerosis using a human stem cell model. Genome Med 8, 94 (2016). [DOI] [PMC free article] [PubMed] [Google Scholar]
- 53.Costa V, et al. mTORC1 Inhibition Corrects Neurodevelopmental and Synaptic Alterations in a Human Stem Cell Model of Tuberous Sclerosis. Cell Rep 15, 86–95 (2016). [DOI] [PubMed] [Google Scholar]
- 54.Li Y, et al. Abnormal Neural Progenitor Cells Differentiated from Induced Pluripotent Stem Cells Partially Mimicked Development of TSC2 Neurological Abnormalities. Stem Cell Reports 8, 883–893 (2017). [DOI] [PMC free article] [PubMed] [Google Scholar]
- 55.Tsai PT, et al. Prenatal rapamycin results in early and late behavioral abnormalities in wildtype C57BL/6 mice. Behav Genet 43, 51–59 (2013). [DOI] [PMC free article] [PubMed] [Google Scholar]
- 56.Boer K, et al. Inflammatory processes in cortical tubers and subependymal giant cell tumors of tuberous sclerosis complex. Epilepsy Res 78, 7–21 (2008). [DOI] [PubMed] [Google Scholar]
- 57.D’Gama AM, et al. Somatic Mutations Activating the mTOR Pathway in Dorsal Telencephalic Progenitors Cause a Continuum of Cortical Dysplasias. Cell Rep 21, 3754–3766 (2017). [DOI] [PMC free article] [PubMed] [Google Scholar]
- 58.Tyburczy ME, et al. Mosaic and Intronic Mutations in TSC1/TSC2 Explain the Majority of TSC Patients with No Mutation Identified by Conventional Testing. PLoS Genet 11, e1005637 (2015). [DOI] [PMC free article] [PubMed] [Google Scholar]
References (Methods only)
- 59.Lengner CJ, et al. Derivation of pre-X inactivation human embryonic stem cells under physiological oxygen concentrations. Cell 141, 872–883 (2010). [DOI] [PubMed] [Google Scholar]
- 60.Blair JD, Bateup HS & Hockemeyer DF Establishment of Genome-edited Human Pluripotent Stem Cell Lines: From Targeting to Isolation. J Vis Exp (2016). [DOI] [PMC free article] [PubMed] [Google Scholar]
- 61.Mandal PK & Rossi DJ Reprogramming human fibroblasts to pluripotency using modified mRNA. Nat Protoc 8, 568–582 (2013). [DOI] [PubMed] [Google Scholar]
- 62.Cong L, et al. Multiplex genome engineering using CRISPR/Cas systems. Science 339, 819–823 (2013). [DOI] [PMC free article] [PubMed] [Google Scholar]
- 63.Madisen L, et al. A robust and high-throughput Cre reporting and characterization system for the whole mouse brain. Nature neuroscience 13, 133–140 (2010). [DOI] [PMC free article] [PubMed] [Google Scholar]
- 64.Mali P, et al. RNA-guided human genome engineering via Cas9. Science 339, 823–826 (2013). [DOI] [PMC free article] [PubMed] [Google Scholar]
- 65.Chambers SM, Mica Y, Studer L & Tomishima MJ Converting human pluripotent stem cells to neural tissue and neurons to model neurodegeneration. Methods Mol Biol 793, 87–97 (2011). [DOI] [PubMed] [Google Scholar]
Associated Data
This section collects any data citations, data availability statements, or supplementary materials included in this article.
Supplementary Materials
Data Availability Statement
The data that support the findings of this study are available from the corresponding author upon reasonable request.