Abstract
The main principles of higher-order protein oligomerization are elucidated by many structural and biophysical studies. An astonishing number of proteins self-associate to form dimers or higher-order quaternary structures which further interact with other biomolecules to elicit complex cellular responses. In this study, we describe a simple and convenient approach to determine the oligomeric state of purified protein complexes that combines implementation of a novel form of clear-native gel electrophoresis and size exclusion chromatography in line with multi-angle light scattering. Here, we demonstrate the accuracy of this ensemble approach by characterizing the previously established pentameric state of the intracellular domain of serotonin type 3A (5-HT3A) receptors.
Keywords: Clear-native PAGE, multi-angle light scattering, native gel electrophoresis, protein oligomerization, protein quaternary structures, size exclusion chromatography
Introduction
The self-assembly of protein species into specific quaternary structures (oligomers) plays an important role in their function and regulation. The constitution of fine-tuned quaternary protein complexes is crucial not only for begetting diversity and specificity of several cellular pathways but also for modulating gene expression, activity of ion channels, receptors, and protein-protein interactions [1–3]. Intrinsically, the supramolecular assembly of proteins enables building of large structures that strategically shield the monomers in a complex which confers protection against denaturation; thereby further improving protein stability [4]. A pathway for both physiological and pathophysiological oligomerization may be provided through 3D domain swapping, a process by which two or more proteins oligomerize by exchanging an identical domain [5]. Therefore, it is of great interest to investigate the biophysical and mechanistic principles governing the production of stable quaternary protein structures to elucidate their unique biological properties. The results of similar studies have the potential to delineate the structural and functional roles of individual players in oligomeric proteins, and thus to provide broad insights into the details of specific multimeric systems as a whole. Nonetheless, a critical stepping stone during the basic experimental investigation is to identify a number of monomeric species that associate noncovalently to form a functional oligomeric protein.
Experimental characterization of the oligomeric states of protein complexes can often pose challenges, partly because of the relative inadequacy, in the currently available literature, of biophysical characterization of known proteins in terms of their quaternary structure [6]. Various experimental methods have been applied over the years, among others, to meet these challenges including, size exclusion chromatography (SEC), native gel electrophoresis, chemical cross-linking, analytical ultracentrifugation, SEC coupled with multi-angle light scattering (SEC-MALS), and cryo-negative staining electron microscopy. Some of these methods require specialized and expensive equipment which compromises their feasibility for use on a routine basis. In addition, due to difficulties associated with the handling of protein samples, as well as data analysis during these procedures, it would be of great advantage to have a reliable, low-cost and simple method to assess the oligomeric state of protein complexes.
In this paper we discuss the development and application of a novel modified clear-native PAGE, we named pseudo clear-native PAGE (pCN-PAGE), which can be broadly employed to quantify the number of monomers present in certain oligomeric proteins. Here, we used our fully characterized chimera of the intracellular domain of 5-HT3A receptors (MBP-5-HT3A-ICD) [7] as a candidate for oligomeric state determination with pCN-PAGE.
Materials and methods
Materials.
Anti-MBP Monoclonal Antibody HRP conjugated (New England Biolabs, Inc., Ipswich, MA); BL21-CodonPlus-(DE3)-RIPL cells (Agilent Technologies, Santa Clara, CA); ampicillin (Fisher Scientific, Fair Lawn, NJ); chloramphenicol (Fisher Scientific); IPTG (Fisher Scientific); leupeptin (AdipoGen Life Sciences, San Diego, CA); pepstatin (AdipoGen Life Sciences); PMSF (Research Products International, Mt. Prospect, IL); TCEP-HCl (Oakwood Chemical, N. Estill, SC); lysozyme (MP Biomedicals, Solon, OH); Protease inhibitor cocktail III (Research Products International); DNAse I (Alfa Aesar, Ward Hill, MA); BSA (Biorad); Serva Blue G (Sigma-Aldrich, St. Louis, MO), Bis-Tris (Sigma-Aldrich); Tricine (Sigma-Aldrich); 6-aminohexanoic acid (Sigma-Aldrich).
Protein expression and cell lysis.
We expressed the MBP-5-HT3A-ICD chimera, as described elsewhere [7], in Escherichia coli (E. coli) BL21-CodonPlus-(DE3)-RIPL cells. The indicated concentrations of reagents, enzymes, antibiotics and all other additives used in cultures as well as other solutions are final unless stated otherwise. For a starter preculture, a single bacterial colony from a selective agar plate was resuspended into 15 ml of Terrific Broth (TB) media (1.2 % (w/v) Tryptone, 2.4 % (w/v) Yeast extract, 0.4 % (v/v) glycerol) supplemented with ampicillin (100 μg/ml), chloramphenicol (34 μg/ml) and 0.2 % (w/v) sterile glucose. Phosphate buffer was added to sustain a physiological pH during the log-phase of bacterial growth. After overnight growth, not exceeding 16 h, at 37 °C with continuous agitation at 250 rpm, 10 ml of this primary bacterial culture was diluted in 1 L of the same media in a 2.8 L baffled culture flask. The culture was grown at 37 °C with vigorous agitation until A600 measured approximately 0.4 – 0.5, and then was cooled down to 18 °C. After supplementing with an additional 100 μg/ml of ampicillin, protein expression was induced with the addition of 0.4 mM IPTG followed by continuation of growth for 8 h at 18 °C, 250 rpm. The cells were harvested by centrifugation at 4,600 g for 15 min at 4 °C and a cell yield of 6–7 g wet weight per liter of culture was recorded. For our experiments, 3 g (wet weight) of cells was resuspended in (10 ml buffer/gram of cell pellet) ice-cold buffer A (20 mM Tris, pH 7.4, 200 mM NaCl, 1 mM TCEP, 2 mM EDTA) supplemented with the freshly prepared protease inhibitor cocktail containing leupeptin (10 μg/ml), pepstatin (10 μg/ml), and 1 mM PMSF. The cell suspension was then subjected to enzymatic cell lysis by addition of lysozyme (100 μg/ml) followed by gentle stirring at 4 °C for 1h. Subsequently, the lysozyme treated cell suspension was frozen at – 80 °C overnight. The next day, the frozen cell suspension was allowed to thaw on ice in the presence of commercially available protease inhibitor cocktail. After the lysed cells were completely thawed, the resultant viscous lysate was passed through a 15 G needle several times while being careful not to form a foam. DNAse I (50 μg/ml), 2 mM MgCl2 and 1 μM CaCl2 were added to the lysate and stirred for 1 h at 4 °C to break down released cellular DNA. This step was optimized to significantly mitigate an inconvenience resulting from the viscosity of the lysate later during affinity column purification. The cell lysate was fractionated by ultracentrifugation at 100,000 g for 1 h at 4 °C. The supernatant corresponding to the cytoplasmic fraction was collected, immediately passed through a 0.2 μm pore-size bottle-top filter, and was stored at 4 °C.
Protein purification by affinity chromatography.
All steps of amylose column purification were performed at 4 °C. 2 ml (bed-volume) of amylose resin (New England Biolabs, Inc.) were washed with 5-bed volumes of 0.2 μm filtered, ice-cold Millipore-pure distilled water using an Econo-Column® Chromatography column (1.5 × 30 cm; Biorad). Washed resin was equilibrated with 5-bed volumes of buffer A and the filtered cytoplasmic fraction was then applied to the column at a constant flow rate of 0.8 ml/min via a peristaltic pump until all the loading solution passed through the gravity-packed resin. We then subjected the column to three consecutive washes each of 10-bed volumes of Buffer A at a controlled flow-rate of 0.5 ml/min. Bound protein was eluted with 5-bed volumes of Buffer A containing 20 mM maltose, at a controlled flow-rate of 0.5 ml/min, as individual 1 ml fractions. We analyzed fractions after SDS-PAGE separation of proteins in a 4–20% precast stain-free gel (Biorad; Mini-PROTEAN® Stain-Free™ gel; the stain free gel contains a trihalo compound that is covalently linked to tryptophans upon UV irradiation for subsequent fluorescent detection of proteins) using an imager (Gel Doc EZ System, Biorad).
Protein purification by size exclusion chromatography (SEC).
The amylose column purified protein (fraction number 2–6; 5 ml of pooled volume) was concentrated using a 100 kDa molecular weight cut-off (MWCO) centrifugal filter (Amicon® Ultra-15, Merck Millipore Ltd., Tullagreen, Ireland) by spinning at 3,500 g at 4 °C until the sample volume was reduced to approximately 2 ml. The concentrated sample volume was then expanded to 12 ml by re-diluting with the sizing buffer B (20 mM HEPES, 150 mM NaCl, 5 mM maltose, 1 mM TCEP, 0.01% NaN3, pH 7.4) and centrifugation was continued at 3,500 g, 4 °C. A280 of the sample being concentrated was measured intermittently to determine its protein concentration using a calculated extinction coefficient of 84,340 M−1 cm−1 and a theoretical mass of 53,455 Da (web.expasy.org/protparam/). We degassed the concentrated sample under vacuum for 20 min and then filtered through a syringe-driven low protein-binding filter of 0.2 μm pore-size (Millex®-GV, Merck Millipore Ltd.). An ENrich™ SEC 650 10 × 300 High-Resolution column (Biorad) was equilibrated in 2 column volumes (1 column volume = 24 ml) of buffer B, and then loaded with 0.25 – 0.5 ml of concentrated purified protein. At ambient temperature, a controlled flow-rate of 0.5 ml/min was maintained during both the column equilibration and the purification run. Elution of the protein was monitored at A280 while collecting 0.5 ml fractions. We analyzed the purity of the SEC purified fractions by separation in a 4–20% precast stain-free gel (Biorad) followed by imaging the gel.
Pseudo clear-native polyacrylamide gel electrophoresis (pCN-PAGE).
We prepared samples containing 6 μg or 3 μg of SEC-purified protein in a final volume of 20 μl or 10 μl, respectively with native sample loading buffer (50 mM Bis-Tris, pH 7.0, 0.5 M 6-aminohexanoic acid (6-AHA), 50 mM NaCl, 10 % (v/v) glycerol) in the absence or presence of Serva Blue G in various final concentrations (in w/v: 0.008%, 0.01%, 0.02%, 0.03%, 0.04% and 0.05). Pre-chilled cathode buffer (15 mM Bis-Tris, 50 mM Tricine, pH 7.0) was poured into the inner chamber, and anode buffer (50 mM Bis-Tris, pH 7.0) into the outer chambers of the gel chromatography apparatus as specified by the manufacturer. The prepared samples differing in dye content were loaded into individual lanes of a NuPAGE™ 4–12% Bis-Tris precast gel (Invitrogen, Thermo Fisher Scientific) along with native high molecular weight (HMW) soluble marker (Amersham™ HMW calibration kit for native electrophoresis, GE Healthcare, Buckinghamshire, UK) in a separate lane. All subsequent steps were performed while the assembled gel apparatus was partially submerged in ice. The gel was initially run at a 15 mA constant current for 10 min followed by 80 V constant voltage for 2–3 h. To extend our method to other proteins, we used bovine serum albumin (BSA) and a heterodimer. The heterodimer protein complex consists of partial proteins representing CstF-64 and CstF-77 with molecular masses of 22 and 12 kDa, respectively (kindly provided by Drs. Clinton MacDonald and Petar Grozdanov) [8]. 3 μg of purified protein samples (MBP-5-HT3A-ICD, BSA or the heterodimer) were incubated with native sample buffer (final volume of 10 μl) in the presence of different concentrations of Serva Blue G (0.03% or 0.04% or 0.05%). The samples were resolved on a NativePAGE™ 3–12% Bis-Tris precast gel (Invitrogen, Thermo Fisher Scientific) under the electrophoretic conditions outlined above except that the gel was run at a 5 mA constant current for 30 min followed by 90 V constant voltage for 3–4 h. To further enhance visibility of the migrated protein bands, the gel was first stained with Bio-Safe™ Coomassie Blue G-250 (Biorad), and imaged. To wash away the dye-front from sample lanes to which Serva Blue G had been added, each gel was destained (25% (v/v) methanol, 10% (v/v) acetic acid) and then re-stained with Coomassie R-250. The gels were imaged using Gel Doc EZ Imager (Biorad).
SEC in-line with multi-angle light scattering (SEC-MALS).
We performed multi-angle static light scattering coupled to size exclusion chromatography (SEC-MALS) at room temperature essentially as previously described [7] to determine the oligomeric state of the purified protein. 0.25 ml of the purified protein sample (0.1 – 1 mg) was applied to an ENrich™ SEC 650 10 × 300 High-Resolution column (Biorad) thoroughly pre-equilibrated with buffer B. The SEC column was connected in-line to a miniDAWN-TREOS multi-angle light scattering apparatus, and an Optilab T-rEX differential refractive index apparatus (Wyatt Technology, Santa Barbara, CA). The detectors were normalized to BSA as per the manufacturer’s directions. A controlled flow-rate of 0.5 ml/min was ensured and the data were recorded using the ASTRA V software (Wyatt Technology, Santa Barbara, CA). Finally, we determined the molecular mass and the weight averaged molar mass of the protein species, eluting as a monodisperse peak at A280, using a Debye fit method and a protein dn/dc ratio of 0.185 ml/g, respectively.
Results
Overexpression of the MBP-5-HT3A-ICD in E. coli.
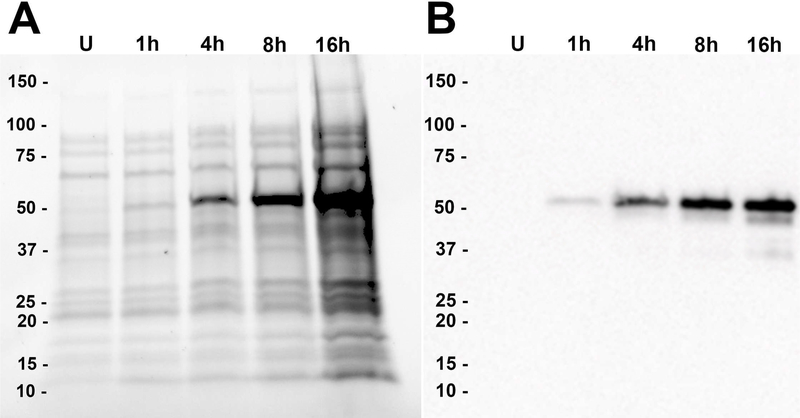
The cDNA for the intracellular domain of the mouse 5-HT3A receptor tethered to the shortened C-terminus of maltose-binding protein (MBP) via a short alanine linker was cloned into a modified pMAL-c2x (pMALX) vector for partial heterologous expression of MBP-5-HT3A-ICD in E.coli [9]. Short linkers may preclude excessive flexibility, and favor carrier-driven crystallization [10]. Fig. 1 shows the results of an optimization-scale expression test. Upon electrophoresis under denaturing conditions, IPTG-induced bacteria carrying the overexpressed fusion protein showed a corresponding band at approximately 53 kDa (Fig. 1A). This is substantially in agreement with the theoretical mass of the MBP-5-HT3A-ICD construct of 53.4 kDa. This band was absent in the non-expressing un-induced cells. The identification of the ~ 53 kDa protein as MBP-5-HT3A-ICD was further reinforced by subjecting the gel to a Western blot analysis which involved the successful probing of the protein band with MBP-HRP antibody (Fig. 1B).
Fig. 1. SDS-PAGE and Western blot analysis of MBP-5-HT3A-ICD expression in E. coli.
A, 1 ml sample of uninduced (U) or induced culture of E. coli cells (at 1 h, 4 h, 8 h and 16 h after induction) was centrifuged at 4,600 g for 15 min and each cell pellet was lysed in 1% SDS. The resultant whole-cell lysates in loading samples were normalized to the cell density of uninduced culture using OD600, and were resolved on a 4–20 % Mini-PROTEAN® Stain-Free™ for protein expression analysis. B, Protein bands from the same gel were transferred onto a PVDF membrane and probed by the anti-MBP monoclonal antibody (HRP conjugated) in 1:100,000 dilution.
Recombinant protein purification.
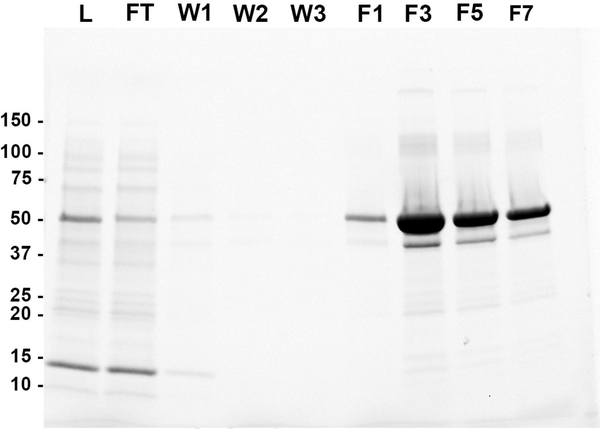
Here, we utilized a two-step purification strategy to produce high-quality purified protein in several milligram quantities. Firstly, MBP-5-HT3A-ICD was purified by amylose-resin affinity chromatography with typical yields of approximately 4–5 mg of purified protein per gram of wet weight cells. Affinity chromatography fractions were separated by SDS-PAGE. Imaging of the stain-free gel demonstrated the purification of a major protein species at ~ 53 kDa which corresponds to MBP-5-HT3A-ICD (Fig. 2). A faint companion band running at slightly lower molecular weight than the major band was observed at ~ 42 kDa. This band may be produced as a result of the incomplete translation of the fusion protein by bacteria, and/ or some degree of proteolysis after expression [11].
Fig. 2. Affinity column purification of the MBP-5-HT3A-ICD.
Amylose-resin column chromatography was used to purify the chimera. The quality of purification was systematically analyzed at various steps (L, loading material; FT, flow-through; W1–3, three consecutive washes; F1–7, alternate elution fractions) by SDS-PAGE.
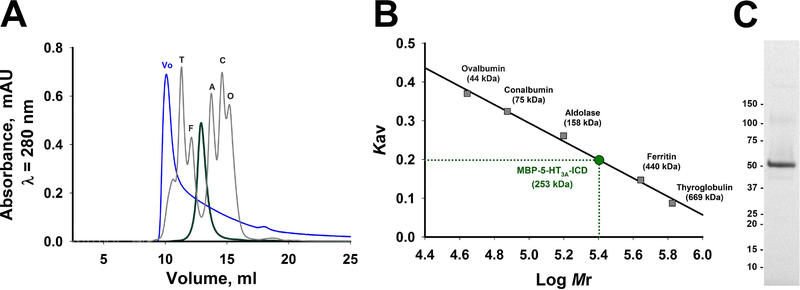
Collectively, the results indicate that the fusion protein efficiently bound to and eluted from the amylose-resin affinity column. Secondly, a final polishing step of size-exclusion chromatography (SEC) was employed in protein purification to yield homogenously pure protein. SEC provides information on apparent molecular size of the purified protein in solution in addition to that on monodispersity and protein purity. When amylose column purified MBP-5-HT3A-ICD was passed through the SEC column, a minimal amount of protein was observed in the void volume, and a single well-resolved peak was eluted at an elution volume of 12.8 ml. After a single pass through the column, fractions corresponding to the peak were pooled and reapplied to investigate protein stability and ensure the peak position (Fig. 3A). The SDS-PAGE analysis of the SEC-purified protein established its high purity (Fig. 3C). The use of 100 kDa MWCO centrifugal filter for concentrating the amylose column purified protein (see methods) significantly removed the 42 kDa protein from the sample prior to subjecting it to SEC. The non-denaturing SEC confirmed that amylose column purified MBP-5-HT3A-ICD was a homogenously pure, monodisperse and stable pentamer with an apparent molecular weight of 253 kDa (Fig. 3A and 3B), consistent with our previously reported results elsewhere [7].
Fig. 3. Oligomeric state of the MBP-5-HT3A-ICD chimera predicted by size exclusion chromatography (SEC).
For the second purification step, the chimera was passed through an ENrich™ SEC 650 10 × 300 High-Resolution column (Biorad) at a flow rate of 0.5 ml/min. A, The eluate was monitored continuously at A280 when the single major peak corresponding to the chimera was detected at an elution volume of 12.8 ml (green trace). In a separate run, a mixture of well-defined protein standards of known high molecular weights was resolved on the same SEC column (gray trace; T, thyroglobulin 669 kDa; F, ferritin 440 kDa; A, aldolase 158 kDa; C, conalbumin 75 kDa; O, ovalbumin 44 kDa). The void volume (Vo, 10.03 ml) of the column was determined by monitoring the elution profile of Blue Dextran 2000 (blue trace). C, The quality of SEC purified protein was ascertained by SDS-PAGE.
Determination of the oligomeric state by pCN-PAGE.
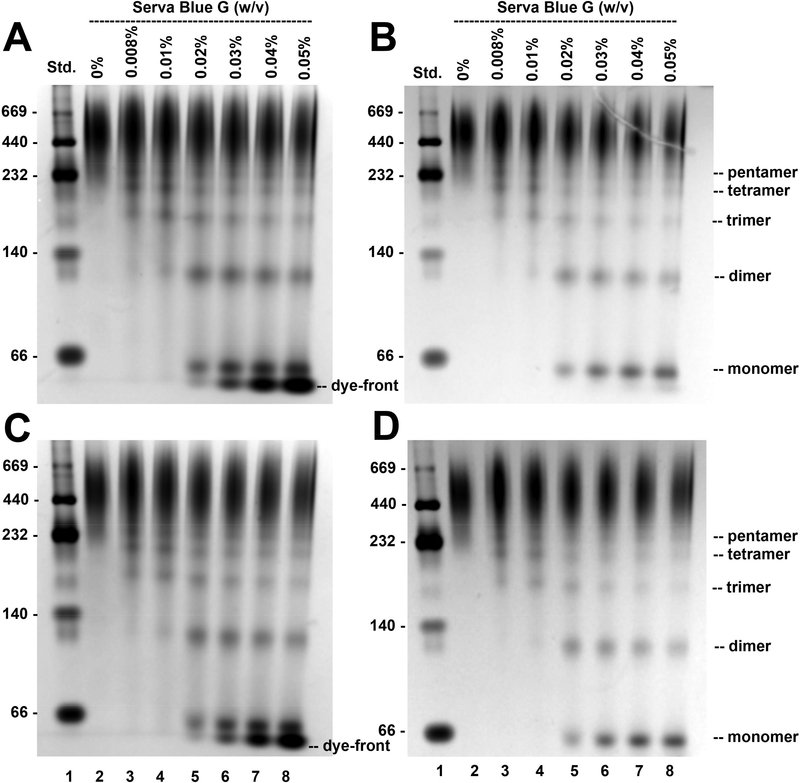
Non-denaturing pCN-PAGE gels of MBP-5-HT3A-ICD retrieved after SEC are shown in Fig. 4. When 6 μg (Fig. 4A and 4B) or 3 μg (Fig. 4C and 4D) of protein, incubated with native sample buffer alone (no Serva Blue G), was loaded (lane 2), a band was observed at approximately 260 kDa, in accordance with the apparent molecular weight estimated from the elution volume of the major peak observed on SEC. However, the incremental dye concentrations (0.008%, 0.01%, 0.02%, 0.03%, 0.04%, and 0.05%) applied in additional conditions separated on the same gel lead to disassembly of the MBP-5-HT3A-ICD pentamer into corresponding smaller complexes (lanes 3–8), eventually reducing it to a ladder of distinct oligomeric protein bands representing pentamer, tetramer, trimer, dimer, and a prominent band corresponding to the monomer (see lane 8). Purified soluble protein assemblies are vulnerable for disruption of their oligomeric state in the presence of high dye excess [12], which is consistent with our observed results. For the initial set of experiments, we used commercially available NuPAGE™ 4–12% Bis-Tris precast gels (Invitrogen). Although the results fulfilled the underlying principle of pCN-PAGE, we observed that approximately 60–70% of the loaded protein showed an anomalous electrophoretic mobility in the specific gel environment (Fig. 4A–4D; approximately top one-third of each lane). Interestingly, by switching to a different type of precast gel, a NativePAGE™ 3–12% Bis-Tris gel, available from the same manufacturer, we were able to remedy, to a great extent, the issue of anomalous protein PAGE migration behavior (Fig. 6A). As per manufacturer’s specifications, the latter gel is cast based on the technique originally developed elsewhere [13], and therefore in a buffer containing 6-AHA. A salt of low ionic strength like 6-AHA was included in the original method of Schägger and von Jagow to prevent aggregation of hydrophobic protein complexes during electrophoresis [13]. It is also commonly added in native sample buffer as a potent serine protease inhibitor [12]. 6-AHA, a non-detergent zwitterionic compound, in its free form does not migrate in the electrical field at pH 7.0. Therefore, the improved electrophoretic migration of MBP-5-HT3A-ICD (Fig. 6A) can be attributed to the inclusion of 6-AHA in the gel matrix as opposed to only in native sample buffer during initial experiments.
Fig. 4. Oligomeric state of MBP-5-HT3A-ICD analyzed by pCN-PAGE using a NuPAGE™ 4–12% Bis-Tris gel (Invitrogen).
6 μg (A, B) or 3 μg (C, D) of purified MBP-5-HT3A-ICD was resolved on a pCN-PAGE in the absence (lane 2) and presence of increasing concentrations of Serva Blue G as indicated in figure (lanes 3–8). Soluble proteins of the high molecular weight (HMW) kit were applied to lane 1. The gels were first stained with Biorad Bio-Safe™ Coomassie G-250, imaged (A, C), and then washed with a destaining solution (25% (v/v) methanol, 10% (v/v) acetic acid) followed by re-staining with Coomassie R-250 (B, D). Lane scan densitometry provided in Fig. 5. All gel images were captured in gray color using Gel Doc EZ Imager (Biorad).
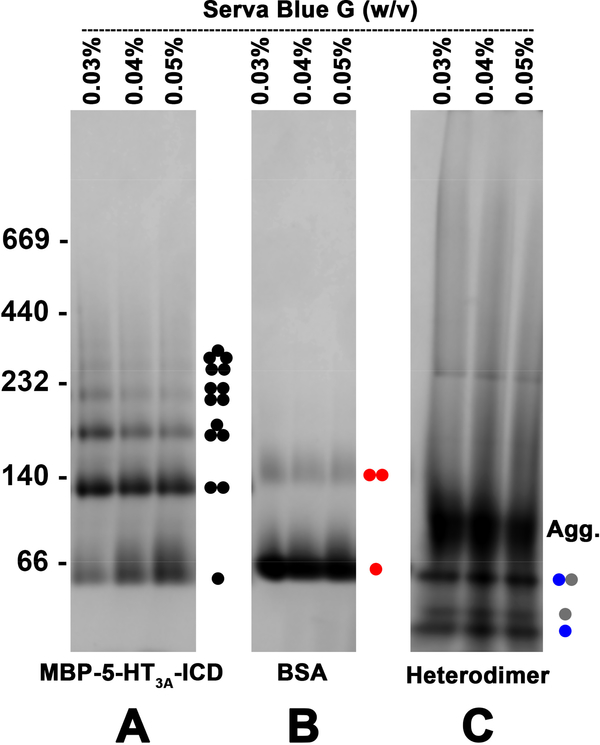
Fig. 6. Oligomers of purified MBP-5-HT3A-ICD, BSA and heterodimer characterized by pCN-PAGE using a NativePAGE™ 3–12% Bis-Tris gel (Invitrogen).
3 μg of each protein, mixed prior with 0.03% or 0.04% or 0.05% (w/v) of the dye, was resolved per lane of a native gel indicated above. The corresponding oligomeric state of the proteins is denoted by an appropriate number of circles [black closed circle (MBP-5-HT3A-ICD), red closed circle (BSA) and blue or gray closed circle (heterodimer)]. The gels were stained with Biorad Bio-Safe™ Coomassie G-250, and documented in gray color by Gel Doc EZ Imager.
We further validated the basic principle behind pCN-PAGE by investigating the oligomeric states of BSA and that of a heterodimer. BSA is shown to exist mainly as a mixture of monomers and oligomers with the monomer being the predominant species [14]. The results obtained by pCN-PAGE showed the predominant monomer band along with a small amount of dimers (Fig. 6B), similar to the reported finding. The heterodimer sample contains two proteins (22 kDa and 12 kDa) which co-elute after affinity chromatography (MacDonald and Grozdanov, unpublished observation). Consequently, these proteins are expected to coexist as a heterodimer of ~ 34 kDa in solution. When this heterodimer was resolved under the pCN-PAGE conditions, we indeed observed the bands corresponding to the heterodimer and to the two individual monomers (Fig. 6C). In addition, a poorly resolved band in the gel, likely consisting of higher-order oligomeric aggregates, was also noticed which warrants further optimization of gel electrophoresis conditions.
Determination of the oligomeric state by SEC-MALS.
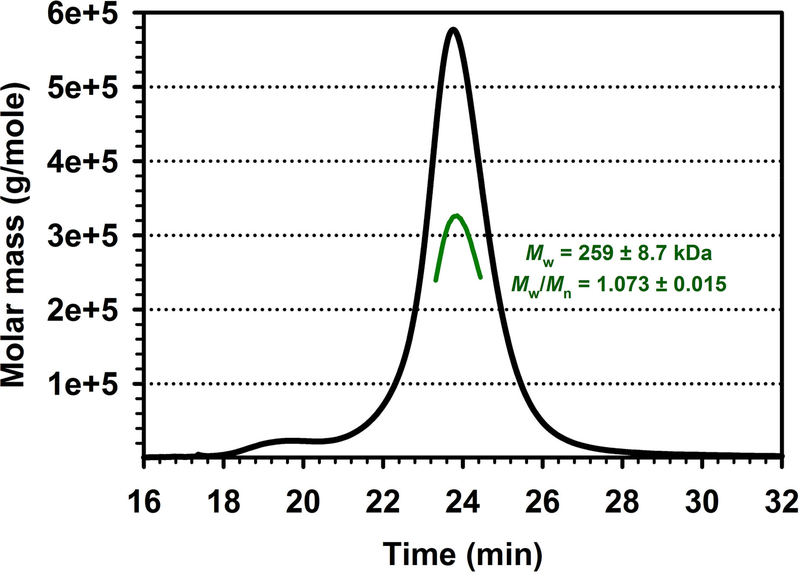
Shape of a protein species is one of the well-known confounding factors in estimating the oligomeric state of soluble proteins using hydrodynamic methods including SEC and native PAGE. Therefore, it is imperative to utilize a method, which can reliably determine the size of a protein of interest regardless of its shape. We performed SEC-MALS as described in the methods. The computational analysis of results from simultaneous measurements of light scattering, refractive index and UV absorbance at 280 nm yielded the weight-averaged molar mass of 259 ± 8.7 kDa (mean ± SEM, n = 3) (Fig. 7). In our hands, the values of the molecular weight of MBP-5-HT3A-ICD estimated by SEC or calculated by SEC-MALS both are comparable, and assert the pentameric assembly of the protein. Importantly, here we confirmed that the pentamer was monodisperse with Mw/Mn ratio (polydispersity) of 1.073 ± 0.015 (mean ± SEM, n = 3), where Mw is the weight-average molar mass and Mn is the number-average molar mass.
Fig. 7. Oligomeric state of MBP-5-HT3A-ICD determined by SEC in line with multi-angle light scattering (SEC-MALS).
SEC-MALS profile demonstrates the pentameric state of MBP-5-HT3A-ICD. The purified protein in the eluent was detected by UV and a Wyatt miniDAWN-TREOS MALS detector with a laser at 658 nm wavelength. SEC-MALS data plotted as a molar mass distribution (green line) superimposed on the Raleigh ratio (black line) as a function of elution time.
Discussion
Understanding the structure and function of the previously understudied ICD of pentameric ligand-gated ion channels (pLGICs) from the Cys-loop superfamily can provide specific insights into biochemical and biophysical processes orchestrated by this domain in the intricate intracellular milieu. Previously, we reported that a chimera of the ICD of 5-HT3A receptor (MBP-5-HT3A-ICD) can be recombinantly expressed and purified to homogeneity, and that it self-associates under the given conditions to form a pentameric assembly [7]. In the current study, we report on the application of sufficiently robust biochemical/ biophysical techniques to conclusively determine the oligomeric state of a soluble protein of interest, for example the MBP-5-HT3A-ICD.
Techniques such as SEC and native gel electrophoresis, which infer the apparent molecular weight of soluble proteins, and thus their oligomeric state, based on their hydrodynamic properties are routinely employed in research. Collectively, the underlying premise of both techniques is that the studied proteins will have similar shapes as compared to the standard proteins used for calibration. This is, however, not always the case. To address the inherent limitations, we describe the application of two methods for oligomeric state determination: a unique variant of the native gel electrophoresis and SEC in line with multi-angle light scattering (SEC-MALS).
We developed a novel modified clear-native PAGE technique that we named pseudo clear-native PAGE (pCN-PAGE) that can be broadly applied to investigate the oligomeric states of soluble protein complexes. The native conditions of CN-PAGE preserve protein assemblies during electrophoretic migration. Several factors including content and strength of gel matrix, buffer pH, and molecular mass and pI of the protein affect migration of the protein species [12, 15]. This in turn complicates assigning a molecular weight or oligomeric state to the electrophoresed complex. CN-PAGE by definition lacks use of Coomassie brilliant blue G-250 dye, unlike blue-native PAGE (BN-PAGE) where dye is added to the cathode buffer during separation. During BN-PAGE dye molecules with a net charge of −1 at a pH of 7 that are nonspecifically bound to electrophoresed proteins impart a negative charge to the protein [16]. The fact that dye excess during BN-PAGE may result into dissociation of the purified protein complexes [17] prompted us to carefully exploit this phenomenon to extend the use of the Coomassie-dye in CN-PAGE to dissect oligomerization of a purified soluble protein. To this end we added increasing amounts of dye to sample loading buffer in a stepwise fashion, with a range of dye concentrations, before the samples were electrophoresed under otherwise CN-PAGE conditions. The expectations were that 1) with no or small dye amounts, the complex would run as a single high molecular weight band corresponding to its mobility under CN-PAGE conditions, and 2) with increasing dye amounts, complexes would be increasingly destabilized such that they would run at distinct levels corresponding to lower molecular weight oligomers. Consequently, over a range of dye to protein ratios a ladder of bands would be revealed. Counting the steps of the ladder, formed by monomer, dimer, trimer, tetramer and pentamer species, respectively, in our case, provides the basis for clear and unambiguous determination of the number of monomers present in a given oligomer. Importantly, this eliminates the need for estimating the relative molecular mass of oligomeric proteins, based on the electrophoretic mobility under native conditions, to determine their oligomeric state. As a proof of principle, in the present study we precisely dissected the oligomeric state of the MBP-5-HT3A-ICD into a ladder of five distinct bands by pCN-PAGE. These results concur with our previously published finding [7] and further corroborate the pentameric assembly of the protein.
One of the obvious benefits of pCN-PAGE is that it provides an enhanced ability to test several different protein-to-dye ratios by loading the samples on individual lanes of a single multi-well gel during an electrophoresis run. This cannot be accomplished using BN-PAGE because a preset amount of the Coomassie dye is incorporated in the running cathode buffer. Moreover, owing in part to unique properties of each biological protein complex, in terms of their size, shape, amino acid content, intrinsic charge, pI, stability in solution, it is necessary to conduct a widespread screening of several parameters including the method of sample preparation, amount of protein and protein-to-dye ratio to obtain better results. Here, this screening can be performed expeditiously with pCN-PAGE. Coomassie dye binds to hydrophobic protein surfaces as well as basic amino acid residues therefore some soluble proteins lacking these elements may exhibit no or at best weak binding with the dye [18, 19], which in turn may limit the use of our technique.
In conjunction with pCN-PAGE, we additionally employed a wellestablished method, namely SEC-MALS which can compute directly the absolute molar mass of a protein without any assumption about the shape of that protein. The SEC-MALS analysis of the purified MBP-5-HT3A-ICD shows the homogenous pentameric protein complex of 259 kDa which subsequently can be disrupted under the controlled conditions of pCN-PAGE into successive lower-order oligomers and/or monomers (as shown here in Fig. 4).
Conclusion
In summary, we demonstrate the use of pCN-PAGE as an independent powerful, yet a simple, tool to evaluate the oligomeric state of a soluble protein complex. pCN-PAGE has the important advantages of not requiring any specialized equipment, and that the results produced are unambiguous with regard to the oligomeric state of the protein of interest. SEC-MALS features more convenience and speed in obtaining results when compared with sedimentation equilibrium centrifugation, an alternate technique used to determine the absolute molecular masses of protein species. In addition, the coupling of light scattering measurements downstream to SEC delivers quick and reliable information on the monodispersity/polydispersity of the proteins, which may be utilized to ascertain their quality. Therefore, it is conceivable to extend the combinatorial application of pCN-PAGE and SEC-MALS for characterizing the oligomeric state of ICDs of other prominent pLGICs as well as soluble purified proteins in general in the future.
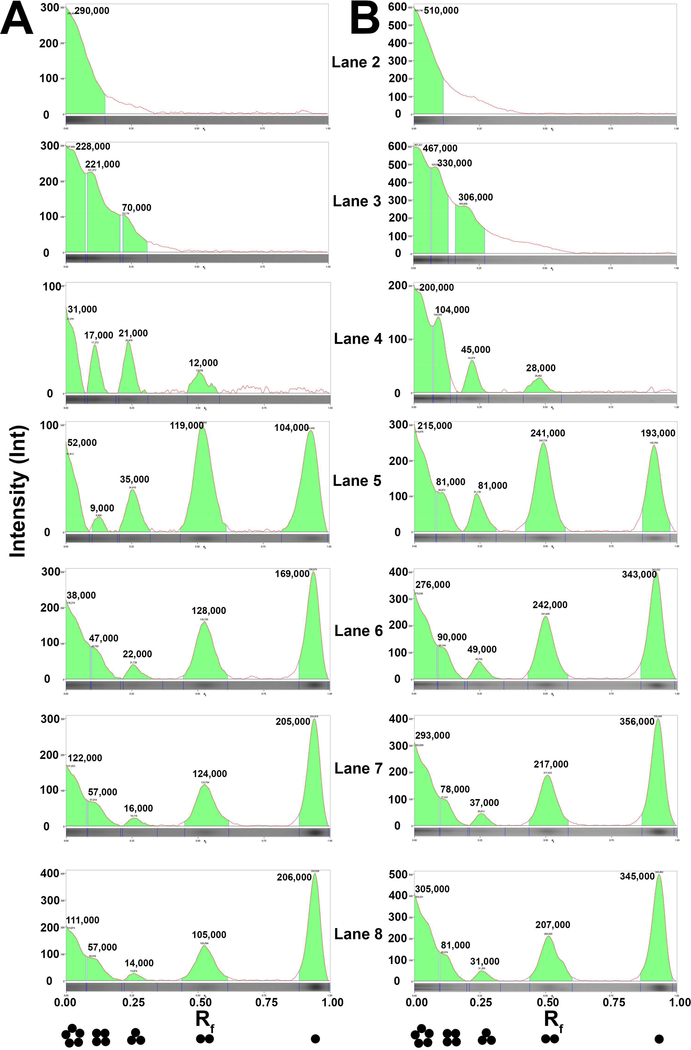
Fig. 5. Densitometric quantification of the pCN-PAGE gels.
Lane profile densitometry including Rf (retention factor; x-axis) determination was performed upon analyzing individual lanes (lane 2–8) of each gel shown in Fig. 4D (Panel A) and 4B (Panel B) using Image Lab Software version 5.1 build 8 (Biorad). Background subtraction was done as per the available tools. The Lane and Bands analysis tool was used to measure the intensities (y-axis) and volumes (the green shaded areas) of the protein bands corresponding to the indicated oligomeric states (black closed circles). Note that analysis excludes the top region of the gels which displays an anomalous gel mobility behavior of the electrophoresed protein sample.
Highlights.
A novel clear-native polyacrylamide gel electrophoresis method pseudo CN-PAGE was developed.
pCN-PAGE is suitable for assigning the oligomeric state of purified soluble protein species.
The key-advantage over blue-native PAGE is the ability to asses diverse dye to protein ratios with a single gel.
Acknowledgements
Research reported in this publication was supported by the National Institute of Neurological Disorders and Stroke of the National Institutes of Health under award number R01NS077114 (to MJ). The content is solely the responsibility of the authors and does not necessarily represent the official views of the National Institutes of Health. We thank the TTUHSC Core Facilities: some of the images and or data were generated in the Image Analysis Core Facility & Molecular Biology Core Facility supported by TTUHSC. We thank Drs. MacDonald and Grozdanov for providing the heterodimer.
Abbreviations
- 5-HT3A
serotonin type 3A
- 6-AHA
6-aminohexanoic acid
- BN-PAGE
blue-native polyacrylamide gel electrophoresis
- BSA
bovine serum albumin
- CN-PAGE
clear-native polyacrylamide gel electrophoresisS
- DNAse I
deoxyribonuclease I
- E. coli
Escherichia coli
- ICD
intracellular domain
- IPTG
Isopropyl β-D-1-thiogalactopyranoside
- MBP
maltose-binding protein
- MBP-5-HT3A-ICD
a chimera containing maltose-binding protein and the intracellular domain of serotonin type 3A receptors
- PMSF
phenylmethylsulfonyl fluoride
- pCN-PAGE
pseudo clear-native polyacrylamide gel electrophoresis
- pLGIC
pentameric ligand-gated ion channel
- SEC-MALS
size exclusion chromatography in line with multi-angle light scattering
- TCEP-HCl
Tris(2-carboxyethyl)phosphine hydrochloride
Footnotes
Ethical statement/Conflict of interest
All authors abide by the ethical responsibilities, and have no conflicts of interest.
Publisher's Disclaimer: This is a PDF file of an unedited manuscript that has been accepted for publication. As a service to our customers we are providing this early version of the manuscript. The manuscript will undergo copyediting, typesetting, and review of the resulting proof before it is published in its final citable form. Please note that during the production process errors may be discovered which could affect the content, and all legal disclaimers that apply to the journal pertain.
References
- [1].Dayhoff JE, Shoemaker BA, Bryant SH, Panchenko AR, Evolution of protein binding modes in homooligomers, Journal of molecular biology, 395 (2010) 860–870. [DOI] [PMC free article] [PubMed] [Google Scholar]
- [2].Jones S, Thornton JM, Protein-protein interactions: a review of protein dimer structures, Progress in biophysics and molecular biology, 63 (1995) 31–65. [DOI] [PubMed] [Google Scholar]
- [3].Nishtala SN, Mnatsakanyan N, Pandhare A, Leung C, Jansen M, Direct interaction of the resistance to inhibitors of cholinesterase type 3 protein with the serotonin receptor type 3A intracellular domain, Journal of neurochemistry, 137 (2016) 528–538. [DOI] [PMC free article] [PubMed] [Google Scholar]
- [4].Miller S, Lesk AM, Janin J, Chothia C, The accessible surface area and stability of oligomeric proteins, Nature, 328 (1987) 834. [DOI] [PubMed] [Google Scholar]
- [5].Bennett MJ, Schlunegger MP, Eisenberg D, 3D domain swapping: a mechanism for oligomer assembly, Protein Science, 4 (1995) 2455–2468. [DOI] [PMC free article] [PubMed] [Google Scholar]
- [6].Griffin MD, Gerrard JA, The relationship between oligomeric state and protein function, Protein Dimerization and Oligomerization in Biology, Springer; 2012, pp. 74–90. [DOI] [PubMed] [Google Scholar]
- [7].Pandhare A, Grozdanov PN, Jansen M, Pentameric quaternary structure of the intracellular domain of serotonin type 3A receptors, Sci Rep, 6 (2016) 23921. [DOI] [PMC free article] [PubMed] [Google Scholar]
- [8].Hockert JA, Yeh HJ, MacDonald CC, The hinge domain of the cleavage stimulation factor protein CstF-64 is essential for CstF-77 interaction, nuclear localization, and polyadenylation, J Biol Chem, 285 (2010) 695–704. [DOI] [PMC free article] [PubMed] [Google Scholar]
- [9].Moon AF, Mueller GA, Zhong X, Pedersen LC, A synergistic approach to protein crystallization: combination of a fixed‐arm carrier with surface entropy reduction, Protein Science, 19 (2010) 901–913. [DOI] [PMC free article] [PubMed] [Google Scholar]
- [10].Bell MR, Engleka MJ, Malik A, Strickler JE, To fuse or not to fuse: What is your purpose?, Protein Science, 22 (2013) 1466–1477. [DOI] [PMC free article] [PubMed] [Google Scholar]
- [11].ENGLAND N, pMAL™ Protein Fusion and Purification System, (1991).
- [12].Krause F, Seelert H, Detection and analysis of protein‐protein interactions of organellar and prokaryotic proteomes by blue native and colorless native gel electrophoresis, Current protocols in protein science, (2008) 19.18. 11–19.18. 36. [DOI] [PubMed] [Google Scholar]
- [13].Schagger H, von Jagow G, Blue native electrophoresis for isolation of membrane protein complexes in enzymatically active form, Anal Biochem, 199 (1991) 223–231. [DOI] [PubMed] [Google Scholar]
- [14].Wang S, Dong ZY, Yan YB, Formation of high-order oligomers by a hyperthemostable Fe-superoxide dismutase (tcSOD), PLoS One, 9 (2014) e109657. [DOI] [PMC free article] [PubMed] [Google Scholar]
- [15].Braz VA, Howard KJ, Separation of protein oligomers by blue native gel electrophoresis, Analytical biochemistry, 388 (2009) 170–172. [DOI] [PMC free article] [PubMed] [Google Scholar]
- [16].Braz VA, Howard KJ, Separation of protein oligomers by blue native gel electrophoresis, Anal Biochem, 388 (2009) 170–172. [DOI] [PMC free article] [PubMed] [Google Scholar]
- [17].Wittig I, Schägger H, Advantages and limitations of clear‐native PAGE, Proteomics, 5 (2005) 4338–4346. [DOI] [PubMed] [Google Scholar]
- [18].Wittig I, Beckhaus T, Wumaier Z, Karas M, Schagger H, Mass estimation of native proteins by blue native electrophoresis: principles and practical hints, Mol Cell Proteomics, 9 (2010) 2149–2161. [DOI] [PMC free article] [PubMed] [Google Scholar]
- [19].Tal M, Silberstein A, Nusser E, Why does Coomassie Brilliant Blue R interact differently with different proteins? A partial answer, J Biol Chem, 260 (1985) 9976–9980. [PubMed] [Google Scholar]


