

Abstract
The detection and analysis of rare blood biomarkers is necessary for early diagnosis of cancer and to facilitate the development of tailored therapies. However, current methods for the isolation of circulating tumour cells (CTCs) or nucleic acids present in a standard clinical sample of only 5–10 ml of blood provide inadequate yields for early cancer detection and comprehensive molecular profiling. Here, we report the development of a flexible magnetic wire that can retrieve rare biomarkers from the subject’s blood in vivo at a much higher yield. The wire is inserted and removed through a standard intravenous catheter and captures biomarkers that have been previously labelled with injected magnetic particles. In a proof-of-concept experiment in a live porcine model, we demonstrate the in vivo labelling and single-pass capture of viable model CTCs in less than 10 s. The wire achieves capture efficiencies that correspond to enrichments of 10–80 times the amount of CTCs in a 5-ml blood draw, and 500–5,000 times the enrichments achieved using the commercially available Gilupi CellCollector.
Liquid biopsies have long promised to enable what a solid-tumour biopsy could not—namely, early detection and minimally invasive sampling of a cancer and its metastases to guide personalized treatment. In particular, CTCs and circulating tumour DNA have shown great promise because they can provide key insights into tumour burden, prognosis and treatment response1,2. Yet, despite years of research, liquid biopsies have not achieved widespread clinical adoption because the scarcity of these circulating biomarkers precludes existing methods from isolating adequate numbers. While there may be hundreds or thousands of CTCs in the blood of a patient with cancer, a 5–10-ml blood sample (which represents just ~0.1% of the total blood volume) often contains only a handful of CTCs3. These numbers are inadequate to comprehensively profile a molecularly heterogeneous cancer and its metastases for drug-resistance mutations1,3–5. Furthermore, culturing CTCs to assess drug sensitivity for tailored therapy can require isolating tens to hundreds of cells4,5; therefore, culturing is not typically feasible until the advanced stages of disease, when interventions are less effective. Finally, very low CTC levels may lead to false negative results from a standard blood sample, especially in early cancer or recurrence6. Strategies for harvesting far more CTCs and other rare blood biomarkers are required to address these challenges so that their clinical utility can be realized.
Processing large blood volumes (hundreds of millilitres or even litres) could enable earlier detection of rare CTCs and provide far more CTCs for these analyses. However, there are practical limits to the amount of blood that can be drawn from a patient. Moreover, current technologies that have greatly optimized CTC capture and detection, including the US Food and Drug Administration (FDA)-approved CellSearch, the CTC-iChip and other microfluidic-based immunomagnetic separation technologies7–17, are designed to process relatively small sample volumes (a few millilitres). There are significant challenges to scaling in vitro technologies for the high-throughput isolation of CTCs. Extracorporeal circuits, such as in dialysis and apheresis, are capable of processing litres of blood18,19, but require interfacing the patient with a large, expensive machine, constrain mobility, risk complications and still necessitate considerable post-processing to isolate CTCs. Another technology, the Gilupi CellCollector, circumvents apheresis by introducing an antibody-coated rod into a blood vessel for passive immunocapture of CTCs in flow20. However, CTC capture with this device is modest, probably because there is no mechanism for attracting flowing cells to the rod. Radical solutions are needed that move beyond incremental improvements to existing liquid biopsy strategies.
Here, we present a technology for the in vivo immunomagnetic enrichment of rare biomarkers such as CTCs (Fig. 1). The MagWIRE (magnetic wire for intravascular retrieval and enrichment) is a self-contained magnetic wire that achieves high local-field gradients along its entire length to efficiently capture targets that have been labelled in the blood with injected antibody-coated magnetic particles (MPs), similar to the FDA-approved Feraheme21. The MagWIRE’s small diameter, flexibility and biocompatible plastic sheath enable it to be easily introduced into and retrieved from a superficial blood vessel to magnetically capture labelled biomarkers from the subject’s entire blood volume. The magnets can then be displaced from the MagWIRE sheath to elute the bound targets into buffer for downstream analyses. We evaluate the MagWIRE’s ability to enrich and retrieve model CTCs at physiologically relevant cell concentrations in both closed-loop and single-pass flow systems, as well as in vivo in a porcine model.
Fig. 1. Schematic of the MagWIRE concept.

(i) Antibody (Ab)-coated MPs are injected to immunomagnetically label rare analytes in the blood; in this case, CTCs. (ii) The flexible MagWIRE, composed of magnetic units with alternating polarity, is introduced through an intravenous catheter to collect and enrich MP-bound cells on the wire as the entire blood volume circulates past (approximately over 1 h). In principle, the patient could move freely after MP injection and MagWIRE placement, and return 1 h later for its removal. (iii) The MagWIRE is removed from the vein and the magnets are displaced from their biocompatible plastic sheath, leaving the captured cells on the sheath for elution, ex vivo cell culture and downstream molecular analysis. RBC, red blood cell. Ct, threshold cycle.
Sampling rare cells and nucleic acids from the entire blood volume can transform our ability to investigate a patient’s disease by providing ample biomarkers for analyses. Consider the total number of CTCs (N) that can be captured by the MagWIRE, as described by equation (1):
| (1) |
where C is the CTC concentration, V is the total blood volume processed and E is the percentage capture efficiency. At a CTC concentration of 1 cell ml−1, a 5-ml blood sample would yield at most 5 CTCs. By comparison, in 1 h, most of the patient’s blood volume (~5 litres) can circulate through a 2–3-mm diameter vein past the MagWIRE20. Then, even a capture efficiency of only 5% yields 250 CTCs (N = 1 × 5,000 × 0.05), a 50-fold improvement.
Results
MagWIRE design
A particle in a magnetic field experiences a magnetic force, as described in equation (2):
| (2) |
where m is the magnetic moment of the particle and ∇ B is the magnetic field gradient. The MagWIRE’s design allows a simple string of small, cylindrical neodymium magnets—here, 60 units totalling 6 cm in length—to produce a large magnetic field gradient and attractive force. Importantly, each unit is magnetized across its diameter, such that a lengthwise alignment results in alternating magnetic polarities (Supplementary Fig. 1). As a result, the surface magnetic flux density B (~1 T) (Supplementary Fig. 1) and field gradient ∇ B (Fig. 2a, left) remain relatively uniform along the entire length of the wire. Compared with a magnetic arrangement of non-alternating polarity, in which field gradients are localized only at the ends (Fig. 2a, right), the MagWIRE maximizes the volume that is subjected to a high gradient for efficient cell capture. The magnetic gradient approaches 10,000 T m−1 close to the surface of a 0.75 mm diameter MagWIRE, and remains > 100 T m−1 at the wall of a 2.4-mm diameter vessel (Fig. 2b). Such high gradients are typically achieved over only micrometre-scale distances by coupling magnetic sources with fine mesh-like structures22–24, which could be thrombogenic if implanted. Without such coupling, most magnetic separation devices achieve gradients < 100 T m−125,26.
Fig. 2. Numerical simulations of the magnetic properties of a MagWIRE segment.

a, Comparison of magnetic field gradient ∇ B between different magnetic orientations (black arrows point north). The alternating orientation (left) generates high gradients and magnetic forces (red arrows, scaled logarithmically) to attract MPs along the entire length, while the non-alternating orientation (right) only localizes gradient and force at the ends. b, The gradient decays radially outward from the MagWIRE surface. For a given radial distance, multiple points are sampled along the length of the magnet (dots), and the logarithmic fit is shown (lines). The alternating polarity configuration (red) outperforms the axial configuration (black) by orders of magnitude. c, The critical distance (Dc) is the radial distance from a MagWIRE (with a predefined length) at which 90% of MPs (open circles) or MP-labelled cells (filled circles) can be captured in blood flowing at a given velocity, assuming 100 MPs are bound to a cell see (Supplementary Note ‘MP-labeling estimate’). The simulated MagWIRE is 6 cm long and 0.75 mm in diameter, and the corresponding vessel size is shown on the right axis. As the blood flow velocity increases, the MagWIRE’s critical capture distance decreases. d, The critical length (Lc) is the length of a MagWIRE (with a predefined diameter) at which 90% of MP-labelled cells are captured in blood flowing at a given velocity. The simulated MagWIRE is 0.75 mm in diameter and the vessel is 2.4 mm in diameter. At a constant vessel size, as the blood flow velocity increases, the critical length of the MagWIRE increases. The red circles represent values relevant to the experimental data presented below.
A particle attracted to the MagWIRE by a magnetic force Fm experiences an opposing fluidic drag force described by equation (3):
| (3) |
where η is the viscosity of the medium, a is the particle diameter and v is the relative velocity at which the particle approaches the wire. To be captured, a particle must traverse the radial distance to the wire surface before the blood flow carries it past the wire’s length (Supplementary Video 1). For different blood flow velocities, we performed computational simulations in COMSOL to determine the critical dimensions at which 90% of MP-labelled cells are captured from flowing blood, conservatively estimating 100 MPs per cell (Supplementary Notes). Fixing the MagWIRE length at 6 cm, we determined the critical distance from the wire, which can be considered the optimal vessel size (Fig. 2c). For example, a 0.75-mm diameter MagWIRE has a critical distance of 0.8 mm at a physiologically relevant flow rate of 5 cm s−1. Thus, it can attract cells near the walls of a 2–3-mm diameter vein without occluding the lumen. To adjust for more rapid blood flows in the same vessel, the functional end of the MagWIRE can simply be lengthened (Fig. 2d).
Magnetic enrichment of viable CTCs in a closed-loop system
We first modelled intravascular magnetic enrichment in a closed-loop circulation set-up (Fig. 3a). Our tubing inner diameter of 2.38 mm and flow rate of 2 cm s−1 reflect physiologically relevant flows and shear stresses in superficial veins such as the cephalic vein of the arm27,28. To model CTC capture, we targeted H1650 non-small cell lung cancer (NSCLC) cells with 1-μm superparamagnetic iron oxide particles (Dynabeads) coated with antibodies against epithelial cell adhesion molecule (EpCAM). EpCAM is commonly expressed on the surface of CTCs of epithelial origin, such as H1650, but not on blood cells, facilitating selective and efficient enrichment29.
Fig. 3. CTC capture from buffer and blood in a continuous flow closed-loop system.

a, The MagWIRE was tested in a closed-loop circulation system consisting of a peristaltic pump, tubing and a reservoir. The MagWIRE is introduced into and removed from the system through a standard intravenous catheter. b, After retrieval, the MagWIRE is coated with MPs. The arrow points in the direction of fluid flow for all images. c, Macroscopic fluorescence imaging after a postlabelling experiment with 100,000 cells ml−1 shows that the entire wire is coated with cells. Cells were fluorescently prestained with CellTracker Orange. d, Microscopy shows that the distribution of fluorescently labelled cells (top) matches the isosurface of the computed magnetic energy density ( ) (bottom). e,f, Capture efficiencies for both prelabelled and postlabelled cells under continuous circulation conditions are shown for buffer (e) and blood (f) (mean of n = 2 independent experiments (circles) per concentration. g, Captured cells remain viable for cell culture and proliferate over a period of 5 days, as determined by a colorimetric proliferation assay normalized to the initial cell number. Cells labelled and captured by the MagWIRE grow more slowly initially compared with unlabelled cells and uncaptured labelled cells, but subsequently resume growth at a normal rate (mean ± s.e.m., n = 3 biologically independent samples).
After introducing the MagWIRE into a closed-loop circulation system of cells and anti-EpCAM MPs for 10 min, the MagWIRE was found to be coated along its entire length by MPs (Fig. 3b; Supplementary Video 2) and, as expected, fluorescently labelled cells demonstrated a similar distribution (Fig. 3c). MPs and cells are expected to deposit on surfaces of constant magnetic energy density , where μ0 is the vacuum permeability of free space30, and this pattern was confirmed by fluorescence microscopy (Fig. 3d; Supplementary Fig. 2). By comparison, cell coverage of the commercially available Gilupi CellCollector within the same closed-loop system was qualitatively sparse (Supplementary Fig. 3B).
To quantify the MagWIRE’s potential for CTC capture in ideal labelling conditions, we prelabelled cells with MPs and spiked them into circulating buffer before introducing the MagWIRE. After 10 min, we captured an average of 37 ± 18% (25–58%) of prelabelled cells spiked at concentrations of 10, 100 and 1,000 cells ml−1, confirming that cells can be magnetically enriched at physiologically relevant concentrations31 (Fig. 3e). When capturing non-EpCAM-expressing human fibroblasts or using a non-magnetic wire, only 0.6% and 0.1% of cells were captured at the highest cell concentration tested, respectively (Fig. 3e). Thus, nonspecific binding of cells to MPs or to the plastic sheath is minimal.
Since we introduced low cell concentrations, conventional haemocytometry was insufficiently sensitive for cell enumeration. Additionally, because genomic characterization of CTCs is critical to their clinical utility, we chose to calculate capture efficiencies by extracting genomic DNA and performing quantitative PCR (qPCR) with a standard curve of known cell numbers. We targeted the epidermal growth factor receptor (EGFR) exon 19 deletion (ΔE746-A750), which is commonly tested in NSCLC for drug sensitivity32. Our magnetic labelling does not interfere with the genomic analysis (Supplementary Fig. 4), allowing us to accurately quantify small numbers of captured cells, even from concentrations of 10 cells ml−1. Furthermore, we tested the effects of MP labelling and magnetic capture on transcriptomic profiles for a set of 770 cancer-related genes and found high concordance correlation coefficients (ρc > 0.98) when comparing overall expression profiles of both of these groups relative to unlabelled control cells. Moreover, only ~4% of genes in both groups showed significant changes at a false discovery rate of < 0.05, with 97% exhibiting a less than threefold difference in expression (Supplementary Fig. 5A–C). A single-cell analysis of putative CTC markers in NSCLC (vimentin (VIM), aldehyde dehydrogenase (ALDH) and MET) also revealed similarity in expression profiles for both VIM and MET, with a downregulation of ALDH expression potentially in response to cell stress (Supplementary Fig. 5C).
Encouraged by our capture of prelabelled cells, we proceeded to perform experiments that simulated in vivo CTC labelling, in which MPs are introduced into circulation to postlabel cells in flow for 10 min before MagWIRE placement. The MagWIRE captured 97% of introduced MPs (Supplementary Fig. 6), and 56 ± 25% (41–85%) of cells postlabelled in buffer across all cell concentrations (Fig. 3e). This result suggests that cell capture in continuous circulation is not limited by magnetic forces or by MP–EpCAM binding in flow. Magnetic enrichment was similarly effective when closed-loop experiments were performed in whole human blood, despite its 3–4 times greater viscosity33, with capture efficiencies of 49 ± 8% (34–55%) for prelabelled cells, and 37 ± 4% (33–40%) for postlabelled cells (Figs. 3f and 5). These cells remained viable after elution, proliferating in cell culture at a similar rate to unlabelled cells and labelled cells without MagWIRE exposure (Fig. 3g; Supplementary Notes).
Fig. 5. Capture efficiencies for two uses of the MagWIRE: continuous versus single-pass flow.
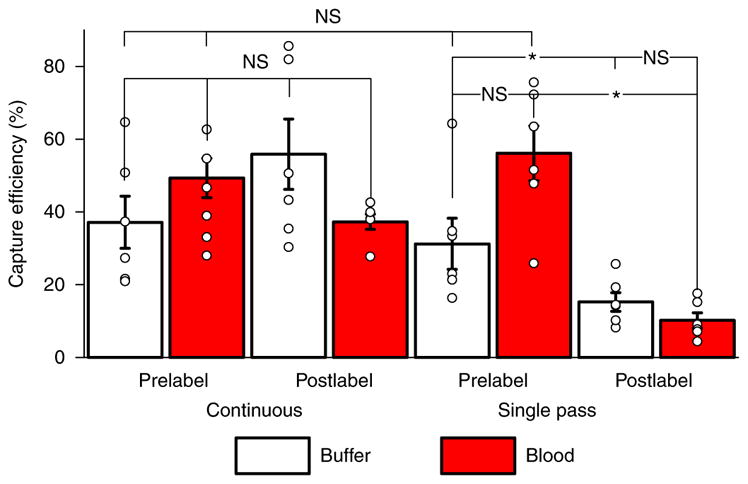
In continuous flow, there is no significant difference in capture efficiency with respect to whether the cells are prelabelled with MPs or labelled in flow (P = 0.20). Furthermore, the MagWIRE performs equally well in the more viscous environment of blood (prelabel: P = 0.34; postlabel: P = 0.20). MagWIRE capture rates do not change significantly when prelabelled cells are only allowed to pass by the MagWIRE once (buffer: P = 0.52, blood: P = 0.20). However, the shortened labelling time (~10 s versus 10 min) causes postlabelled capture efficiencies to drop in single-pass flow (buffer: P = 0.025; blood: P = 0.004). While higher average capture efficiencies are achieved with continuous flow, the single-pass case allows rapid capture of large biomarkers with short circulating half-lives, and minimizes systemic exposure to MPs. Data were averaged across experiments with cell concentrations of 10, 100, and 1,000 cells ml−1 (mean ± s.e.m., n = 6 independent experiments, see section ‘Statistics and reproducibility’). NS, P > 0.05, *P < 0.05, calculated by Mann–Whitney test. The 95% confidence intervals for each bar (from left to right) for continuous flow are as follows: 23.1–51.2%, 33.5–54.6%, 35.6–73.6% and 33.6–41.9%. The 95% confidence intervals for each bar (from left to right) for single-pass flow are as follows: 18.4–46.1%, 41.4–70.9%, 10.3–20.5% and 6.2–14.3%.
Capture efficiencies were not significantly different across labelling conditions or medium (Fig. 5), but the wide range of variances are likely due to variable EpCAM expression combined with the stochasticity of low cell numbers (50–5,000). We observed that EpCAM levels varied considerably across cells within a passage, and that cells in advanced passages acquired a more mesenchymal phenotype associated with a downregulation of EpCAM (Supplementary Notes; Supplementary Fig. 7), which could affect the extent of MP labelling. However, multiplexed targeting of other tumour-associated surface markers, such as E-cadherin, N-cadherin, HER2 and EGFR, can be harnessed to increase capture rates3,34,35.
Rapid cell labelling and localized magnetic capture
While the MagWIRE system can be adapted to many rare blood biomarkers, we pursued a unique labelling approach for in vivo CTC capture. In our original concept (Fig. 1), MPs are administered as a single bolus to bind biomarkers systemically before the MagWIRE is inserted. In our modified approach (Fig. 4a; Supplementary Video 3), we maintain a high MP concentration only in a local area immediately upstream of the MagWIRE to rapidly label and capture targets in a single pass. In practice, a patient would receive a steady infusion of MPs, delivered through a portable syringe pump to maintain mobility, over the course of ~1 h.
Fig. 4. CTC capture in single-pass flow in vitro and in vivo.

a, The MagWIRE was tested in a single-pass set-up, whereby MPs are steadily infused to create a local area of high MP concentration immediately upstream of the MagWIRE. Targets are rapidly labelled as they pass through, and labelled biomarkers and free MPs are immediately captured. b–e, The performance of rapid labelling and localized enrichment was evaluated in buffer (b) and blood (c), as well as in a porcine model (d,e). To implement the single-pass flow set-up, we placed three catheters in the auricular vein spaced 5 cm apart, such that the distal and middle catheters were used to simultaneously infuse exogenous CTCs and MPs, respectively, while the most proximal catheter provided intravenous access for the MagWIRE (d, top). Fluoroscopy demonstrates that the MagWIRE (red arrow) advances through a tortuous vessel (d, bottom) (Supplementary Video 4). Capture efficiencies in the porcine model (e) are shown for infusions of 10,000 prelabelled cells, for 2,500–10,000 postlabelled cells and for a non-magnetic wire (n = 2, 6 and 2 independent experiments, respectively; lines represent mean).
We pursued this single-pass method for the specific case of in vivo CTC capture because CTCs have a short half-life, on the order of minutes to a few hours, due to capillary filtration and apoptosis31,36. While a systemic, continuous circulation method would inefficiently utilize MPs by labelling all CTCs, many of which are cleared before the MagWIRE is introduced, this localized strategy only labels CTCs that will immediately pass by the MagWIRE. Additionally, while systemic labelling would require using smaller (< 100 nm) MPs for longer circulation times37, the single-pass method allows us to use larger (1 μm) MPs, which attain greater magnetic moments, for more efficient CTC capture31,36 (Table 1).
Table 1.
Comparison of continuous versus single-pass MagWIRE enrichment
| Continuous flow | Single-pass | |
|---|---|---|
| Biomarkers | Longer half-life: circulating tumour DNA48, exosomes, protein | Shorter half-life: CTCs |
| MPs | Longer circulation half-life: small PEGylated nanoparticles | No requirement; larger (micrometre-sized) MPs can be used |
| Advantages | Longer labelling time and improved yield. Single bolus injection of the MPs | Decreased systemic exposure to the MPs |
The MagWIRE system can be adapted to enrich different biomarkers, and the choice of labelling method should be guided by the properties of the desired biomarker and MP.
To evaluate this method, we modified the closed-loop system to have separate inlet and outlet reservoirs (Supplementary Fig. 8). Experiments revealed that the majority of capture occurs on the first pass by the MagWIRE. Prelabelled cells that passed by the MagWIRE only once were captured with an average efficiency of 31 ± 13% (22–46%) in buffer (Fig. 4b) and 56 ± 16% (39–70%) in blood (Fig. 4c) compared with 37 ± 18% and 49 ± 8% capture, respectively, in continuous flow, wherein cells passed by approximately ten times (Fig. 5). Again, maximum capture efficiency is probably limited by EpCAM expression, such that highly expressing cells are densely labelled and immediately captured while cells with low EpCAM expression are never captured, as confirmed by microscopy inspection (Supplementary Fig. 7). We recovered more than 96% of MPs on the first pass (Supplementary Fig. 6), which would limit systemic exposure and any potential toxicity in vivo.
After observing that the single-pass method did not significantly diminish capture efficiency, we investigated its effect on labelling. Cells were postlabelled in flow by infusing MPs 15 cm upstream of the functional end of the MagWIRE, a sufficient distance to position both catheters within a patient’s forearm. An average of 15 ± 6% (9–20%) of cells in buffer and 10 ± 5% (6–16%) of cells in blood were both labelled and captured by the MagWIRE on a single-pass, approximately one-quarter of the yield from postlabelling in continuous flow (Figs. 4b,c and 5). The observation that a quantifiable fraction of cells were labelled by MPs rapidly enough (< 10 s) to be captured by the MagWIRE is intriguing. We theorize that the fast binding kinetics are due to the very high local concentration of MPs in the infusion zone, which ensures that passing cells are surrounded by MPs at very short diffusion distances. Furthermore, fast magnetic transport of MPs in the radial direction as they flow over the MagWIRE can drive many more MP–CTC collisions than would occur by diffusion alone (Supplementary Notes). Although, as expected, capture of postlabelled cells is decreased compared with prelabelled cells due to their short residence time in the MP-rich environment, this localized method utilizes MPs more efficiently than a systemic approach. When CTC capture is integrated over time and volume, even relatively low capture efficiencies can achieve a manyfold increase in CTC yield (equation (1)).
We then quantitatively compared the MagWIRE’s performance with the Gilupi CellCollector in our closed-loop system under identical flow conditions: the CellCollector was inserted in place of the MagWIRE and blood containing 5 × 10⁵ fluorescently labelled cells (and no MPs) was circulated for 30 min. Only ~7–9 cells were counted on the functionalized tip of the CellCollector, a capture efficiency of 0.0016 ± 0.0003% (Supplementary Fig. 3A). Thus, the MagWIRE achieves a ~6,000-fold improvement in capture efficiency over the CellCollector in blood within our closed-loop system.
CTC capture in an in vivo porcine model
We next demonstrated in vivo cell capture with the single-pass method in a live Yorkshire pig. The Yorkshire auricular vein is similar in accessibility and size to human cephalic veins, making it an ideal choice for an in vivo proof-of-principle experiment. Given the challenges of generating a porcine tumour model by mutagenesis to probe endogenous CTCs31, we locally injected exogenous cancer cells to mimic steady-state CTC concentrations. We infused 2 mg of MPs and between 2,500 and 10,000 cells over the course of 1 min through two separate catheters in the auricular vein upstream of the MagWIRE (Fig. 4d). Estimating a blood flow of 20 ml min−1 in the auricular vein (Supplementary Notes), an infusion of 2,500 cells over 1 min corresponds to a local concentration of ~100 cells ml−138. Even after removal from a tortuous vessel, the MagWIRE was visibly coated with MPs (Fig. 4d). We captured cells with efficiencies ranging from 1 to 8% for 2,500–10,000 cells (Fig. 4e), which corresponds to a 10–80-fold enrichment compared with a 5-ml blood draw (equation (1)). A non-magnetic wire did not capture any cells, again confirming capture specificity. These in vivo capture efficiencies represent a ~500–5,000 fold improvement over the Gilupi CellCollector’s efficiency (0.0016 ± 0.0003%).
While these results translate to dramatic increases in CTC enrichment, they may still underestimate the capture efficiencies attainable in humans. For instance, the porcine ear is a highly vascularized structure with numerous collateral vessels (Supplementary Videos 4 and 5), meaning that not all beads and cells injected in the selected vein necessarily pass by the MagWIRE. While 96% of MPs were captured in vitro, only ~34% on average were captured in vivo despite a similar flow velocity and vessel size, suggesting that actual capture efficiencies are effectively threefold higher. In addition, the iodinated contrast agent used to visualize the MagWIRE by fluoroscopy before each trial is viscous and sticky, and accumulation within the vein after several trials could have caused cells and MPs to adhere to the vessel wall. Moreover, our set-up requires an additional catheter for exogenous CTC delivery—not needed in the case of endogenous CTC capture—which may contribute to vein irritation and clamping that could promote collateral escape of injected cells. While our trials exhibited substantial variability, this is at least in part due to short enrichment times (1 min). In humans, enrichment would probably take place over the course of 1 h to sample the entire blood volume, with the prolonged integration time reducing capture variability. An added limitation of the porcine ear model is that the auricular vein is relatively short, providing little time for MP labelling of cells, which is critical for high efficiency capture by the MagWIRE. By contrast, the major superficial veins of the human arm are much longer, potentially facilitating improved cell labelling and better capture efficiencies.
MP safety in vivo
While pigs in this study exhibited no untoward reactions to the MPs, these MPs differ in size and surface modification from existing FDA-approved MPs, such that their safety, toxicity and pharmacokinetic profiles must be independently investigated for FDA approval and application to human health. In this vein, we conducted a pilot toxicity study in mice using intravenously injected MPs at 15-fold the dose (25 mg kg−1) proposed herein, and examined the mice for changes in appearance, behaviour, vital signs, tissue histology, complete blood counts and serum chemistries at 1 day, 1 week and 1 month post-injection (Supplementary Fig. 10; Supplementary Methods). We also studied the kinetics of MP clearance from the blood (Supplementary Fig. 11; Supplementary Methods) and their biodistribution. Other than a transient decrease in neutrophil count at 24 h, which rebounded by 1 week, all other parameters were within normal reference ranges or showed relatively minor changes compared with saline-injected controls (Supplementary Tables 2, 3). Histology on a wide range of organs and tissues showed no architectural, inflammatory or immune changes, although particles consistent with MPs could be visualized on histological sections of liver, spleen and lung (Supplementary Figs. 12 and 13; Supplementary Methods). Importantly, the mice did not exhibit physical or biochemical signs of iron overload. The blood half-life of the MPs was ~2.8 min, such that ~97% would be cleared from the blood within 15 min (Supplementary Fig. 14; Supplementary Methods). Biodistribution studies showed that MPs were taken up predominantly by the liver and spleen and, to a lesser extent, the lung (Supplementary Fig. 15; Supplementary Methods), consistent with past studies of iron oxide and other metal nanoparticles39–42. No significant clearance of MPs was seen from these organs over a 1-month period, although iron oxide nanoparticles are known to be eventually metabolized by the liver and the iron incorporated into haemoglobin.
Discussion
We developed a flexible magnetic wire for the large-scale in vivo enrichment and retrieval of CTCs. The MagWIRE system, designed to dramatically increase CTC harvest by sampling the entire blood volume of several litres, contrasts with existing in vitro CTC isolation technologies that have a capture efficiency of 90–95% but can only sample a few millilitres of blood14,43,44. As a result, even an 8% cell capture rate, the maximum achieved in this study in vivo, provides the equivalent of 80 tubes of blood (equation (1)) and a 5,000-fold improvement over in vivo techniques that utilize passive immunocapture. This level of enrichment could enable earlier detection of tumour recurrence, thus permitting earlier intervention, and provide a large CTC sample to comprehensively analyse tumours for drug-resistance mutations and for culture and drug-susceptibility testing, thus permitting earlier substitution of ineffective therapies with effective ones. The magnetic strength of MagWIRE capture does not result in dramatic transcriptomic alterations, with correlation coefficients between captured and unperturbed cells similar to those of established cell capture methods (> 0.98)44.
In addition, we demonstrated rapid (< 10 s) in vivo MP labelling and capture of cells on a single pass. In so doing, we circumvented hurdles posed by the relatively short circulation half-life of MPs with diameters large enough for practical magnetic capture (> 100 nm). Instant capture of a large fraction of MPs offers the added advantage of minimizing systemic exposure. However, even the entire MP dose of 120 mg proposed herein is well below the standard 510 mg intravenous dose of Feraheme (Supplementary Notes), the iron oxide nanoparticle drug used clinically to treat anaemia. Pilot toxicity studies of these larger MPs in mice did not show gross evidence of acute or chronic toxicity over 1 month, either physiologically or biochemically, apart from a transient neutropaenia. A more extended study is ongoing to follow mice at 6 months and 1 year post-injection. In addition, work is ongoing in our laboratory to develop MPs consisting of nanoparticle clusters that can disaggregate over time, allowing for faster breakdown and clearance. The MagWIRE itself will also require additional biocompatibility testing for regulatory approval; however, it is completely ensheathed in polytetrafluoroethylene (PTFE), which is regularly used in medical implants. Further improvements to the device will include coating the MagWIRE with heparin to obviate the use of systemic anticoagulants during the procedure. Moreover, we are currently assessing the feasibility, both computationally (Supplementary Fig. 16; Supplementary Notes) and experimentally, of capturing smaller MPs (~100 nm) and testing polyethylene glycol coatings of various densities to improve MP circulation time in the continuous circulation approach.
Existing magnetic-based technologies for in vivo applications primarily focus on targeting exogenous agents for therapy or imaging, whereas our technology is designed to enrich and retrieve endogenous biomarkers for ex vivo analysis. Moreover, existing technologies cannot easily be repurposed for our application. For example, targeting strategies that rely solely on an external magnetic field source produce weak gradients, which efficiently attract MPs in slow capillary flows45 but not in larger blood vessels in which velocities are 1–2 orders of magnitude faster, a prerequisite for high-throughput enrichment. Coupling an external source with a magnetizable stent can generate high gradients, but these gradients are localized too close to the stent walls to attract MPs in the vessel centre, especially in fast flow, and stents are difficult to retrieve23,24.
Our device has several advantages in this regard. First, the MagWIRE is completely self-contained and does not require a bulky external magnetic field source. Second, critical to high capture efficiency, the unique configuration of alternating-polarity magnetic units maintains strong magnetic field gradients along the entire wire and at a radial distance of ~1 mm, thereby attracting MPs and cells throughout the entire vein diameter—not possible with the Gilupi CellCollector—at a range of physiological velocities (1–10 cm s−1). As a result, the MagWIRE achieves over three log-orders improvement in capture efficiency compared with the CellCollector. This is not surprising given that in a passive capture system, CTCs must come close to antibodies on the wire in order to bind, whereas in the MagWIRE, CTCs are magnetically drawn to the wire. Third, its flexibility and dimensions resemble those of an interventional guidewire commonly used in medical procedures, facilitating insertion and retrieval from the body through a standard intravenous catheter or existing chemotherapy port without occluding or traumatizing the vessel. Finally, the MagWIRE can be elongated as needed to improve capture in vessels with faster flows.
Considering the molecular heterogeneity of CTCs and the diversity of potential surface marker targets other than EpCAM, using an expanded antibody cocktail repertoire could facilitate the capture of a larger variety of circulating cancer-associated cells, as well as enable a patient-tailored approach for recurrence monitoring. Moreover, our technology is not limited to CTC enrichment; it can be generalized for enriching other rare cells and biomarkers. For example, MPs functionalized with antibodies or nucleic acid sequences can target circulating tumour DNA, microRNA, protein biomarkers or exosomes, and combinations of MPs could even allow multiplexed biomarker enrichment. Some of these smaller targets have a longer half-life than CTCs and can potentially be enriched with higher efficiency in the continuous circulation approach, while the single-pass approach can be used to gather additional proteomic and drug susceptibility information from short-lived CTCs and circulating tumour microemboli. Capture of circulating cell-free DNA from large blood volumes using the MagWIRE could provide far more genomic equivalents of DNA for blood-based detection of low allele-frequency mutations, enabling earlier cancer detection.
We recognize that a diagnostic test that uses wire insertion and a bolus of MPs is more invasive than a routine blood test, a fact that could potentially impede eventual clinical implementation. Additional preclinical and clinical studies will therefore be needed to determine whether the benefits of capturing more CTCs justify the risks and expense of a more invasive test. This in turn will depend on whether the additional information provided by a larger CTC sample can better inform treatment and thereby improve progression-free survival and overall survival. An ideal initial test population would be patients with a cancer that is in remission but is at high risk of recurrence. Also, considering the MagWIRE’s high MP and CTC capture rates in our in vitro system, a relatively less invasive approach could be to incorporate the MagWIRE system within an extracorporeal circuit. The MagWIRE’s length could be increased as needed to ensure that all MPs are captured within the extracorporeal circuit and none enter the systemic circulation as blood re-enters the body. The advantage of this method over diagnostic leukapheresis, an existing extracorporeal technique, is that cell selection and collection could be performed in a single step within the extracorporeal circuit rather than being processed separately. Apart from clinical applications, the MagWIRE could also have applications in preclinical cancer models (for example, of pancreatic and lung cancers in genetically engineered KrasG12D and Trp53 mutants), in which serial sampling can be performed to better understand the dynamics of CTC generation and survival.
Finally, most biomarker capture strategies face biological constraints regarding efficiency—for example, the potential cloaking of CTCs by platelets and clotting factors in circulation—and we emphasize that while our strategy can advance the current state of the art in cell and biomarker isolation in vivo, these biological limitations must be adequately addressed to realize the full clinical potential of the technology and of circulating biomarkers in general. Future studies will test the MagWIRE in a large-animal induced tumour model, pursue in vivo capture of rare circulating tumour DNA, and explore alternate magnetic geometries for more efficient and higher throughput biomarker capture.
Methods
Study design
The objective of this study was to design and implement a magnetic device capable of high-throughput in vivo enrichment of rare tumour biomarkers, in this case CTCs, from the entire blood volume in a simple and minimally invasive fashion. We conducted controlled laboratory experiments to assess the MagWIRE’s capture efficiency for cancer cells labelled with MPs in flow within closed-loop and single-pass flow systems under physiological conditions, and then tested the MagWIRE concept in vivo in a porcine auricular vein. Quantification was performed by qPCR on genomic DNA from captured cells and comparison with standards of known cell amounts. Each experimental condition was tested using three different cell concentrations run in duplicate. These data were then aggregated (n = 6 per experimental condition) in assessing the statistical significance of differences between experimental conditions.
MagWIRE construction
Cylindrical N50-grade neodymium iron boron (NdFeB) magnets measuring 0.75 mm in diameter by 1 mm in length, magnetized across the diameter (Supermagnetman) were inserted into PTFE tubing with an inner diameter of 0.81 mm and wall thickness of 38.1 μm (Zeus). Stainless steel guidewires of similar diameter (Cook Medical) were inserted into PTFE tubing for use as non-magnetic control wires.
MagWIRE simulation
Numerical simulations of magnetic fields and particle capture were performed using a finite element-based simulation package (COMSOL Multiphysics 5.2, COMSOL). Calculations were performed assuming a remnant field strength Br = 1.4 T for NdFeB magnets, MP mass susceptibility of 81 × 10−5 m3 kg−1, and maximum volumetric relative permeability of particles approximately equal to 2.38. The magnetic properties of Dynabeads have been characterized previously46. A more detailed description of the computational modelling and relevant parameters are provided in the Supplemental Notes.
MP immunolabelling
One millilitre of 10 mg ml−1 Dynabeads MyOne Streptavidin T1 superparamagnetic beads (ThermoFisher Scientific) was washed 3 times with 1× PBS, pH 7.4 (ThermoFisher Scientific) using a magnetic separation rack (System Biosciences). PBS was removed and 400 μl of (0.5 mg ml−1) biotinylated anti-human CD326 (anti-EpCAM) antibody Clone 9C4 (Biolegend) was added to the beads and mixed thoroughly. The reaction was incubated for 30 min at room temperature on a rotator. The antibody-coated beads were washed with 0.1% bovine serum albumin (BSA)/PBS solution (EMD Millipore) 5 times, resuspended in 1 ml of 0.1% BSA/PBS and then stored at 4 °C.
Cell culture
Human H1650 NSCLC cells (ATCC) were cultured in T-75 flasks in the presence of RPMI medium supplemented with 10% fetal bovine serum (FBS), 5 mM sodium pyruvate, and penicillin–streptomycin. Human PCS-201 fibroblasts cells (ATCC) were cultured in DMEM medium supplemented with 10% FBS and penicillin–streptomycin. Cells were trypsinized when they reached 80% confluence by incubating with TrypLE Express Enzyme (ThermoFisher Scientific) for 10 min at 37 °C. Cells were diluted fivefold with media and centrifuged at 125 × g for 10 min. The cell pellet was resuspended in medium and viable cells were quantified by mixing 20 μl of cells 1:1 with Trypan Blue solution (ThermoFisher Scientific) and counting using a Nexcelcom Cellometer Auto T4. Cell lines were verified free of mycoplasma contamination (MycoAlert Mycoplasma Detection Kit).
In vitro experiments
A peristaltic pump (Cole-Parmer) and C-Flex tubing (Cole-Parmer) with an inner diameter of 2.38 mm were used for the closed-loop circulation studies. The inlet tubing was 30 cm in length and the outlet tubing was 15 cm in length. A 16-gauge catheter (Safelet Cath, Nipro Medical) was introduced into the inlet tubing 10 cm from the pump for insertion of the MagWIRE and capped with a plug. The tubing was blocked by circulating 1% BSA/PBS for 15 min to minimize nonspecific adhesion to the tubing wall. Experiments were conducted by spiking a known amount of cells into a 15 ml Falcon tube reservoir containing 5 ml of buffer or whole human blood at 37 °C, and circulating at a speed of 2 cm s−1 (5.2 ml min−1). Larger volumes were used in experiments with low cell concentrations to facilitate detection by qPCR. Cell stocks and standards were prepared by serial dilution with RPMI medium. Human blood was stored for < 24 h at 4 °C in ethylenediaminetetraacetic acid (EDTA)-capped tubes.
In the continuous flow experiments, beads and cells were allowed to circulate past the MagWIRE for 10 min or ~10 cycles. Prelabelled cells were obtained by incubating H1650 cells at a concentration of 100,000 cells ml−1 with anti-EpCAM Dynabeads at a concentration of 1 mg ml−1 for 30 min on a rotator. Postlabelled experiments were conducted by first introducing unlabelled cells through the closed-loop system and afterwards spiking in 1 mg of anti-EpCAM Dynabeads. The beads and cells were allowed to circulate together for 10 min before introducing the MagWIRE. In the Gilupi CellCollector experiments, the CellCollector was carefully inserted through the catheter in place of the MagWIRE, and blood or buffer containing fluorescently labelled (CellTracker Orange) cells at a concentration of 100,000 cells ml−1 was circulated for 30 min (this was the recommended cell concentration and incubation time in the company’s protocol). The CellCollector was then removed and gently immersed in PBS before being visualized under a microscope for counting of bound cells.
In the single-pass flow experiments, the inlet and outlet reservoirs were separated such that beads and cells were only allowed to pass by the MagWIRE once. Prelabelled cells were generated in the same manner as described above. Postlabelled experiments were conducted by infusing 100 μl of 10 mg ml−1 anti-EpCAM Dynabeads (1 mg total) into the closed-loop system as cells flowed by. A syringe pump (Pump Systems) was used to set the bead infusion rate to 85 μl min−1, and the beads were infused 15 cm upstream of the beginning of the functional end of the MagWIRE.
After the experiments, the MagWIRE was removed from the catheter, and the magnets were pushed out of the end of the tubing using a thin stainless steel rod. The tubing was either placed into a 1.5 ml Eppendorf tube for DNA extraction or a 15 ml Falcon tube for elution for cell culture. All experiments were performed in duplicate.
Genomic DNA extraction
Genomic DNA was extracted from captured cells using a Purelink Genomic DNA Mini Kit (ThermoFisher Scientific). Briefly, PBS (200 μl), proteinase K (20 μl) and RNase A (20 μl) were added to the tube containing the MagWIRE sheath. The tube was briefly vortexed before and after addition of Genomic Lysis/Binding Buffer to elute all of the cells off the tubing. After adding 100% ethanol, the tubes were placed onto a magnetic separation rack to separate free beads from the solution containing the genomic DNA. The solution was added to the genomic DNA isolation columns and processed according to the manufacturer’s protocol. Genomic DNA was eluted with 25 or 50 μl of elution buffer. For each batch of cells used, genomic DNA was extracted from standards of known cell amounts for quantification of capture efficiency by qPCR with the same probe.
qPCR
qPCR reactions (20 μl) contained 1× SsoAdvanced Universal Probes Supermix (Bio-Rad), probe (1 μl), genomic DNA (5–8 μl) and diethylpyrocarbonate (DEPC)-treated water (Invitrogen). H1650 DNA was targeted with an Δ E746-A750 mutation detection probe with FAM fluorophore (Bio-Rad), and PCS-201 DNA was targeted with a GAPDH-specific probe with FAM fluorophore (Bio-Rad). Assays were performed using a CFX96 Real-Time System C1000 Touch Thermal Cycler (Bio-Rad) using the following protocol: 95 °C for 3 min; followed by 60 cycles of 95 °C for 15 s and 59 °C for 30 s. Technical replicates for all samples were performed in duplicate or triplicate. Negative controls were performed with Elution Buffer instead of genomic DNA. The cycle threshold was a single threshold determined automatically by the software, and the baseline was curve fit subtracted. All Ct (threshold cycle) values fell within the linear quantifiable range of the assay.
Cell viability
H1650 cells isolated from postlabelled continuous flow experiments in whole blood were eluted in 10 ml of RPMI medium and concentrated to a volume of 500 μl. The cell concentration was quantified by haemocytometry. Unlabelled ‘parent’ cells from the same initial stock and captured cells were both plated in triplicate for each of three time points at densities of 10,000 cells per well. Cells were allowed to grow in RPMI medium for 24 h, at which point the wells were washed with PBS. For each time point (24, 72 and 120 h), medium was removed from the appropriate wells and replaced with 100 μl of medium and 10 μl of WST-1 reagent (Roche). The plate was incubated at 37 °C for 30 min before spectrophotometric reading at 440 nm (Synergy 4, BioTek).
Fluorescence microscopy
H1650 were labelled with CellTracker Orange CMRA (Thermofisher Scientific; excitation/emission 548/576 nm) by incubating cells in medium with a 1:1,000 dilution of the dye for 30 min at 37 °C. The fluorescently labelled cells were used in a continuous flow, postlabelled experiment in buffer at a concentration of 100,000 cells ml−1. After retrieval, the entire MagWIRE was placed in a 10-cm dish of medium and imaged on an EVOS imaging system (ThermoFisher Scientific) with an RFP filter. The MagWIRE was then imaged in an IVIS imaging system (Xenogen) with a DsRed filter at 10 s exposure.
Porcine auricular vein model
All animal work in mice and pigs was conducted in accordance with NIH guidelines and approved by the Administrative Panel on Laboratory Animal Care at Stanford University, under Protocol #31063. One male and one female juvenile Yorkshire swine weighing 115–140 kg were obtained from Pork Power Farms. We chose animals with an auricular vein that was large enough to accommodate an 18-gauge catheter. Swine were fasted overnight before surgery and sedated with intramuscular injections of tiletamine and zolazepam (Telazol, Lederele Parenteral) at 6 mg kg−1. General anaesthesia was induced with isofluorane (2–3%). After endotracheal intubation, the pigs were maintained on 2–3% isoflurane in oxygen with mechanical ventilation (Omnivent, Allied Health Care Partners). Animals were positioned in lateral recumbency and skin preparation of the ear was performed with 70% isopropyl alcohol. The auricular vein was catheterized proximally with one 18-gauge catheter and distally with two 22-gauge catheters (Safelet Cath, Nipro Medical). The catheters were flushed with 1 ml of 10 U ml−1 heparin sodium injection, 1,000 USP units per ml saline (SAGENT Pharmaceuticals) and 1 ml of 30 mg ml−1 papaverine (American Regent) before each injection. Venous and arterial catheters were placed percutaneously for drug and fluid administration and blood pressure monitoring. For cardiovascular support, Lactated Ringer’s solution (Abbott Laboratories) was administered intravenously at approximately 10 ml per kg per h throughout anaesthesia. Clamps were applied on either side of the auricular vein to reduce collateral flows. H1650 cells (1 ml) at concentrations ranging from 2,500 to 10,000 cells ml−1 and 1 ml of 2 mg ml−1 Dynabeads were manually injected through 22-gauge catheters over the course of 1 min. Heparin saline (1 ml) was flushed through the same catheters over 1 min, and the MagWIRE was removed from the ear and processed as described above. At the end of the study, animals were euthanized by an intravenous bolus of potassium chloride (74.5–149 mg kg−1 while under deep anaesthesia).
Statistics and reproducibility
For each experimental condition and concentration, experiments were run in technical duplicate or triplicate with qPCR, and then repeated independently for n = 2 biological replicates. Data were then averaged across experiments, with cell concentrations of 10, 100 and 1,000 cells ml−1 (n = 6 data points per experiment) to compare overall capture performance under different conditions. Experimental data are represented as mean ± standard error (s.e.m.). For hypothesis testing, P values were calculated using a two-sided non-parametric test (Mann–Whitney U test). P < 0.05 was considered statistically significant.
Reporting Summary
Further information on experimental design is available in the Nature Research Reporting Summary linked to this article.
Data availability
The authors declare that all the data supporting the findings of this study are available within the paper and its Supplementary Information. Source data for the figures in this study are available in figshare with the identifier doi: https://doi.org/10.6084/m9.figshare.6272414 (ref. 47).
Supplementary Material
Acknowledgments
We thank D. Sze, A. Thakor, M. Mahmoudi, H. Nejadnik, T. Larson, A. de Souza and H. Tom Soh for discussions. We also thank Pork Power Farms for their help in choosing suitable pigs for the study. We would also like to acknowledge the Veterinary Service Center and Animal Diagnostic Laboratory at Stanford. This research was supported by the US National Institutes of Health (NIH) Awards U54CA151459 (Center for Cancer Nanotechnology Excellence and Translation) and R21CA185804 (to S.S.G. and S.X.W.), the Canary Foundation (to S.S.G.), and the Ben and Catherine Ivy Foundation. The authors also acknowledge funding support from the NIH Shared Instrument Grant S10 RR026714.
Footnotes
Author contributions
O.V., A.A., T.J.G. and S.S.G conceived and designed the research. O.V., A.A. and T.J.G. performed all experiments. O.V., A.A., T.J.G., S.-m.P., C.N.A., E.I.S., S.X.W. and S.S.G analysed the data. T.J.G. and Y.G. performed the computational modelling. Y.M., Y.S., J.K.L, A.G. and K.M. aided with the porcine model. O.V., I.S.A., C.N.A., J.V.-M., E.G. and E.I.S. conducted and analysed the toxicity, biodistribution and pharmacokinetic studies. C.C.O. and H.A. aided with MP characterization. M.H.B. contributed cell culture expertise and reagents. O.V., A.A., T.J.G., S.-m.P. and S.S.G drafted the manuscript with input from all of the authors.
Competing interests
O.V., A.A., T.J.G., S.-m.P, and S.S.G. have filed for patent protection for the MagWIRE technology. The remaining authors declare no competing interests.
Supplementary information is available for this paper at https://doi.org/10.1038/s41551-018-0257-3.
Publisher’s note: Springer Nature remains neutral with regard to jurisdictional claims in published maps and institutional affiliations.
References
- 1.Yu M, Stott S, Toner M, Maheswaran S, Haber DA. Circulating tumor cells: approaches to isolation and characterization. J Cell Biol. 2011;192:373–382. doi: 10.1083/jcb.201010021. [DOI] [PMC free article] [PubMed] [Google Scholar]
- 2.Coumans FAW, Ligthart ST, Uhr JW, Terstappen LWMM. Challenges in the enumeration and phenotyping of CTC. Clin Cancer Res. 2012;18:5711–5718. doi: 10.1158/1078-0432.CCR-12-1585. [DOI] [PubMed] [Google Scholar]
- 3.Alix-Panabières C, Pantel K. Challenges in circulating tumour cell research. Nat Rev Cancer. 2014;14:623–631. doi: 10.1038/nrc3820. [DOI] [PubMed] [Google Scholar]
- 4.Yu M, et al. Ex vivo culture of circulating breast tumor cells for individualized testing of drug susceptibility. Science. 2014;345:216–220. doi: 10.1126/science.1253533. [DOI] [PMC free article] [PubMed] [Google Scholar]
- 5.Cayrefourcq L, et al. Establishment and characterization of a cell line from human circulating colon cancer cells. Cancer Res. 2015;75:892–901. doi: 10.1158/0008-5472.CAN-14-2613. [DOI] [PubMed] [Google Scholar]
- 6.Stoecklein NH, Fischer JC, Niederacher D, Terstappen LWMM. Challenges for CTC-based liquid biopsies: low CTC frequency and diagnostic leukapheresis as a potential solution. Expert Rev Mol Diagn. 2016;16:147–164. doi: 10.1586/14737159.2016.1123095. [DOI] [PubMed] [Google Scholar]
- 7.Adams JD, Kim U, Soh HT. Multitarget magnetic activated cell sorter. Proc Natl Acad Sci USA. 2008;105:18165–18170. doi: 10.1073/pnas.0809795105. [DOI] [PMC free article] [PubMed] [Google Scholar]
- 8.Earhart CM, et al. Isolation and mutational analysis of circulating tumor cells from lung cancer patients with magnetic sifters and biochips. Lab Chip. 2014;14:78–88. doi: 10.1039/c3lc50580d. [DOI] [PMC free article] [PubMed] [Google Scholar]
- 9.Kang JH, et al. A combined micromagnetic–microfluidic device for rapid capture and culture of rare circulating tumor cells. Lab Chip. 2012;12:2175. doi: 10.1039/c2lc40072c. [DOI] [PubMed] [Google Scholar]
- 10.Pamme N. Continuous flow separations in microfluidic devices. Lab Chip. 2007;7:1644. doi: 10.1039/b712784g. [DOI] [PubMed] [Google Scholar]
- 11.Inglis DW, Riehn R, Sturm JC, Austin RH. Microfluidic high gradient magnetic cell separation. J Appl Phys. 2006;99:08K101. [Google Scholar]
- 12.Stott SL, et al. Isolation of circulating tumor cells using a microvortex-generating herringbone-chip. Proc Natl Acad Sci USA. 2010;107:18392–18397. doi: 10.1073/pnas.1012539107. [DOI] [PMC free article] [PubMed] [Google Scholar]
- 13.Ozkumur E, et al. Inertial focusing for tumor antigen-dependent and -independent sorting of rare circulating tumor cells. Sci Transl Med. 2013;5:179ra47. doi: 10.1126/scitranslmed.3005616. [DOI] [PMC free article] [PubMed] [Google Scholar]
- 14.Nagrath S, et al. Isolation of rare circulating tumour cells in cancer patients by microchip technology. Nature. 2007;450:1235–1239. doi: 10.1038/nature06385. [DOI] [PMC free article] [PubMed] [Google Scholar]
- 15.Che J, et al. Classification of large circulating tumor cells isolated with ultra-high throughput microfluidic Vortex technology. Oncotarget. 2016;7:12748–12760. doi: 10.18632/oncotarget.7220. [DOI] [PMC free article] [PubMed] [Google Scholar]
- 16.Chung J, et al. Rare cell isolation and profiling on a hybrid magnetic/size-sorting chip. Biomicrofluidics. 2013;7:54107. doi: 10.1063/1.4821923. [DOI] [PMC free article] [PubMed] [Google Scholar]
- 17.Hou S, et al. Capture and stimulated release of circulating tumor cells on polymer-grafted silicon nanostructures. Adv Mater. 2013;25:1547–1551. doi: 10.1002/adma.201203185. [DOI] [PMC free article] [PubMed] [Google Scholar]
- 18.Fischer JC, et al. Diagnostic leukapheresis enables reliable detection of circulating tumor cells of nonmetastatic cancer patients. Proc Natl Acad Sci USA. 2013;110:16580–16585. doi: 10.1073/pnas.1313594110. [DOI] [PMC free article] [PubMed] [Google Scholar]
- 19.Herrmann IK, et al. Device for continuous extracorporeal blood purification using target-specific metal nanomagnets. Nephrol Dial Transplant. 2011;26:2948–2954. doi: 10.1093/ndt/gfq846. [DOI] [PubMed] [Google Scholar]
- 20.Saucedo-Zeni N, et al. A novel method for the in vivo isolation of circulating tumor cells from peripheral blood of cancer patients using a functionalized and structured medical wire. Int J Oncol. 2012;41:1241–1250. doi: 10.3892/ijo.2012.1557. [DOI] [PMC free article] [PubMed] [Google Scholar]
- 21.Laurent S, Saei AA, Behzadi S, Panahifar A, Mahmoudi M. Superparamagnetic iron oxide nanoparticles for delivery of therapeutic agents: opportunities and challenges. Expert Opin Drug Deliv. 2014;11:1449–1470. doi: 10.1517/17425247.2014.924501. [DOI] [PubMed] [Google Scholar]
- 22.Fu A, et al. Fluorescent magnetic nanoparticles for magnetically enhanced cancer imaging and targeting in living subjects. ACS Nano. 2012;6:6862–6869. doi: 10.1021/nn301670a. [DOI] [PMC free article] [PubMed] [Google Scholar]
- 23.Yellen BB, et al. Targeted drug delivery to magnetic implants for therapeutic applications. J Magn Magn Mater. 2005;293:647–654. [Google Scholar]
- 24.Polyak B, et al. High field gradient targeting of magnetic nanoparticle-loaded endothelial cells to the surfaces of steel stents. Proc Natl Acad Sci USA. 2008;105:698–703. doi: 10.1073/pnas.0708338105. [DOI] [PMC free article] [PubMed] [Google Scholar]
- 25.Xia N, et al. Combined microfluidic–micromagnetic separation of living cells in continuous flow. Biomed Micro. 2006;8:299–308. doi: 10.1007/s10544-006-0033-0. [DOI] [PubMed] [Google Scholar]
- 26.Yavuz CT, et al. Low-field magnetic separation of monodisperse Fe3O4 nanocrystals. Science. 2006;314:964–967. doi: 10.1126/science.1131475. [DOI] [PubMed] [Google Scholar]
- 27.Spivack DE, Kelly P, Gaughan JP, van Bemmelen PS. Mapping of superficial extremity veins: normal diameters and trends in a vascular patient-population. Ultrasound Med Biol. 2012;38:190–194. doi: 10.1016/j.ultrasmedbio.2011.11.008. [DOI] [PubMed] [Google Scholar]
- 28.Thiriet M. Biology and Mechanics of Blood Flows. CRM Series in Mathematical Physics. Springer; New York: 2008. [Google Scholar]
- 29.Aktas B, et al. Stem cell and epithelial–mesenchymal transition markers are frequently overexpressed in circulating tumor cells of metastatic breast cancer patients. Breast Cancer Res. 2009;11:R46. doi: 10.1186/bcr2333. [DOI] [PMC free article] [PubMed] [Google Scholar]
- 30.Zborowski M. Laboratory Techniques in Biochemistry and Molecular Biology. Vol. 32. Elsevier; 2007. pp. 29–61. [Google Scholar]
- 31.Paterlini-Brechot P, Benali NL. Circulating tumor cells (CTC) detection: clinical impact and future directions. Cancer Lett. 2007;253:180–204. doi: 10.1016/j.canlet.2006.12.014. [DOI] [PubMed] [Google Scholar]
- 32.Sharma SV, Bell DW, Settleman J, Haber DA. Epidermal growth factor receptor mutations in lung cancer. Nat Rev Cancer. 2007;7:169–181. doi: 10.1038/nrc2088. [DOI] [PubMed] [Google Scholar]
- 33.Litwin MS, Chapman K. Physical factors affecting human blood viscosity. J Surg Res. 1970;10:433–436. doi: 10.1016/0022-4804(70)90066-1. [DOI] [PubMed] [Google Scholar]
- 34.Armstrong AJ, et al. Circulating tumor cells from patients with advanced prostate and breast cancer display both epithelial and mesenchymal markers. Mol Cancer Res. 2011;9:997–1007. doi: 10.1158/1541-7786.MCR-10-0490. [DOI] [PMC free article] [PubMed] [Google Scholar]
- 35.Liu Y, et al. Circulating tumor cells in HER2-positive metastatic breast cancer patients: a valuable prognostic and predictive biomarker. BMC Cancer. 2013;13:202. doi: 10.1186/1471-2407-13-202. [DOI] [PMC free article] [PubMed] [Google Scholar]
- 36.Meng S. Circulating tumor cells in patients with breast cancer dormancy. Clin Cancer Res. 2004;10:8152–8162. doi: 10.1158/1078-0432.CCR-04-1110. [DOI] [PubMed] [Google Scholar]
- 37.Petros RA, DeSimone JM. Strategies in the design of nanoparticles for therapeutic applications. Nat Rev Drug Discov. 2010;9:615–627. doi: 10.1038/nrd2591. [DOI] [PubMed] [Google Scholar]
- 38.Dorsey JF, et al. Tracking viable circulating tumor cells (CTCs) in the peripheral blood of non-small cell lung cancer (NSCLC) patients undergoing definitive radiation therapy: pilot study results. Cancer. 2015;121:139–149. doi: 10.1002/cncr.28975. [DOI] [PMC free article] [PubMed] [Google Scholar]
- 39.Jain TK, Reddy MK, Morales MA, Leslie-Pelecky DL, Labhasetwar V. Biodistribution, clearance, and biocompatibility of iron oxide magnetic nanoparticles in rats. Mol Pharm. 2008;5:316–327. doi: 10.1021/mp7001285. [DOI] [PubMed] [Google Scholar]
- 40.Tate JA, Petryk AA, Giustini AJ, Hoopes PJ. In vivo biodistribution of iron oxide nanoparticles: an overview. Proc SPIE Int Soc Opt Eng. 2011;7901:790117. doi: 10.1117/12.876414. [DOI] [PMC free article] [PubMed] [Google Scholar]
- 41.Arami H, Khandhar A, Liggitt D, Krishnan KM. In vivo delivery, pharmacokinetics, biodistribution and toxicity of iron oxide nanoparticles. Chem Soc Rev. 2015;44:8576–8607. doi: 10.1039/c5cs00541h. [DOI] [PMC free article] [PubMed] [Google Scholar]
- 42.Tsoi KM, et al. Mechanism of hard-nanomaterial clearance by the liver. Nat Mater. 2016;15:1212–1221. doi: 10.1038/nmat4718. [DOI] [PMC free article] [PubMed] [Google Scholar]
- 43.Coumans F, Terstappen L. In: Whole Genome Amplification. Methods and Protocols. Kroneis T, editor. Vol. 1347. Humana Press; 2015: pp. 263–278. [Google Scholar]
- 44.Talasaz AH, et al. Isolating highly enriched populations of circulating epithelial cells and other rare cells from blood using a magnetic sweeper device. Proc Natl Acad Sci USA. 2009;106:3970–3975. doi: 10.1073/pnas.0813188106. [DOI] [PMC free article] [PubMed] [Google Scholar]
- 45.Galanzha EI, et al. In vivo magnetic enrichment and multiplex photoacoustic detection of circulating tumour cells. Nat Nanotechnol. 2009;4:855–860. doi: 10.1038/nnano.2009.333. [DOI] [PMC free article] [PubMed] [Google Scholar]
- 46.Fonnum G, Johansson C, Molteberg A, Mørup S, Aksnes E. Characterisation of Dynabeads® by magnetization measurements and Mössbauer spectroscopy. J Magn Magn Mater. 2005;293:41–47. [Google Scholar]
- 47.Vermesh O, et al. Dataset for ‘An intravascular magnetic wire for the high-throughput retrieval of circulating tumour cells in vivo’. figshare. 2018 doi: 10.1038/s41551-018-0257-3. https://doi.org/10.6084/m9.figshare.6272414 [DOI] [PMC free article] [PubMed]
- 48.Diaz LA, Bardelli A. Liquid biopsies: genotyping circulating tumor DNA. J Clin Oncol. 2014;32:579–586. doi: 10.1200/JCO.2012.45.2011. [DOI] [PMC free article] [PubMed] [Google Scholar]
Associated Data
This section collects any data citations, data availability statements, or supplementary materials included in this article.
Supplementary Materials
Data Availability Statement
The authors declare that all the data supporting the findings of this study are available within the paper and its Supplementary Information. Source data for the figures in this study are available in figshare with the identifier doi: https://doi.org/10.6084/m9.figshare.6272414 (ref. 47).