

Abstract
Botulinum neurotoxin (BoNT) is a major therapeutic agent. Of seven native BoNT serotypes (A to G), only A and B are currently used in the clinic. Here we compared the potency of commercially available purified native serotypes A1 to F1 across in vitro, ex vivo, and in vivo assays. BoNT potency in vitro was assessed in rat primary cells (target protein cleavage and neurotransmitter release assays) in supraspinal, spinal, and sensory systems. BoNT potency ex vivo was measured in the mouse phrenic nerve hemidiaphragm (PNHD) assay, measuring muscle contractility. In vivo, BoNT‐induced muscle relaxation in mice and rats was assessed in the Digit Abduction Score (DAS) test, while effects on body weight (BW) gain were used to assess tolerability. In all assays, all BoNT serotypes were potent toxins, except serotype D1 in vivo which failed to produce significant muscle flaccidity in mice and rats. In rats, all serotypes were well‐tolerated, whereas in mice, reductions in BW were detected at high doses. Serotype A1 was the most potent serotype across in vitro, ex vivo, and in vivo assays. The rank order of potency of the serotypes revealed differences among assays. For example, species‐specificity was seen for serotype B1, and to a lesser extent for serotype C1. Serotypes F1 and C1, not currently in the clinic, showed preference for sensory over motor models and therefore could be considered for development in conditions involving the somatosensory system.
Keywords: BoNT, characterization, digit abduction score, hemidiaphragm assay, natural toxin, serotype
Abbreviations
- BoNT
botulinum neurotoxin
- BW
body weight
- CMAP
compound muscle action potential
- CTX
cerebral cortical neurons cell culture
- DAS
digit abduction score
- DIV
days in vitro
- DRG
dorsal root ganglion cell culture
- FBS
fetal bovine serum
- HC
heavy chain
- HC
binding domain
- HN
translocation domain
- LC
light chain
- PNHD
phrenic nerve hemidiaphragm assay
- SCN
spinal cord neurons cell culture
- SNAP‐25
synaptosomal‐associated protein of 25 kDa
- SNARE
soluble N‐ethylmaleimide‐sensitive factor attachment protein receptor
- VAMP
vesicle‐associated membrane protein
1. INTRODUCTION
Botulinum neurotoxins (BoNTs) are widely used in the clinic as effective therapeutic agents. BoNT products exert their effect through inhibition of neurotransmitter release, most notably of acetylcholine, at the neuromuscular junction.1, 2 BoNTs are diverse proteins and are represented by at least seven serotypes and more than 40 subtypes, and recently new BoNT‐like proteins have been reported.3, 4 Of the seven naturally occurring immunologically distinct BoNT serotypes (termed A to G) described so far, only A and B are currently used in the clinical practice. Serotypes A, B, E, and F are known to cause botulism in humans, whereas C and D have only been observed in animal cases and serotype G was originally described in a soil sample.5, 6, 7
BoNTs are among the most tissue‐selective drugs known in clinical pharmacology and are characterized by high potency and high specificity.8 BoNTs are enzymatic multimodular proteins with a complex multistep mechanism of action and both structure and mode of action are shared broadly among the serotypes (for review see 1, 9, 10).
Despite the growing number of indications treated with serotypes A1 and B1, and growing interest in other serotypes and subtypes,11 no study has yet compared all serotypes in the same range of assays in vitro, ex vivo, and in vivo. The goal of this study was to compare six commercially available, research grade, and naturally occurring (purified from their respective Clostridia host) BoNT serotypes A1 to F1 across a range of rodent assays. In vitro, serotypes were compared in three primary rat neuronal models: spinal cord neurons (SCN), dorsal root ganglia (DRG) neurons, and cerebral cortical (CTX) neurons. The SCN are widely‐used in the BoNT field as they contain motor neurons that are clinically relevant, DRG neurons are a sensory peripheral nervous system model, whereas CTX neurons represent a supraspinal model highly sensitive to BoNT intoxication.12, 13, 14, 15 The cleavage of their protein substrate (soluble N‐ehtylmaleimide‐sensitive factor attachment protein receptor, SNARE) and the resulting inhibition of neurotransmitter release can be assayed in primary neurons to provide a complementary in vitro readout of BoNT activity. The mouse phrenic nerve hemidiaphragm (PNHD) assay is an ex vivo assay for assessing the neuroparalytic activity of BoNTs, as it directly records the blockade of neuromuscular transmission.16 In vivo, activity of BoNTs in the digit abduction score (DAS) test in mice and rats is indicative of their muscle‐relaxant properties, whereas reductions in body weight (BW) gain are indicative of toxin spread and migration away from the injected site.1, 17, 18, 19, 20
2. MATERIALS AND METHODS
2.1. Botulinum toxins (BoNTs) and general reagents
In this study, commercially available, research grade, purified native botulinum neurotoxins A1, B1, C1, D1, E1, and F1 were studied, and they are referred as A to F throughout the manuscript for easiness. BoNT serotypes A to F were purchased from Metabiologics Inc. (Madison, WI) as purified toxins and their purity analyzed by SDS‐PAGE (% of purity was as follows: 100% for serotype A, 89% serotype B, 87.6% serotype C, 37.3% serotype D, 54% serotype E, and 64.3% serotype F). Serotypes A, B, and E were also purchased from List Biological Laboratories Inc. (Campbell, CA) as complex toxins and BSA was added during the reconstitution step of the lyophilized powder supplied, as recommended by the manufacturer. The addition of BSA (final concentration 1 mg/mL of BSA to μg of BoNT) made analysis of purity by standard SDS‐PAGE not reliable. Toxins were assayed as per manufacturers’ stated quantities present in the vials, and no apparent differences were observed between toxins from the two suppliers. BoNT/E was treated with trypsin prior to its use. General laboratory reagents were from Sigma (Dorset, UK), unless otherwise specified.
2.2. Animals
Sprague Dawley rats and CD‐1 mice were chosen for this study as they are species and strains commonly used to study BoNT biology in models of primary neuronal cultures, the hemidiaphragm assay and the DAS assay12, 15, 19, 21, 22.
All animals for tissue donation were treated humanely and in accordance with Home Office guidelines, UK. Culling of the animals for tissue donation was performed by CO2 asphyxiation under Schedule 1 of the Animals (Scientific Procedures) Act UK 1986. Pregnant Sprague Dawley dams (Charles River, Margate, UK) for in vitro experiments were left to acclimatize for 18‐24 hours following shipping prior to primary culture of embryonic tissue. Embryonic tissue was harvested from unknown/mixed sex embryos. Adult CD‐1 male mice, 25‐30 g (Charles River, Margate) for ex vivo experiments were left to acclimatize for 2‐24 hours prior to culling and tissue harvest.
The protocols for in vivo assays were approved by the ethical committee of Ipsen Innovation and performed in full compliance with the European Union Council Directive (2010/63/EU) and the French National Committee for the care and use of laboratory animals (Decree n° 2013‐118). All studies involving animals are reported in accordance with the ARRIVE guidelines for reporting experiments involving animals.23 For in vivo experiments adult male CD‐1 mice (24‐30 g) were purchased from Charles River (Saint‐Germain‐Nuelles, France), whereas adult female Sprague Dawley rats (170‐200 g) were purchased from Janvier Labs (Saint Berthevin, France). Male mice are routinely used in our facilities. Regarding rats, BW gain is slower in females than in males and as such, they are easier to handle in experiments involving longitudinal testing. Therefore, for these studies we used male mice and female rats, as stated. Animals were group‐housed in plastic cages and maintained on a 12‐hours light/dark cycle (lights on from 07:00 to 19:00 hours) under constant temperature (22 ± 2°C) and humidity (>45%) conditions. Animals had free access to water and were fed with pellet complete diet ad libitum. The diet, reference A04C‐10, was sterilized by irradiation and controlled by SAFE food supplier (Augy, France). Mains tap water was filtered (0.2 μm) and UV (wave‐length: 254 nm) sterilized and distributed in sterilizable plastic bottles equipped with stainless steel drinking tubes mounted in Bakelite/rubber and stainless‐steel fittings. The water supply was analyzed twice a year by the Paris water control center, PERMO (Paris, France) and was free of contaminants. Animals were acclimatized for at least 7 days prior to experiments. On the day of the experiment animals were anesthetized prior to BoNT treatment using a mixture of 4% isoflurane/oxygen for mice, and of 3% isoflurane/oxygen for rats. Prior to BoNT treatment, both mice and rats were randomized to obtain homogenous average BW per group. Administration of BoNTs/vehicle and data collection was performed by an operator blind to treatment.
2.3. SCN cell culture
SCN were prepared by the method described previously.12 Briefly, spinal cords were dissected from embryonic day 15 (E15) Sprague Dawley rat embryos and digested in trypsin/EDTA solution (Gibco, Fisher Scientific, Loughborough, UK) for 40 minutes at 37°C. The spinal cords were then washed with Hank's Balanced Salt Solution‐0.6% glucose, resuspended in culture medium and kept on ice for 30 minutes before trituration. Cells were plated at a density of 125 000 cells/well in 96‐well plates coated with Matrigel in modified Eagle's medium (MEM) with glutamax supplemented with 5% fetal bovine serum (FBS), 5% horse serum, 0.6% glucose, and 0.15% sodium bicarbonate (all from Gibco). After 24 hours, a further 125 μL of the medium was changed to MEM with glutamax supplemented with 5% horse serum, 0.6% glucose, 0.15% sodium bicarbonate, N2 supplement (all from Gibco), 40 ng/mL corticosterone, and 20 ng/mL triiodothyronine (Sigma). Cultures were grown in a humidified 10% CO2 atmosphere at 37°C. On day in vitro (DIV) 6 antimitotic compounds 5‐fluoro‐2′‐deoxyuridine and uridine were added. Cells were maintained by replacement of half the medium twice per week.
2.4. DRG cell culture
DRG neurons were prepared by the method described previously.15 Briefly, ganglia were dissected from embryonic day 15 (E15) Sprague Dawley rat embryos and digested in trypsin/EDTA solution (Gibco) for 40 minutes at 37°C. The ganglia were then triturated to disaggregate the cells. Cells were plated at a density of 125 000 cells/well in 96‐well plates coated with Matrigel in Dulbecco's modified Eagle's medium (containing 5% inactivated FBS, 2% B27 supplement (all from Gibco), 100 ng/mL 2.5 S mouse nerve growth factor (Promega, Southampton, UK), 5 mmol/L l‐glutamine and 0.6% glucose. Cultures were grown in a humidified 5% CO2 atmosphere at 37°C. On DIV 2 the antimitotic compound cytosine arabinoside (10 μmol/L, Sigma) was added to prevent growth of rapidly dividing glial and endothelial cells. Cells were maintained by replacement of half the medium twice per week.
2.5. CTX cell culture
CTX were prepared from embryonic day 17‐18 (E17‐E18) Sprague Dawley rat embryos, as described previously.21 Briefly, dissected cerebral cortical tissue was collected into ice‐cold Hank's Balanced Salt Solution without Ca2+ or Mg2+, and then dissociated in papain solution for 40 minutes at 37°C following the manufacturer's instructions (Worthington Biochemical, Lakewood, US). Cortical cells were plated on poly‐L‐ornithine coated 96‐well plates at a density of 20 000 cells/well in 125 μL Neurobasal medium containing 2% B27 supplement, 0.5 mmol/L glutamax, 1% FBS and 100 U/mL penicillin/streptomycin. Cells were maintained in a humidified atmosphere containing 5% CO2 at 37°C. A further 125 μL Neurobasal medium containing 2% B27, 0.5 mmol/L glutamax was added on DIV 4. Cells were maintained by replacement of half the medium twice per week. On DIV 11, 1.5 μmol/L cytosine β‐D‐arabinofuranoside was added to the medium to prevent proliferation of non‐neuronal cells.
2.6. Measurement of SNARE cleavage by Western Blotting
SCN, DRG, and CTX cells were treated with serial dilutions of BoNT and incubated at 37°C for 24 h, following 2‐4 weeks in vitro. Cells were lysed by removing all medium and adding sample buffer (25% NuPAGE buffer [Life Technologies, Fisher Scientific] supplemented with 10 mmol/L dithiothreitol and 250 units/μL Benzonase [Sigma]). Lysate proteins were separated by SDS‐PAGE and transferred to nitrocellulose membranes. Primary antibodies used were against synaptosomal‐associated protein of 25 kDa (SNAP‐25) (Sigma S9684, Sigma), syntaxin 1 (Synaptic Systems S0664; Synaptic Systems, Goettingen, Germany), VAMP1 (Abcam Ab3346; Abcam, Cambridge, UK and Synaptic Systems S104022), and VAMP‐2 (Abcam Ab3347). The secondary antibodies were HRP‐conjugated anti‐rabbit IgG (Sigma A6154) and HRP‐conjugated antimouse IgG (Sigma A3673). Proteins were visualized using an enhanced chemiluminescent detection system (Fisher Scientific). Luminescence detection was carried out using a Syngene GeneGnome and image analysis was performed using GeneTools software (Syngene Bioimaging, Cambridge UK). VAMP cleavage was monitored by measuring the disappearance of the specific VAMP immunoreactive bands. SNAP‐25 and syntaxin‐1 cleavage were monitored by measuring the disappearance of the specific full‐length SNARE protein and the appearance of the cleaved fragment of the SNARE protein. The amount of cleaved SNARE protein was expressed as a percentage of the sum of full‐length SNARE protein and cleaved product when available. Data were fitted to a four‐parameter logistic equation (upper and bottom asymptotes were constrained at 0 and 100% where appropriate), pEC50 and EC50 were calculated.
2.7. Assessment of glycine release
Glycine release was assessed in SCN at DIV 20‐23. SCN were treated with a concentration range of BoNT for 24 hours at 37°C. Following removal of neurotoxin, cells were briefly washed three times in HEPES‐buffered salt solution (136 mmol/L NaCl, 3 mmol/L KCl, 2 mmol/L CaCl2, 1 mmol/L MgCl2, 10 mmol/L HEPES, 10 mmol/L glucose, pH 7.2). Cells were loaded with 2 μCi/ml [3H]‐glycine (Perkin Elmer, Beaconsfield, UK) in HBS for 60 minutes at 35°C. Following removal of [3H]‐glycine, cells were briefly washed three times with HBS. Basal and stimulated [3H]‐glycine release were measured by incubation at 35°C for 5 minutes with 50 μL/well of HBS solutions containing low (3 mmol/L KCl) or high (60 mmol/L KCl) potassium. To determine retained [3H]‐glycine in the cells, cells were lysed by adding 50 μL/well RIPA buffer (Sigma). Superfusates and cell lysates were transferred into 96‐well Isoplates (Perkin Elmer) and 200 μL/well OptiPhase Supermix scintillation fluid was added. Radioactivity was quantified using a MicroBeta2 plate reader (Perkin Elmer). Data were fitted to a four‐parameter logistic equation, and upper and bottom asymptotes were constrained at 0% and 100% where appropriate. pEC50 and EC50 were calculated.
2.8. Assessment of glutamate release
Glutamate release was assessed in CTX at DIV 19‐21. CTX were treated with a concentration range of BoNT for 24 hours at 37°C. Following removal of neurotoxin, cells were briefly washed three times in Neurobasal medium containing 2% B27, and 0.5 mmol/L glutamax and then preincubated in assay medium (Neurobasal medium without phenol red, 2% B27, 0.5 mmol/L glutamax, 10 μmol/L (3S)‐3‐[[3‐[[4‐(Trifluoromethyl) benzoyl] amino]phenyl] methoxy]‐L‐aspartic acid [excitatory amino acid transporter inhibitor, Tocris, Bristol, UK]) on a heat block at 35°C for 30 minutes. Following preincubation, cells were briefly washed once in assay medium. Basal and stimulated glutamate release were measured by incubation at 35°C for 5 minutes with 40 μL/well assay medium containing low potassium (5 mmol/L KCl), or high potassium (60 mmol/L KCl), respectively. Cell superfusates were collected and glutamate content measured using an Amplex Red glutamic acid assay (Invitrogen, Fisher Scientific, UK). 10 μL superfusates were combined with 10 μL detection mix (100 mmol/L Tris‐HCl, pH 7.4 containing 26 μg/mL Amplex UltraRed, 0.25 U/mL horseradish peroxidase, 0.08 U/ml glutamate oxidase, 0.5 U/mL glutamate pyruvate transaminase and 200 μmol/L alanine) in black 384‐well Optiplates (Perkin Elmer). Plates were incubated for 30 minutes at 37°C after which 5 μL Amplex Red Stop reagent was added to each well. Fluorescence emission at 590 nm following excitation at 535 nm was determined using an Envision plate reader (Perkin Elmer). Glutamate concentration of superfusates was determined by interpolation from a glutamate standard curve also run in each assay. Data were fitted to a four‐parameter logistic equation, pIC50 and IC50 were calculated.
2.9. Mouse PNHD assay
Isolated, mouse left hemidiaphragms were obtained from adult male, CD‐1 mice purchased from Charles River (Margate, UK). With the phrenic nerve attached, they were incubated in a tissue bath (Linton Instrumentation, Roydon, U.K. or EMKA technologies SA, Paris, France) containing gassed Krebs‐Henseleit buffer (118 mmol/L NaCl, 1.2 mmol/L MgSO4, 11 mmol/L glucose, 4.7 mmol/L KCl, 1.2 mmol/L KH2PO4, 2.5 mmol/L CaCl2, 25 mmol/L NaHCO3, pH 7.5). The phrenic nerve was continuously electro‐stimulated (10 V, 20 μseconds, 1 Hz) and the resultant isometric contractions of the diaphragm muscle were recorded. Following a period of stability, the tissue was incubated with 3 μmol/L tubocurarine hydrochloride (Sigma), a competitive antagonist at nicotinic acetylcholine receptors on postsynaptic muscle cells, until > 95% paralysis of the muscle was observed. This provided confidence that the diaphragm muscle contraction was due to acetylcholine release from presynaptic neurons rather than direct electrical stimulation of the muscle through the buffer. Tubocurarine was washed out, and following a further period of stability, the control contractile tension of the muscle was recorded before the assay buffer was exchanged for buffer containing BoNT. Muscle activity was recorded until no further muscle contraction was detected. The potency of BoNTs was estimated as: the time to reduce the amplitude of diaphragm contraction to 50% (t 50) of control following BoNT addition. Following complete paralysis, the muscle was directly stimulated by increasing the strength of the applied electrostimulation in order to establish continued physiological viability of the preparation.
2.10. Intramuscular (i.m.) administration of BoNTs in mice and rats
Mice were anaesthetized with 4% isoflurane/oxygen in an induction chamber before administration of an i.m. injection of BoNT diluted to its final concentration in gelatin phosphate buffer (GPB), containing Na2HPO4 (Merck, Darmstadt, Germany) 5 mmol/L plus gelatin 10% (M/V) (Sigma) to a final concentration of 0.2%, pH adjusted to 6.5 with orthophosphoric acid (Merck), in the gastrocnemius‐soleus muscle complex of the right hind limb. Effects of each BoNT serotype in mice were assessed in independent experiments. Specifically, mice (n = 6/dose) were assessed for normal DAS response before being treated with BoNT serotypes A (0.89, 1.33, 2, 3, 4.40, 6.70, 10, 15 pg/animal), B (0.18, 0.26, 0.39, 0.59, 0.89, 1.33, 2, 3, 4.40 pg/animal), C (5, 15, 25, 45 pg/animal), D (1, 2.50, 5, 15, 25, 45, 80 pg/animal), E (17.60, 26.30, 39.50, 59.30, 88.90, 100 pg/animal), and F (3.90, 5.90, 8.80, 13.20, 19.80, 29.60, 44.40, 66.70, 90 pg/animal). Each mouse DAS experiment also included a control group of animals injected only with vehicle, GPB (n = 6).
Rats were anaesthetized with 3% isoflurane/oxygen in an induction chamber before administering an i.m. injection of BoNT (diluted to its final concentration in GPB) in the peroneus muscle complex of the left hind limb. Effects of each BoNT serotype in rats were assessed in independent experiments. Specifically, rats (n = 6/dose) were assessed for normal DAS response, before being treated with BoNT serotypes A (0.50, 1, 2.50, 5, 10 pg/animal), B (500, 1000, 1500, 2000, 3000, 4000, 5000, 6500, 8000, 10000 pg/animal), C (1, 2, 4, 10, 30, 100, 300 pg/animal), D (100, 300, 1000, 5000, 10000, 15000 pg/animal), E (10, 50, 100, 200, 1200, 1600 pg/animal), and F (25, 50, 75, 100, 200, 300, 450, 600, 900, 1200 pg/animal). Each study included a group of control animals injected only with vehicle, GPB (n = 6).
All BoNTs and the vehicle (GPB) were administered at 20 μL/animal volume in mice and 10 μL/animal volume in rats. The injections were performed using a 30‐gauge needle attached to a 100 μL syringe. At the end of the experiment, or earlier if deemed necessary, animals were culled by CO2 asphyxiation.
2.11. DAS tests in mice and rats
The mouse DAS test was performed as previously described.17 Mice were suspended briefly by the tail to elicit a typical startle response characterized by the hind limb extension and abduction of digits. The mouse DAS was assessed using a five‐point scale: DAS 0 = normal to DAS 4 = maximal reduction in digit abduction and leg extension. Mice were scored for DAS response at baseline (day 0) and daily on days 1‐4 by an observer blind to treatment. DAS 4 dose was defined as the first experimental dose inducing the mean DAS value of 4 for that dose group. For analysis, each dose (pg/animal) was converted to its natural logarithm and the highest average DAS score (mean DAS max) per dose group was plotted. As the doses of 45 pg/animal for serotype C and 90 pg/animal for serotype F caused lethality, they were not included in subsequent analysis. Also, as serotype D failed to induce DAS 4, it was also excluded from analysis. The data were fitted to a four‐parameter logistic equation curve fit, with the lower asymptote constrained to 0 and the upper asymptote constrained to 4. The obtained dose value corresponding to half‐maximal DAS (DAS 2) from the equation, it was converted to ED50 by inverting the calculated value in the natural logarithm scale to its linear value.
To perform DAS test in rats,20 animals were picked by the torso to elicit a typical startle response characterized by the hind limb extension and abduction of digits. The DAS was assessed using a five‐point scale: DAS 0 = normal to DAS 4 = maximal reduction in digit abduction and leg extension. Animals were scored for DAS response 7 hours following the BoNT injection and then twice a day up to 15 days after injection by an observer blind to treatment. DAS 4 dose was defined as the first experimental dose inducing the mean DAS value of 4 for that dose group. For analysis, each dose (pg/animal) was converted to its natural logarithm and the highest average DAS score (mean DAS max) per dose group was plotted. As serotype D failed to induce DAS 4, it was excluded from further analysis. The data were fitted to a four‐parameter logistic equation curve fit, with the lower and upper asymptote constrained within 0 and 4, respectively. The obtained dose value corresponding to half‐maximal DAS max (DAS 2) from the equation was converted to ED50 by inverting the calculated value in the natural logarithm scale to its linear value.
2.12. BW change in response to BoNT treatment in mice and rats
In mice, BWs were monitored daily for four days and the percentage of BW change from day 0 (% BW) was calculated for each dose. As each serotype resulted in BW loss at high doses, a linear regression analysis was used to calculate a theoretical dose for which there was no weight gain (0% BW) when compared with day 0 for each serotype. The tolerability index for each serotype in mice was calculated as 0% BW/ED50.
In rats, BWs were monitored daily for 15 days. As overall no BW loss was detected in any treated groups (see Results below), effects of BoNT serotypes on BW gain in the rat was assessed by calculating the difference in percent change in BW from day 0 (% BW) between BoNT‐treated vs vehicle‐treated groups.
2.13. Data and statistical analysis
The data and statistical analysis comply with the recommendations on experimental design and analysis in pharmacology.24 All data are presented as mean ± SEM unless otherwise indicated. For in vitro assays (96‐well plate format) each individual experiment was performed in triplicate to ensure the reliability of the single value, and the average of n individual experiments was taken to represent each data point. For ex vivo and in vivo experiments, tissue isolated from a single animal or a single animal responsiveness represented n = 1.
The concentration response and dose‐response curves analyses were performed using GraphPad Prism version 7.04 (GraphPad Software Inc., La Jolla, California, USA). A four‐parameter logistic equation was fitted to the data and the pEC50, pIC50, t 50 or ED50 was calculated. The inclusion criterion was set at R 2 > 0.900.
The possibility of linear correlation regarding potency for the 6 BoNT serotypes in a given pair of assays was assessed by calculating the Pearson's coefficient, using GraphPad Prism version 7.04 (GraphPad Software Inc.).
When assessing rank order of potency, a one‐way ANOVA followed by Bonferroni's post hoc test was performed for the in vitro assays (GraphPad Prism version 7.04, GraphPad Software Inc.). For the mouse ex vivo mPNHD assay, a linear regression was fitted to the data from each serotype (JMP Pro 13.0.0, copyright 2016, SAS Institute Inc, Cary, North Carolina, USA). Then, a predicted dose from a specified t 50 time, 70 minutes, was calculated for all toxins, and the pmol/L potency was normalized to the least potent toxin, here serotype D, as described in Ref. 25. Comparison by Z‐test followed by Sidak correction was used for potency ranking (JMP Pro 13.0.0, SAS Institute Inc). The symbol “>” was used between datasets that revealed statistical significance and the symbol “=”was used between datasets showing no significant difference. The symbol “,” was used to indicate the rank order of potency in the in vivo experiments, for which statistical analysis was not performed (n = 1 ED50 value calculated per serotype). In vivo BW data (see Tables S1 and S2) were analyzed by one‐way ANOVA followed by Dunnett's post hoc analysis (JMP 13.1.0., SAS Institute Inc). Statistical significance was established at P < 0.05 throughout the manuscript.
3. RESULTS
3.1. SNARE cleavage in rat in vitro assays
BoNT serotypes A to F produced a concentration‐dependent increase in SNARE cleavage in the three rat in vitro assays tested (see Figure 1 and Table 1). The maximal SNARE cleavage (~100% of the corresponding target SNARE protein) was seen at the highest concentrations of each serotype tested, except for B and E in DRG cultures in which the top concentrations did not reach a plateau in their effect.
Figure 1.
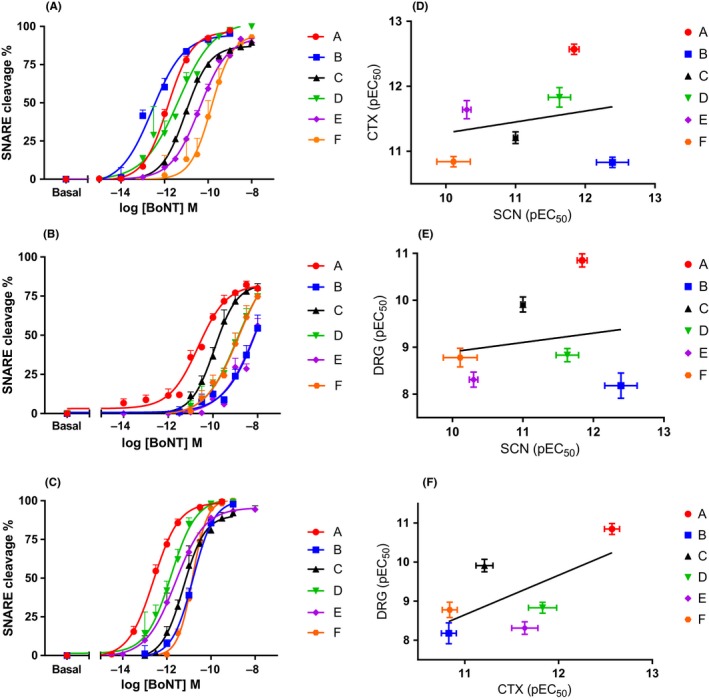
Comparison of serotypes A1 to F1 potency in the SNARE cleavage assay in rat in vitro cell models. Panel A shows concentration response curves for SCN, panel B shows concentration response curves for DRG, and panel C shows the concentration response curves for CTX. Data points are mean ± SEM of n = 5‐8 independent experiments performed in triplicate (see Table 1 for further details). Pearson's correlation analysis of the potency of A1 to F1 on SNARE cleavage assay between different rat in vitro cell models was performed. Panel D shows the scatterplot and linear correlation between pEC 50 values in SCN and CTX, panel E shows the scatterplot and linear correlation between pEC 50 values in SCN and DRG, and panel F shows the scatterplot and linear correlation analysis between pEC 50 values in CTX and DRG. Cleavage of VAMP2 is depicted for B and cleavage of SNAP‐25 is depicted for C, see Table 1 for further details. CTX, cerebral cortical neurons cell culture; DRG, dorsal root ganglion cell culture; SCN: Spinal cord neurons cell culture
Table 1.
Comparison of BoNT serotypes A1‐F1 in SNARE protein cleavage assays
| Serotype (target) | BoNT Potency in the SNARE cleavage assay, pEC50 | ||
|---|---|---|---|
| Rat SCN | Rat DRG | Rat CTX | |
| A (SNAP‐25) | 11.84 ± 0.07 (n = 6) | 10.85 ± 0.14 (n = 8) | 12.57 ± 0.08 (n = 7) |
| B (VAMP2) | 12.39 ± 0.23 (n = 7) | 8.18 ± 0.27(n = 5)*,‡,§ | 10.83 ± 0.08 (n = 7)*,¶,+,§ |
| B (VAMP1) | 10.85 ± 0.17 (n = 5)†,* | ND | ND |
| C (SNAP‐25) | 11.00 ± 0.03 (n = 6)†,* | 9.91 ± 0.16 (n = 6)* | 11.21 ± 0.09 (n = 5)*,¶ |
| C (syntaxin) | 10.39 ± 0.12 (n = 6)†,*,¶ | 9.71 ± 0.27 (n = 5)* | 11.36 ± 0.14 (n = 5)* |
| D (VAMP2) | 11.63 ± 0.16 (n = 6)† | 8.83 ± 0.14 (n = 6)*,‡ | 11.83 ± 0.15 (n = 5)* |
| E (SNAP‐25) | 10.30 ± 0.06 (n = 6)†,*,¶ | 8.31 ± 0.16 (n = 7)*,‡,§ | 11.64 ± 0.14 (n = 7)* |
| F (VAMP2) | 10.11 ± 0.24 (n = 7)†,*,¶,‡ | 8.78 ± 0.20 (n = 6)*,‡,§ | 10.84 ± 0.08 (n = 5)*,¶,+ |
Data are mean ± SEM of n = 5‐8 independent experiments (n numbers indicated in Table) performed in triplicate. ND, not determined; BoNT, Botulinum neurotoxins; CTX, cerebral cortical neurons cell culture; DRG, dorsal root ganglion cell culture; SNAP‐25, synaptosomal‐associated protein of 25 kDa; VAMP, Vesicle‐associated membrane protein.
*One‐way ANOVA followed by Bonferroni's post hoc test revealed statistical significance as follows: *P < 0.05 vs A, † P < 0.05 vs B (VAMP2), ‡ P < 0.05 vs C (SNAP‐25), § P < 0.05 vs C (Syntaxin), ¶ P < 0.05 vs D, and + P < 0.05 vs E.
In SCN, the rank order of potency was BVAMP2 = A > D > CSNAP‐25 = BVAMP1 > Csyntaxin = E > F. In DRG the rank order of potency was A > CSNAP‐25 = Csyntaxin > D > F = E = BVAMP2. In CTX, the rank order of potency was A > D = E = Csyntaxin > CSNAP‐25 > F > BVAMP2
For serotypes B and C, we studied the cleavage of two different target SNARE proteins; namely VAMP1 and VAMP2 in SCN for sero‐type B, and SNAP‐25 and syntaxin in SCN, DRG, and CTX for C (see Table 1). For serotype B, there was a 35‐fold difference in its potency to cleave VAMP2 compared to VAMP1 in SCN, VAMP1 being the less preferred target. For serotype C, SNAP‐25 cleavage was roughly equivalent (up to fourfold higher) to syntaxin cleavage in the three models (4‐, 0.7‐, and 1.5‐fold for SCN, DRG, and CTX, respectively).
3.2. Neurotransmitter release in rat in vitro assays
BoNT serotypes A to F produced a concentration‐dependent decrease in the release of glycine in SCN and in the release of glutamate in CTX following BoNT intoxication (Figure 2 and Table 2). The rank order of potency in the SCN glycine release assay was A >B > C = D > E > F. The rank order of potency in the CTX glutamate release assay was A > D = C = E > F = B.
Figure 2.
Comparison of serotypes A1 to F1 potency in the inhibition of neurotransmitter release assays in rat in vitro cell models. (A) shows concentration response curves on glycine release in SCN, and (B) shows the concentration response curves on glutamate in CTX. Data points are mean ± SEM of n = 5‐8 independent experiments performed in triplicate (see Tables 1 and 2 for further details). Pearson's correlation analysis of the potency of A1 to F1 on SNARE cleavage assay compared to the respective neurotransmitter release for the SCN and CTX in vitro cell models was performed. Panel C shows the scatterplot and linear correlation between pEC 50 values in the cleavage assay and pIC 50 for the neurotransmitter assay for SCN, and panel D shows the scatterplot and linear correlation between the pEC 50 values in the cleavage assay and pIC 50 for the neurotransmitter assay for CTX. See Tables 1 and 2 for further details. CTX, cerebral cortical neurons cell culture; SCN: Spinal cord neurons cell culture
Table 2.
Comparison of BoNT serotypes A1‐F1 in neurotransmitter release assays
| BoNT potency in the K+‐evoked neurotransmitter release assay, pIC50 | ||
|---|---|---|
| Serotype | Glycine (rat SCN) | Glutamate (rat CTX) |
| A | 12.42 ± 0.06 (n = 8) | 12.36 ± 0.06 (n = 5) |
| B | 11.57 ± 0.08(n = 7)* | 10.78 ± 0.10 (n = 5)*,§,‡,¶ |
| C | 10.96 ± 0.05 (n = 5)*,† | 11.73 ± 0.07 (n = 5)* |
| D | 10.69 ± 0.11 (n = 5)*,† | 11.95 ± 0.08 (n = 5)* |
| E | 10.26 ± 0.11 (n = 5)*,†,‡,§ | 11.67 ± 0.10 (n = 5)* |
| F | 9.78 ± 0.04 (n = 7)*,†,‡,§,¶ | 10.95 ± 0.06 (n = 5)*,§,‡,¶ |
Data are mean ± SEM of n = 5‐8 independent experiments (n numbers indicated in Table) performed in triplicate. BoNT, Botulinum neurotoxinsl; CTX, cerebral cortical neurons cell culture
One‐way ANOVA followed by Bonferroni's post hoc test revealed statistical significance as follows: *P < 0.05 vs A, † P < 0.05 vs B, ‡ P < 0.05 vs C, § P < 0.05 vs D, and ¶ P < 0.05 vs E.
In both release assays serotype A showed a residual release of ~20% at the bottom asymptote for the assay, corresponding to the maximal concentrations tested (Figure 2). In the SCN glycine release assay, a high residual neurotransmitter release was seen for serotypes A, B, D, and F (21.72 ± 2.27% n = 8 for A, 16.79 ± 0.94% n = 7 for B, 15.92 ± 1.12% n = 5 for D, and 13.20 ± 1.27% n = 7 for F, mean ± SEM n experiments run in triplicate), whereas the inhibition of release was complete within margins of error for serotypes E and C (5%‐6% range for both). There were statistical differences for serotypes C and E in comparison to A (P < 0.05). In the CTX assay, only serotype A showed a high residual neurotransmitter release (24.85 ± 2.36%, mean ± SEM n = 5 experiments run in triplicate), whereas other serotypes were statistically different and close to complete inhibition of glutamate release (between 2.6 and 6% for serotypes B, C, D, E, and F).
3.3. Mouse PNHD assay
BoNT serotypes A to F produced a concentration‐dependent decrease in the muscle contractility of mouse PNHD (Figure 3A, Table 3 and Table S3). At 10 pmol/L all serotypes produced complete inhibition of contractile force between 70 and 400 minutes (data not shown). The rank order of potency, using a calculated concentration that would produce a half‐paralytic time of 70 minutes for all toxins, was A = B > E > F = C = D.
Figure 3.
Comparison of serotypes A1 to F1 potency in ex vivo and in vivo models. (A) shows concentration responses in mouse phrenic nerve hemidiaphragm (PNHD) assay. (B) shows concentration response curves in the digit abduction score (DAS) test in mice, and (C) shows concentration response curves in the DAS test in rats. Mouse PNHD data are mean ± SEM from n = 5‐20 independent experiments per concentration (see Table 3 for details). For DAS data each point represents the observed mean from individual experiments with n = 6 animals per dose. See Tables 3, 4, 5, for further details; DAS, Digit Abduction Score; PNHD, phrenic nerve hemidiaphragm; PNHD: phrenic nerve hemidiaphragm assay
Table 3.
Comparison of BoNT serotypes A1‐F1 in the mouse PNHD assay
| Serotype | Linear regression model | Predicted Ln (concentration) corresponding to 70 min t 50 ± SEM | Normalized potency |
|---|---|---|---|
| A | Y = 88.4 − 14.5*Ln(concentration), R 2 = 0.789 | 1.3 ± 0.120 | 60 |
| B | Y = 71.7 − 7.6*Ln(concentration), R 2 = 0.302 | 0.2 ± 0.848 | 170 |
| C | Y = 175.7 − 20.6*Ln(concentration), R 2 = 0.820 | 5.1 ± 0.373 | 1 |
| D | Y = 235.9 − 30.9*Ln(concentration), R 2 = 0.743 | 5.4 ± 0.350 | 1 |
| E | Y = 120.3 − 21.1*Ln(concentration), R 2 = 0.865 | 2.4 ± 0.106 | 20 |
| F | Y = 162.0 − 19.0*Ln(concentration), R 2 = 0.889 | 4.8 ± 0.138 | 2 |
For linear regressions 3‐5 concentrations per BoNT serotype were included, each concentration point having at least n = 5 independent experiments (n = 5‐20, see Table S3 for individual data points). Z‐test analysis followed by Sidak's correction revealed the rank order of potency as follows: A = B > E > F = C = D. BoNT, Botulinum neurotoxins; PNHD, phrenic nerve hemidiaphragm.
3.4. Potency and tolerability in the mouse DAS test
In mice, acute, i.m. administration of BoNT serotypes A, B, C, E, and F resulted in dose‐related increases in DAS values, with maximal scores of DAS 4 being reached 1 to 3 days postadministration (Figure S1). The ED50 values ranged from 0.7 pg/animal (for serotype B) to 29.3 pg/animal (for serotype E, Table 4). For serotype D, no dose‐related effects on DAS were seen, and DAS 2 value was not reached at doses up to 45 pg/animal, whereas lethality was detected at 80 pg/animal. Thus, the rank order of BoNT potency in mice was B, A, C, F, E; with D not being determined and considered the least potent serotype.
Table 4.
Comparison of doses for mean ED50, DAS4, no change in body weight (0% BW), and corresponding tolerability index values across BoNT serotypes A1‐F1 following acute, i.m. administration in CD‐1 mice
| Serotype | ED50 (pg/animal) | DAS4 dose (pg/animal) | 0% BW (pg/animal) | 0% BW/ED50 |
|---|---|---|---|---|
| A | 2.3 | 15 | 8.5 | 3.7 |
| B | 0.7 | 4.4 | 2.8 | 4 |
| C | 10.8 | 45 | 16.5 | 1.5 |
| D | ND | ND | 34.1 | ND |
| E | 29.3 | 100 | 33.6 | 1.1 |
| F | 12.3 | 90 | 41.9 | 3.4 |
Four to ten groups of n = 6 animals each were treated with increasing doses of BoNT for each serotype. For details and data calculations please refer to material and methods and Figure S1. ND, not determined; BoNT, Botulinum neurotoxins.
Acute, i.m. administration of BoNT serotypes also resulted in dose‐related changes in BW in mice, including BW loss at higher doses (Table S1). The calculated doses associated with no change in BW (0% BW) ranged from 2.8 (for serotype B) to 41.9 pg/animal (for serotype F, Table 4). The rank order of tolerability index, calculated as 0% BW/ED50 was B, A, F, C, E, in which serotype B had the largest tolerability index and serotype E, the smallest. Lethality was observed in animals treated at 80 pg/animal of serotype D (without inducing DAS 2) and those treated at 45 pg/animal of serotype C (while inducing DAS 4). Therefore, serotype C is considered the most toxic serotype in CD‐1 mice.
3.5. Potency and tolerability in the rat DAS test
In rats, acute, i.m. administration of BoNT serotypes A, B, C, E and F resulted in dose‐related increases in DAS values, the maximal score of DAS 4 being reached 1 to 3 days postadministration (Fig. S2). The ED50 values ranged from 0.7 (for serotype A) to 608.5 pg/animal (for serotype B, Table 5). The ED50 values were not determined for serotype D, since DAS 4 was not reached. Thus, the rank order of BoNT potency in rats was A, C, F, E, B.
Table 5.
Comparison of mean ED50, DAS4 doses, highest dose tested, and effect on BW gain across BoNT serotypes A1‐F1 following acute, i.m. administration in Sprague‐Dawley rats
| Serotype | ED50 (pg/animal) | DAS4 dose (pg/animal) | Highest dose tested(pg/animal) | Effect on BW |
|---|---|---|---|---|
| A | 0.7 | 10 | 10 | No |
| B | 608.5 | 5000 | 10 000 | Noa |
| C | 3.0 | 30 | 300 | No |
| D | ND | ND | 15 000 | No |
| E | 62.2 | 1600 | 1600 | No |
| F | 51.2 | 1600 | 4800 | No |
Five to ten groups of n = 6 animals each were treated with increasing doses of BoNT for each serotype. For details and data calculations please refer to Material and Methods and Figure S2. ND, not determined; BoNT, Botulinum neurotoxins; BW, body weight.
Transient effect at the dose of 6500 pg/animal.
At the dose range tested, none of these serotypes showed any effect on BW gain (Table S2). A transient effect of 6500 pg/animal of serotype B on BW gain was seen, but lacked dose‐dependency (data not shown).
3.6. Correlation between in vitro, ex vivo, and in vivo data
Table 6 shows Pearson's coefficient (r) and P values for correlations between all in vitro, ex vivo, and in vivo assays. Selected examples of correlations are shown in Figure 4. Of all the combinations tested, only the comparison of the corresponding neurotransmitter release and SNARE cleavage data for SCN and CTX were significant (P < 0.05). This significance was also retained when BVAMP1 SNARE cleavage data were used (r = 0.933, P = 0.006*, n = 6 XY pairs) instead of BVAMP2 values (data depicted in Table 6).
Table 6.
Comparison of Pearson correlation coefficients between all assays used in this study
| Rat SCN SNARE | Rat SCN Gly Release | Rat DRG SNARE | Rat CTX SNARE | Rat CTX Glu release | Rat DAS | Mouse mPNHD | Mouse DAS | ||
|---|---|---|---|---|---|---|---|---|---|
| Rat SCN SNARE | 1 | r = 0.943, (P = 0.005*) | r = 0.073, (P = 0.890) | r = 0.353, (P = 0.493) | r = 0.199, (P = 0.705) | r = −0.359, (P = 0.553) | r = 0.006*, (P = 0.991) | r = 0.630, (P = 0.254) | |
|
Rat SCN Gly Release |
1 | r = −0.041* (P = 0.938) | r = 0.473, (P = 0.344) | r = 0.303, (P = 0.559) | r = −0.281, (P = 0.647) | r = 0.194, (P = 0.712) | r = 0.366, (P = 0.544) | ||
| Rat DRG SNARE | 1 | r = 0.440, (P = 0.383) | r = 0.647 (P = 0.165) | r = 0.804, (P = 0.101) | r = −0.462, (P = 0.356) | r = 0.167 (P = 0.788) | |||
| Rat CTX SNARE | 1 | r = 0.951, (P = 0.005*) | r = 0.624, (P = 0.261) | r = −0.061 (P = 0.909) | r = −0.319 (P = 0.600) | ||||
|
Rat CTX Glu Release |
1 | r = 0.829, (P = 0.083) | r = −0.237, (P = 0.651) | r = −0.384, (P = 0.524) | |||||
| Rat DAS | 1 | r = −0.383, (P = 0.524) | r = −0.432, (P = 0.467) | ||||||
| Mouse mPNHD | 1 | r = 0.073, (P = 0.907) | |||||||
| Mouse DAS | 1 | ||||||||
Analysis of the correlation of the potency values between the assays in this study. Correlations were calculated with mean potency values of EC50 (pmol/L), t 50 (min) at 10 pmol/L toxin concentration, and ED50 (pg/animal) for in vitro, ex vivo, and in vivo data, respectively. Data presented are r (Pearson's coefficient) and P values (statistical significance, *P < 0.05). Correlations were made using BoNT/B1 VAMP‐2 cleavage and BoNT/C1 SNAP‐25 cleavage potency values for the in vitro SNARE cleavage assays. All correlations have n = 6 XY pairs of data points (BoNT serotypes A1 to F1), except those involving mouse DAS and rat DAS which have n = 5 XY pairs (corresponding to A1, B1, C1, E1, and F1; D1 potency not determined, see above for details) BoNT, Botulinum neurotoxins; CTX, cerebral cortical neurons cell culture; DAS, Digit Abduction Score; DRG, dorsal root ganglion cell culture; PNHD, phrenic nerve hemidiaphragm; SCN, spinal cord neurons cell culture; SNAP‐25, synaptosomal‐associated protein of 25 kDa.
Figure 4.
Pearson's correlation analysis of the potency of serotypes A1 to F1 on in vitro, ex vivo and in vivo assays. The scatter plot and linear correlation are shown for (A) between the mouse PNHD and the mouse DAS assays, (B) between the mouse DAS and the rat DAS assays, (C) between the rat SCN SNARE cleavage and the rat DAS assays, and (D) between the rat DRG SNARE cleavage and the rat DAS assays. Data shown are mean potency values (EC 50, t 50 at 10 pmol/L toxin concentration or ED 50, as appropriate). For the SNARE cleavage assays cleavage of VAMP2 is depicted for serotype B1 and cleavage of SNAP‐25 is depicted for serotype C1. All correlations shown have 5 paired data points (A1 to F1 except D1, for which potency in in vivo assays was not determined). See Figures 1, 2, 3, 4 and Tables 1, 2, 3, 4, 5 for further details. DAS, Digit Abduction Score; DRG, dorsal root ganglion cell culture; PNHD, phrenic nerve hemidiaphragm
Serotype E appeared to be an outlier when the mouse PNHD was compared to the mouse DAS (Figure 4A) and, if this serotype was excluded from the analysis, a correlation was observed (r = 0.966, P = 0.034*, n = 4 XY pairs).
4. DISCUSSION
This study provides for the first time comprehensive profiles of the purified native, commercially available and research grade BoNT serotypes A1 to F1 in rodent in vitro, ex vivo, and in vivo assays.
Here, BoNT serotype A1, the most potent serotype in the clinic, was also the most potent serotype in all rodent assays tested here, except for the mouse DAS test in which serotype B1 appeared to be the most potent. The potency rankings of serotypes across the in vitro assays are in broad agreement with previously reported data in SCN (A>C~E>B; 26), DRG (A>C>F>B)15, and CTX (A∼C>E>B>F).27 The high potency of A in comparison to other serotypes has been also confirmed ex vivo and in vivo, such as when assessing A and B in the mouse PNHD,22, 28 A, B, and E in the mouse PNHD,29 A, B, C, and F in the mouse DAS,18 and serotypes A to F in the rat compound muscle action potential (CMAP)30. Interestingly, there are some exceptions to A being the most potent serotype in both mammalian and nonmammalian species.31, 32
BoNT serotype B, the only alternative to A used currently in the clinic, displays lower efficacy in humans due to a mutation in the synaptotagmin 2 receptor which results in its poor affinity at this receptor.33 Here, B1 was highly potent in mice both in the PNHD and in vivo models, consistent with previously reported data for this species in in vitro and ex vivo assays.34 In rats, B1 was the least potent serotype in vivo as well as in the SCN assay when evaluating VAMP1 cleavage, in agreement with reports of VAMP1 being relatively resistant to cleavage by serotype B35 and the role of VAMP1 at neuromuscular junctions.34 However, B1 was among the most potent toxins in the SCN assay when evaluating VAMP2 cleavage or neurotransmitter release, by ~35‐fold difference compared to VAMP1. Somewhat surprisingly, B1 was the least potent serotype in the CTX (VAMP2 cleavage and neurotransmitter release) and DRG (VAMP2 cleavage) assays. Inhibition of neurotransmitter release by serotype B in cellular assays has been reported to be driven by VAMP2 cleavage,35 matching our finding that for both SCN and CTX the potency exhibited by B in inhibiting release was correlated with the potency at cleaving VAMP2 (N.B. VAMP1 cleavage was not determined in CTX and DRG cultures). Further experiments are needed to clarify the roles of serotype B protein receptors and targets in rats.
BoNT serotypes C, E, and F have been used in humans in a small number of case studies.36 Serotype C has a temporal profile similar to that of A and shows a positive clinical outcome in patients.36 Here, serotype C1 was the second most potent serotype in DRG, only surpassed by A1. The high potency in the sensory model DRG could make C1 a potential starting point to develop a BoNT‐based therapeutic aimed at sensory conditions. However, in this study C1 was the most lethal serotype in the in vivo mouse assay. Neurotoxicity of serotype C1 has been linked to the ability to cleave two independent SNARE proteins, SNAP‐25 and syntaxin.37 Interestingly, cleavage activity and lethality of serotype C1 can be modulated using recombinant techniques. Cleavage of SNAP‐25 by serotype C1 has been linked to its lethality, whereas its cleavage of syntaxin would be responsible for its induced neuromuscular paralysis.38 Here, the potency of serotype C1 at cleaving SNAP‐25 and syntaxin was almost equivalent in SCN, CTX, and DRG confirming previous reports using rat hippocampal neurons.39 In this study, serotype C1 was the second most potent serotype in rat DAS, measuring muscle relaxation, only surpassed by A. This is well‐aligned with the activity of serotype C in the rat CMAP analysis in vivo.30 Also, serotype C was found as potent as A in the DAS test performed in Swiss Webster mice.18
In humans, BoNT serotypes E and F both are associated with a shorter duration of action when compared to A.36, 40 Therefore, we can speculate that these two serotypes might be useful in the clinic where a short blockade is required, for example, to immobilize damaged joints in pre and postoperative care. Serotype F1 was ~threefold more potent than B1 and E1 in the DRG sensory model, but it was the least potent serotype in SCN and CTX. F1 also showed moderate potency in mouse PNHD, mouse DAS, and rat DAS, suggesting it could be a potential serotype, with differentiating properties over A1, to favor sensory over motor conditions. In our study, serotype E1 was as potent as A1 in the mouse PNHD, as similarly reported by Rasetti‐Escargueil et al.29 In the mouse DAS test, serotypes E1 and F1 were among the least potent serotypes, while showing intermediate potency in the rat DAS test. The intermediate potency of E and F is also reported in a rat CMAP study.30
In our rat DAS study, no serotype had any effect on BW at the dose range tested. As effects on BW are thought to indicate systemic spread of neurotoxin into systemic circulation, we can conclude that in these studies all serotypes were well‐tolerated in the rat. A significant reduction in BW gain was seen with serotype B1 at only a single middle dose (6500 pg/animal), thus likely lacking biological significance. Unlike rats, CD‐1 mice showed BW loss for all serotypes at higher doses, indicative of toxin spread into the systemic circulation. The tolerability indexes (0% BW/ED50) in mice, following i.m. administration, were largest in serotypes B1 and A1, intermediate with F1 and C1, and smallest with E1. In contrast, in Swiss Webster mice safety margins expressed as ratios of LD50 values and ED50 values (both following i.m. administration) showed that serotype F had the largest safety margin and B the smallest.17 Thus, there are likely to be differences in BoNT tolerability across various mouse strains.
In this study, the activity of BoNT serotypes in the different assays did not correlate with one another, with the exception of the respective SNARE cleavage and neurotransmitter release for SCN and CTX, possibly hampered by the lower numbers of BoNTs tested. Interestingly, despite the potency correlation, BoNTs produced a maximal SNARE cleavage without this manifesting in complete abrogation of neurotransmitter release in all cases. For example, serotype A1 in CTX, and A1, B1, D1, and F1 in SCN, presented a residual neurotransmitter release of up to 25%. This contrasts with a previous study where complete paralysis in PNHD was achieved by cleaving 10%‐15% of SNAP‐25.41 In this study, all BoNTs did produce a maximal muscle paralysis in the PNHD assay at 10 pmol/L, with D1 showing low potency. The results for serotype D1 are in contrast to previous reports using recombinant or native BoNT/D.25, 42 The lower potency of serotype D1 found here by that study may be due to differences in purity (<50% purity in this study), toxin, toxin manufacture, or experimental conditions. All serotypes, with the exception of D1, resulted in maximal DAS values in mice and rats, indicative of muscle flaccidity. In mice, D1 serotype resulted in DAS values up to 2 were observed at the tolerated doses (up to 45 pg/mouse), followed by lethality (at 80 pg/mouse). This would indicate a greater spread to systemic circulation for this serotype, possibly driven by its mechanism of binding at the neuromuscular junction.
Serotype E1 showed a high potency in mouse PNHD and low potency in in vivo mouse DAS test. When E1 was excluded from the analysis, the mouse PNHD and in vivo mouse DAS data did correlate. Regarding the rat assays, the in vivo assessment and the in vitro models did not correlate.
The different assays presented here can have unique potential utility in the screening cascade of future BoNT therapeutics. While SCN and CTX represent spinal (source of neurons innervating the neuromuscular junction) and supraspinal neurons, respectively, rat DRG are a source of sensory neurons. However, the lack of correlation between the in vitro and in vivo bioassays seen here should be a note of warning on the general proposal of the use of cells in cultures as an alternative to experimental animals. The mPNHD and DAS tests represent an isolated and integrative model of the neuromuscular junction, respectively, whereas weight gain provides information on the systemic effect of the toxins. Therefore, the DAS test may be a more relevant physiological model for the neuromuscular effect of BoNTs, which is complex and integrative. Considering the respective serotypes, in all assays BoNT/A displayed the highest potency which agrees with clinical findings. Future more extensive clinical data on the different serotypes would allow for further analysis and elucidation of the potential utility of those models as translational assays.
When looking at the different serotypes the increased potency of serotypes C1 and F1 in the sensory DRG cultures compared to the rest of the assays, which are mainly indicative of function at the neuromuscular junction, may indicate a specificity of these serotypes for sensory neurons.
5. CONCLUSION
The native BoNT serotypes A1 to F1 are highly potent neurotoxins in rodent assays, except for serotype D1 in vivo in mice and rats. Rat models were found to be not suitable to study the potency of serotype B1.
Potency differences of BoNT serotypes in tissues and species can be exploited to develop unique novel BoNT‐based therapeutics. In particular, serotypes F1 and C1 could be the base of new botulinum products aimed at the somatosensory system.
AUTHOR CONTRIBUTIONS
Participated in research design: SD, CP, CF‐G, JK, and EF. Conducted experiments: SD, ME, BG, FH, AL, SM, CP, CF‐G, SC, and EF. Performed data analysis: SD, ME, BG, FH, AL, SM, CP, CF‐G, SC, MK, and EF. Performed data curation: SD, CF‐G, and EF. Wrote or contributed to the writing of the manuscript: SD, MK, and EF with input from all authors.
DISCLOSURE
None declared.
Supporting information
ACKNOWLEDGMENTS
We thank Shilpa Palan for her assistance with the supply and management of BoNT toxins. We thank Jean‐Luc Blachon for his assistance with the statistical analysis of the mPNHD assay. We thank Joseph Burgon for his assistance in the processing of the manuscript.
Donald S, Elliott M, Gray B, et al. A comparison of biological activity of commercially available purified native botulinum neurotoxin serotypes A1 to F1 in vitro, ex vivo, and in vivo. Pharmacol Res Perspect. 2018;e00446 10.1002/prp2.446
Funding information
This study was funded by Ipsen. All authors are Ipsen employees.
REFERENCES
- 1. Pirazzini M, Rossetto O, Eleopra R, Montecucco C. Botulinum neurotoxins: biology, pharmacology, and toxicology. Pharmacol Rev. 2017;69:200‐235. 10.1124/pr.116.012658. [DOI] [PMC free article] [PubMed] [Google Scholar]
- 2. Schiavo G, Matteoli M, Montecucco C. Neurotoxins affecting neuroexocytosis. Physiol Rev. 2000;80:717‐766. [DOI] [PubMed] [Google Scholar]
- 3. Peck MW, Smith TJ, Anniballi F, et al. Historical perspectives and guidelines for botulinum neurotoxin subtype nomenclature. Toxins. 2017;9:38 10.3390/toxins9010038. [DOI] [PMC free article] [PubMed] [Google Scholar]
- 4. Tehran DA, Pirazzini M. Novel botulinum neurotoxins: exploring underneath the iceberg tip. Toxins. 2018;10:190 10.3390/toxins10050190. [DOI] [PMC free article] [PubMed] [Google Scholar]
- 5. Rummel A. The long journey of botulinum neurotoxins into the synapse. Toxicon. 2015;107:9‐24. 10.1016/j.toxicon.2015.09.009. [DOI] [PubMed] [Google Scholar]
- 6. Terilli RR, Moura H, Woolfitt AR, Rees J, Schieltz DM, Barr JR. A historical and proteomic analysis of botulinum neurotoxin type/G. BMC Microbiol. 2011;11:232 10.1186/1471-2180-11-232. [DOI] [PMC free article] [PubMed] [Google Scholar]
- 7. Weir E. Botulism in Canada. CMAJ. 2001;164:538. [PMC free article] [PubMed] [Google Scholar]
- 8. Chen JJ, Dashtipour K. Abo‐, inco‐, ona‐, and rima‐botulinum toxins in clinical therapy: a primer. Pharmacotherapy. 2013;33:304‐318. 10.1002/phar.1196. [DOI] [PubMed] [Google Scholar]
- 9. Montal M. Botulinum neurotoxin: a marvel of protein design. Annu Rev Biochem. 2010;79:591‐617. 10.1146/annurev.biochem.051908.125345. [DOI] [PubMed] [Google Scholar]
- 10. Montecucco C. How do tetanus and botulinum toxins bind to neuronal membranes? Trends Biochem Sci. 1986;11:315‐317. [Google Scholar]
- 11. Fonfria E, Maignel J, Lezmi S, et al. The expanding therapeutic utility of botulinum neurotoxins. Toxins. 2018;10:208 10.3390/toxins10050208 [DOI] [PMC free article] [PubMed] [Google Scholar]
- 12. Fonfria E, Donald S, Cadd VA. Botulinum neurotoxin A and an engineered derivate targeted secretion inhibitor (TSI) A enter cells via different vesicular compartments. J Recept Signal Transduct Res. 2016;36:79‐88. 10.3109/10799893.2015.1049359. [DOI] [PubMed] [Google Scholar]
- 13. Keller JE, Neale EA, Oyler G, Adler M. Persistence of botulinum neurotoxin action in cultured spinal cord cells. FEBS Lett. 1999;456:137‐142. [DOI] [PubMed] [Google Scholar]
- 14. Sheridan RE, Smith TJ, Adler M. Primary cell culture for evaluation of botulinum neurotoxin antagonists. Toxicon. 2005;45:377‐382. 10.1016/j.toxicon.2004.11.009. [DOI] [PubMed] [Google Scholar]
- 15. Welch MJ, Purkiss JR, Foster KA. Sensitivity of embryonic rat dorsal root ganglia neurons to Clostridium botulinum neurotoxins. Toxicon. 2000;38:245‐258. [DOI] [PubMed] [Google Scholar]
- 16. Dolly JO, Lawrence GW. Chapter 3: Molecular basis for the therapeutic effectiveness of botulinum neurotoxin type A. Neurourol Urodyn. 2014;33 Suppl 3:S14‐S20. 10.1002/nau.22634 [DOI] [PubMed] [Google Scholar]
- 17. Aoki KR. A comparison of the safety margins of botulinum neurotoxin serotypes A, B, and F in mice. Toxicon. 2001;39:1815‐1820. [DOI] [PubMed] [Google Scholar]
- 18. Aoki KR. Preclinical update on BOTOX® (botulinum toxin type A)‐purified neurotoxin complex relative to other botulinum neurotoxin preparations. Eur J Neurol. 1999;6:S3‐S10. [Google Scholar]
- 19. Broide RS, Rubino J, Nicholson GS, et al. The rat Digit Abduction Score (DAS) assay: a physiological model for assessing botulinum neurotoxin‐induced skeletal muscle paralysis. Toxicon. 2013;71:18‐24. 10.1016/j.toxicon.2013.05.004. [DOI] [PubMed] [Google Scholar]
- 20. Cornet S, Perier C, Kalinichev M. Optimization of the digit abduction score test in the rat: Evaluation of sensitivity of the exterior digitorum longus, gastrocnemius and peroneus muscles to muscle‐flaccidity inducing effects of botulinum neurotoxin. In preparation.
- 21. Elliott M, Maignel J, Liu SM, et al. Augmentation of VAMP‐catalytic activity of botulinum neurotoxin serotype B does not result in increased potency in physiological systems. PLoS ONE. 2017;12:e0185628 10.1371/journal.pone.0185628. [DOI] [PMC free article] [PubMed] [Google Scholar]
- 22. Maignel‐Ludop J, Huchet M, Krupp J. Botulinum neurotoxins serotypes A and B induce paralysis of mouse striated and smooth muscles with different potencies. Pharmacol Res Perspect. 2017;5:e00289 10.1002/prp2.289. [DOI] [PMC free article] [PubMed] [Google Scholar]
- 23. Kilkenny C, Browne W, Cuthill IC, Emerson M, Altman DG; NC3Rs Reporting Guidelines Working Group. Animal research: reporting in vivo experiments: the ARRIVE guidelines. Br J Pharmacol 2010; 160, 1577‐1579. 10.1111/j.1476-5381.2010.00872.x [DOI] [PMC free article] [PubMed] [Google Scholar]
- 24. Curtis MJ, Bond RA, Spina D, et al. Experimental design and analysis and their reporting: new guidance for publication in BJP. Br J Pharmacol. 2015;172:3461‐3471. [DOI] [PMC free article] [PubMed] [Google Scholar]
- 25. Weisemann J, Krez N, Fiebig U, et al. Generation and characterization of six recombinant botulinum neurotoxins as reference material to serve in an international proficiency test. Toxins. 2015;7:5035‐5054. 10.3390/toxins7124861. [DOI] [PMC free article] [PubMed] [Google Scholar]
- 26. Whitemarsh RCM, Strathman MJ, Chase LG, et al. Novel application of human neurons derived from induced pluripotent stem cells for highly sensitive botulinum neurotoxin detection. Toxicol. Sci. Off. J. Soc. Toxicol. 2012;126:426‐435. 10.1093/toxsci/kfr354. [DOI] [PMC free article] [PubMed] [Google Scholar]
- 27. Foran PG, Mohammed N, Lisk GO, et al. Evaluation of the therapeutic usefulness of botulinum neurotoxin B, C1, E, and F compared with the long lasting type A. Basis for distinct durations of inhibition of exocytosis in central neurons. J Biol Chem. 2003;278:1363‐1371. 10.1074/jbc.M209821200. [DOI] [PubMed] [Google Scholar]
- 28. Wang J, Zurawski TH, Bodeker MO, et al. Longer‐acting and highly potent chimaeric inhibitors of excessive exocytosis created with domains from botulinum neurotoxin A and B. Biochem J. 2012;444:59‐67. 10.1042/BJ20120100. [DOI] [PubMed] [Google Scholar]
- 29. Rasetti‐Escargueil C, Jones RGA, Liu Y, Sesardic D. Measurement of botulinum types A, B and E neurotoxicity using the phrenic nerve‐hemidiaphragm: improved precision with in‐bred mice. Toxicon. 2009;53:503‐511. 10.1016/j.toxicon.2009.01.019. [DOI] [PubMed] [Google Scholar]
- 30. Torii Y, Goto Y, Takahashi M, et al. Quantitative determination of biological activity of botulinum toxins utilizing compound muscle action potentials (CMAP), and comparison of neuromuscular transmission blockage and muscle flaccidity among toxins. Toxicon. 2010;55:407‐414. 10.1016/j.toxicon.2009.09.005. [DOI] [PubMed] [Google Scholar]
- 31. Chatla K, Gaunt PS, Petrie‐Hanson L, Ford L, Hanson LA. Zebrafish sensitivity to botulinum neurotoxins. Toxins. 2016;8:132 10.3390/toxins8050132 [DOI] [PMC free article] [PubMed] [Google Scholar]
- 32. Liu Z‐J, Rafferty KL, Ye W, Herring SW. Differential response of pig masseter to botulinum neurotoxin serotypes A and B. Muscle Nerve. 2015;52:88‐93. 10.1002/mus.24492. [DOI] [PMC free article] [PubMed] [Google Scholar]
- 33. Tao L, Peng L, Berntsson RP‐A, et al. Engineered botulinum neurotoxin b with improved efficacy for targeting human receptors. Nat Commun. 2017;2017(8):53. in press. [DOI] [PMC free article] [PubMed] [Google Scholar]
- 34. Peng L, Adler M, Demogines A, et al. Widespread sequence variations in VAMP1 across vertebrates suggest a potential selective pressure from botulinum neurotoxins. PLoS Pathog. 2014;10:e1004177 10.1371/journal.ppat.1004177. [DOI] [PMC free article] [PubMed] [Google Scholar]
- 35. Schiavo G, Benfenati F, Poulain B, et al. Tetanus and botulinum‐B neurotoxins block neurotransmitter release by proteolytic cleavage of synaptobrevin. Nature. 1992;359:832‐835. 10.1038/359832a0. [DOI] [PubMed] [Google Scholar]
- 36. Eleopra R, Tugnoli V, Quatrale R, Rossetto O, Montecucco C, Dressler D. Clinical use of non‐A botulinum toxins: botulinum toxin type C and botulinum toxin type F. Neurotox Res. 2006;9:127‐131. [DOI] [PubMed] [Google Scholar]
- 37. Peng L, Liu H, Ruan H, et al. Cytotoxicity of botulinum neurotoxins reveals a direct role of syntaxin 1 and SNAP‐25 in neuron survival. Nat Commun. 2013;4:1472 10.1038/ncomms2462. [DOI] [PMC free article] [PubMed] [Google Scholar]
- 38. Zanetti G, Sikorra S, Rummel A, et al. Botulinum neurotoxin C mutants reveal different effects of syntaxin or SNAP‐25 proteolysis on neuromuscular transmission. PLoS Pathog. 2017;13:e1006567 10.1371/journal.ppat.1006567. [DOI] [PMC free article] [PubMed] [Google Scholar]
- 39. Tsukamoto K, Arimitsu H, Ochi S, et al. P19 embryonal carcinoma cells exhibit high sensitivity to botulinum type C and D/C mosaic neurotoxins. Microbiol Immunol. 2012;56:664‐672. 10.1111/j.1348-0421.2012.00490.x. [DOI] [PubMed] [Google Scholar]
- 40. Eleopra R, Tugnoli V, Rossetto O, De Grandis D, Montecucco C. Different time courses of recovery after poisoning with botulinum neurotoxin serotypes A and E in humans. Neurosci Lett. 1998;256:135‐138. [DOI] [PubMed] [Google Scholar]
- 41. Kalandakanond S, Coffield JA. Cleavage of SNAP‐25 by botulinum toxin type A requires receptor‐mediated endocytosis, pH‐dependent translocation, and zinc. J Pharmacol Exp Ther. 2001;296:980‐986. [PubMed] [Google Scholar]
- 42. Eleopra R, Montecucco C, Devigili G, et al. Botulinum neurotoxin serotype D is poorly effective in humans: an in vivo electrophysiological study. Clin Neurophysiol. 2013;124:999‐1004. [DOI] [PubMed] [Google Scholar]
Associated Data
This section collects any data citations, data availability statements, or supplementary materials included in this article.
Supplementary Materials