Figure 5.
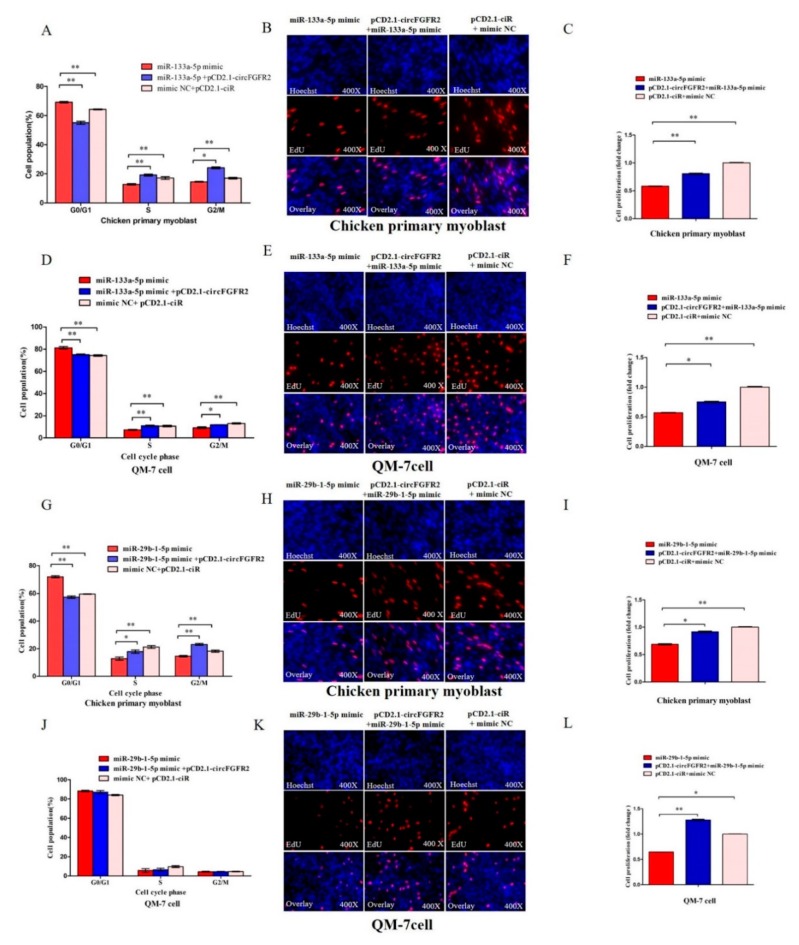
CircFGFR2 eliminates the inhibition effect of miR-133a-5p and miR-29b-1-5p on myoblast proliferation. (A) Cell cycle analysis of chicken primary myoblasts after co-transfection with the listed nucleic acids (miR-133a-5p, circFGFR2 overexpression vector and miR-133a-5p, empty overexpression vector and mimic NC, respectively) for 36 h. (B,C) EdU assays of chicken primary myoblasts after co-transfection with the listed nucleic acids (miR-133a-5p, circFGFR2 overexpression vector and miR-133a-5p, empty overexpression vector and mimic NC, respectively) for 36 h. (D) Cell cycle analysis of QM-7 cells after co-transfection with the listed nucleic acids (miR-133a-5p, circFGFR2 overexpression vector and miR-133a-5p, empty overexpression vector and mimic NC, respectively) for 48 h. (E,F) EdU assays of QM-7 cells after co-transfection with the listed nucleic acids (miR-133a-5p, circFGFR2 overexpression vector and miR-133a-5p, empty overexpression vector and mimic NC, respectively) for 48 h. (G) Cell cycle analysis of chicken primary myoblasts after co-transfection with the listed nucleic acids (miR-29b-1-5p, circFGFR2 overexpression vector and miR-29b-1-5p, empty overexpression vector and mimic NC, respectively) for 36 h. (H,I) EdU assays of chicken primary myoblasts after co-transfection with the listed nucleic acids (miR-29b-1-5p, circFGFR2 overexpression vector and miR-29b-1-5p, empty overexpression vector and mimic NC, respectively) for 36 h. (J) Cell cycle analysis of QM-7 cells after co-transfection with the listed nucleic acids (miR-29b-1-5p, circFGFR2 overexpression vector and miR-29b-1-5p, empty overexpression vector and mimic NC, respectively) for 48 h. (K,L) EdU assays of QM-7 cells after co-transfection with the listed nucleic acids (miR-29b-1-5p, circFGFR2 overexpression vector and miR-29b-1-5p, empty overexpression vector and mimic NC, respectively) for 48 h. In all panels, results are expressed as the mean ± S.E.M. of three independent experiments. For two group comparison analysis, statistical significance of differences between means was analyzed by unpaired Student’s t-test. For multiple comparison analysis, data were analyzed by one-way ANOVA followed by both least significant difference (LSD) and Duncan test through SPSS software. We considered p < 0.05 to be statistically significant. * p < 0.05; ** p < 0.01. NC, negative control.

