

Abstract
Purpose
Desmoplastic stroma is a cardinal feature of primary pancreatic ductal adenocarcinoma (PDA), but its effects on the biology, prognosis, and therapeutic outcomes in the disease are not known. We developed an automated method to assess tumor stroma density (TSD) and investigated computed tomography (CT) correlates of stroma in PDA.
Patients and Methods
We collected PDA samples from rapid autopsy and resection series and digitally annotated samples to quantify TSD. A series of patients who had undergone resection also underwent preoperative multiphasic CT imaging.
Results
Automated and manual assessments of TSD were highly correlated (ρ = 0.65; P < .001). Solid organ metastases had a lower median TSD than primary tumors (P < .001). Patients whose tumors had high TSD had prolonged recurrence-free survival (hazard ratio [HR] = 0.51; P = .003) and overall survival (HR = 0.57; P = .008). In another independent dataset, patients whose tumors had high TSD had decreased risk for recurrence (HR = 0.03; P = .003) and death (HR = 0.03; P = .003) at time of resection; however, the protective effect of high TSD diminished over time. Patients with a normalized portovenous phase CT tumor enhancement ratio ≥ 0.40 had a longer time to recurrence after resection (P = .020). Normalized portovenous phase CT tumor enhancement ratio was significantly correlated with TSD (P = .003).
Conclusion
Objective quantitative assessment of stroma in PDA revealed several clinically relevant observations. Stroma was less abundant in metastatic PDA, the primary cause of mortality associated with PDA. High stromal content correlated with favorable outcome in patients with resected tumors, implying a protective effect of stroma and suggesting careful consideration of active stromal depletion therapies. Standard, multiphase CT imaging correlated with stroma content and clinical outcome, indicating that noninvasive assessment of stroma is a feasible sensitivity enrichment approach in PDA.
INTRODUCTION
Primary pancreatic ductal adenocarcinoma (PDA) tumors are composed of malignant epithelial cells infiltrating and surrounded by an abundant desmoplastic stroma (DS) that, in turn, typically composes most of the tumor volume.1 DS is a diverse matrix comprising many cell types (eg, fibroblasts, pancreatic stellate cells, immune cells, blood vessels) and extracellular matrix proteins such as collagen and hyaluronic acid.2 Tumor epithelium and DS interact in important ways and mediate tumor growth, immune surveillance, metabolism, and, possibly, metastasis.3-6
The interest in therapeutically targeting DS in PDA is increasing because of its purported role in impeding drug delivery and excluding immune cells from the tumor microenvironment.7-10 Clinical trials targeting DS, however, have been disappointing, and more recent studies have found that reducing DS burden through various stroma-depletion strategies in mouse models can lead to more aggressive tumors.11-13 This underscores the complex role DS plays in PDA and highlights the need for additional studies.
Quantification of DS is frequently subjective and inherently challenging for multi-institutional studies. To overcome this, we developed a computerized method to quantify tumor stroma density (TSD) in histologic PDA specimens. We applied this method to investigate the relationship between primary tumors and metastases in a cohort of patients with metastatic disease, and the relationship between TSD of primary tumors and survival in two cohorts of patients who had undergone tumor resection.
Another significant hurdle in the assessment of DS is the lack of noninvasive biomarkers that can inform us of the qualitative and quantitative aspects of the DS. Such noninvasive biomarkers may guide the selection of antistromal therapies in patients with metastatic disease and assess response to therapy. On multiphase computed tomography (CT), when compared with normal pancreatic parenchyma, PDA tumors commonly enhance less but show gradual contrast enhancement at delayed time points. This enhancement pattern has been attributed to the presence of DS.14-16 In this study, we examined the association between primary PDA CT enhancement, TSD, and survival in a cohort of patients with resected PDA tumors.
PATIENTS AND METHODS
Subjects
Rapid autopsy cohort
Pancreatic tumors and metastases were obtained from decedents through the Rapid Autopsy Program at the University of Nebraska, as previously described.17 Metastatic sites included lymph nodes, lung, liver, and omentum. Tissue microarrays were created from paraffin blocks of formalin-fixed tissue in duplicate or triplicate.
Denmark cohort
Representative whole-tissue sections were obtained from de-identified patients undergoing pancreaticoduodenectomy for PDA in Denmark from 1978 to 2008. The study was approved by a regional ethics committee (reference no. KA-20060181) and has been previously described.18,19
University of California, San Francisco, cohort
The University of California, San Francisco (UCSF), institutional pathology and imaging databases were queried to identify patients with PDA who met the following inclusion and exclusion criteria: had undergone curative intent resection with pathology confirmation of PDA, had standard preoperative, multiphase pancreatic protocol staging CT imaging within 60 days of surgery, did not have any neoadjuvant therapies, and had records of ≥ 12 months of imaging and clinical follow-up available for review.
Automated Stroma Quantification
For the Rapid Autopsy cohort, tissue microarrays were used; for the Denmark and UCSF cohorts, whole-tissue sections were used. All slides were stained with hematoxylin and eosin, loaded to eSlide Manager and visualized with ImageScope 12.2 (Leica Biosystems, Wetzlar, Germany). Slides were annotated to indicate location and shape of the tumor. Using Definiens Architect XD 2.4 and Tissue Studio 4.1 (both Definiens, Munich, Germany), the annotated images were segmented into different regions of interest (ROIs): tumor epithelium, tumor desmoplasia, and glass. The program then calculated the total area of each ROI. For each specimen, tumor stroma density (TSD) was calculated as follows:
TSD = Tumor Desmoplasia Area/Total Tumor Area
CT Image Acquisition and Analysis
Standard, multiphase CT imaging was performed for staging purposes before surgery for all patients in the UCSF cohort. All CT scans were acquired on 16- or 64-slice CT scanners (General Electric, Boston, MA). A nonenhanced CT image was acquired first. After intravenous injection of 120 mL of Omnipaque 350 CT contrast material (GE Healthcare, Chicago, IL) at a rate of 5 mL/second, a pancreatic parenchymal (PP) phase CT image and then a portovenous (PV) phase CT image were acquired. The average time delay was 45 seconds for the PP phase and 90 seconds for the PV phase. The slice thickness of the images ranged from 1.25 to 2.5 mm.
CT images were reviewed on a picture archiving and communication system (Agfa Healthcare, Greenville, SC) by one author who was blinded to the pathology and clinical information. For each patient, circular ROIs were drawn on the PDA (avoiding obvious necrosis) and the aorta at the same level on all three phases (ie, nonenhanced, PP, and PV phase) and the attenuation values (in Hounsfield units [HU]) were recorded. For each patient, the following normalized tumor enhancement ratios were calculated:
1)PP phase = (HUtumor, PP – HUtumor, NE)/(HUaorta, PP - HUaorta, NE)
2)PV phase = (HUtumor, PV – HUtumor, NE)/(HUaorta, PV - HUaorta, NE).
Statistical Analysis
A mixed-effects linear regression model with fixed effects pertaining to metastatic site and random intercept with respect to patient of origin, using the likelihood ratio test to assess significance, was used to compare TSD across metastatic sites. Median TSD in the Denmark cohort (0.60) was used to stratify high (> 0.60) versus low TSD (≤ 0.60). Overall survival (OS) and recurrence-free survival (RFS) were compared in high versus low TSD groups using a Cox proportional hazards model controlling for overall histologic tumor area, tumor differentiation, stage, American Society of Anesthesiologists classification, and smoking status. The likelihood ratio test was used to assess the relevance of variables relative to the reduced model with that variable removed.
For the UCSF cohort, Cox proportional hazards model as well as Cox model with time-varying coefficients were used to analyze the RFS and OS when stratified by high versus low TSD using the same threshold value as the Denmark cohort, controlling for clinical and tumor pathology variables. For the tumor CT enhancement analysis of the UCSF cohort, the tumors were categorized as high versus low enhancement ratios using the median value, and a Cox proportional hazards model was used to analyze the RFS and OS controlling for clinical and tumor pathology variables.
RESULTS
Correlation of Automated and Manual Quantification of TSD
Automated quantification of TSD was optimized using whole-tissue sections of primary PDA tumors. Figures 1A and 1B demonstrate optimized tumor segmentation into tumor epithelium and two distinguishable stromal features that allowed for quantification of TSD. Automated TSD was compared with manually quantified TSD and reviewed by a board-certified pathologist (K.E.V.), blinded to clinical and pathologic data, in a set of 77 resected PDA samples. We found good correlation between automated and manual TSD quantification (ρ = 0.65; P < .001; Fig 1C), suggesting that automated assessment of TSD may be a reliable method to estimate TSD in a high-throughput and unbiased manner.
Fig 1.

Automated quantification of pancreatic adenocarcinoma (PDA) tumor stroma density at primary and metastatic sites. (A) Resected PDA specimen with hematoxylin and eosin staining (magnification, ×10). (B) Automated segmentation of tumor epithelium (green) and tumor stroma: fibrosis-high stroma (yellow) and fibrosis-low stroma (pink) (magnification, ×10). (C) Tumor stroma density (TSD) was manually quantified on a subset of 77 specimens that also underwent automated TSD quantification with good correlation (ρ = 0.65; P < .001). (D) Distribution of metastatic samples: primary tumors (n = 12), lymph node metastasis (n = 6), omental metastasis (n = 18), and solid organ (liver, n = 11; lung, n = 6). (E) Box-and-whisker plot of TSD across primary and metastatic organ sites; omental metastases had the highest TSD (median, 0.85; range, 0.20 to 0.99), followed by primary tumors (median, 0.74; range, 0.50 to 0.97), lymph node (median, 0.61; range, 0.16 to 0.87), and solid-organ metastases (median, 0.51; range, 0.13 to 0.73). *P < .001. In paired analysis comparing TSD in primary tumors versus metastatic sites, primary tumors showed a significantly higher TSD compared with solid-organ metastases (**P < .001).
TSD Variation Across Metastatic Sites
We performed automated TSD quantification on 118 tissue sections obtained from six patients who underwent rapid autopsy. Primary tumors (n = 12 samples), lymph node metastasis (n = 6), omental metastasis (n = 18), and solid organ (ie, liver and lung) metastasis (n = 17) were represented (Fig 1D). Median TSD was 0.62 across all organ sites. After controlling for variations in TSD intrinsic to each patient of origin for each sample, significant differences in TSD were observed as a function of site (P < .001). Omental metastases had the highest TSD (median, 0.85; range, 0.20 to 0.99), followed by primary tumors (median, 0.74; range, 0.50 to 0.97), lymph node (median, 0.61; range, 0.16 to 0.87), and solid-organ metastases (median, 0.51; range, 0.13 to 0.73; Fig 1E). In paired analysis, primary tumors had a significantly higher TSD compared with solid-organ metastases (P < .001) and lymph node metastases (P = .021). These results suggest that PDA stroma is not uniformly abundant across metastatic sites and is least abundant in solid organ metastases.
High TSD Was a Favorable Prognostic Factor in Resectable PDA Tumors
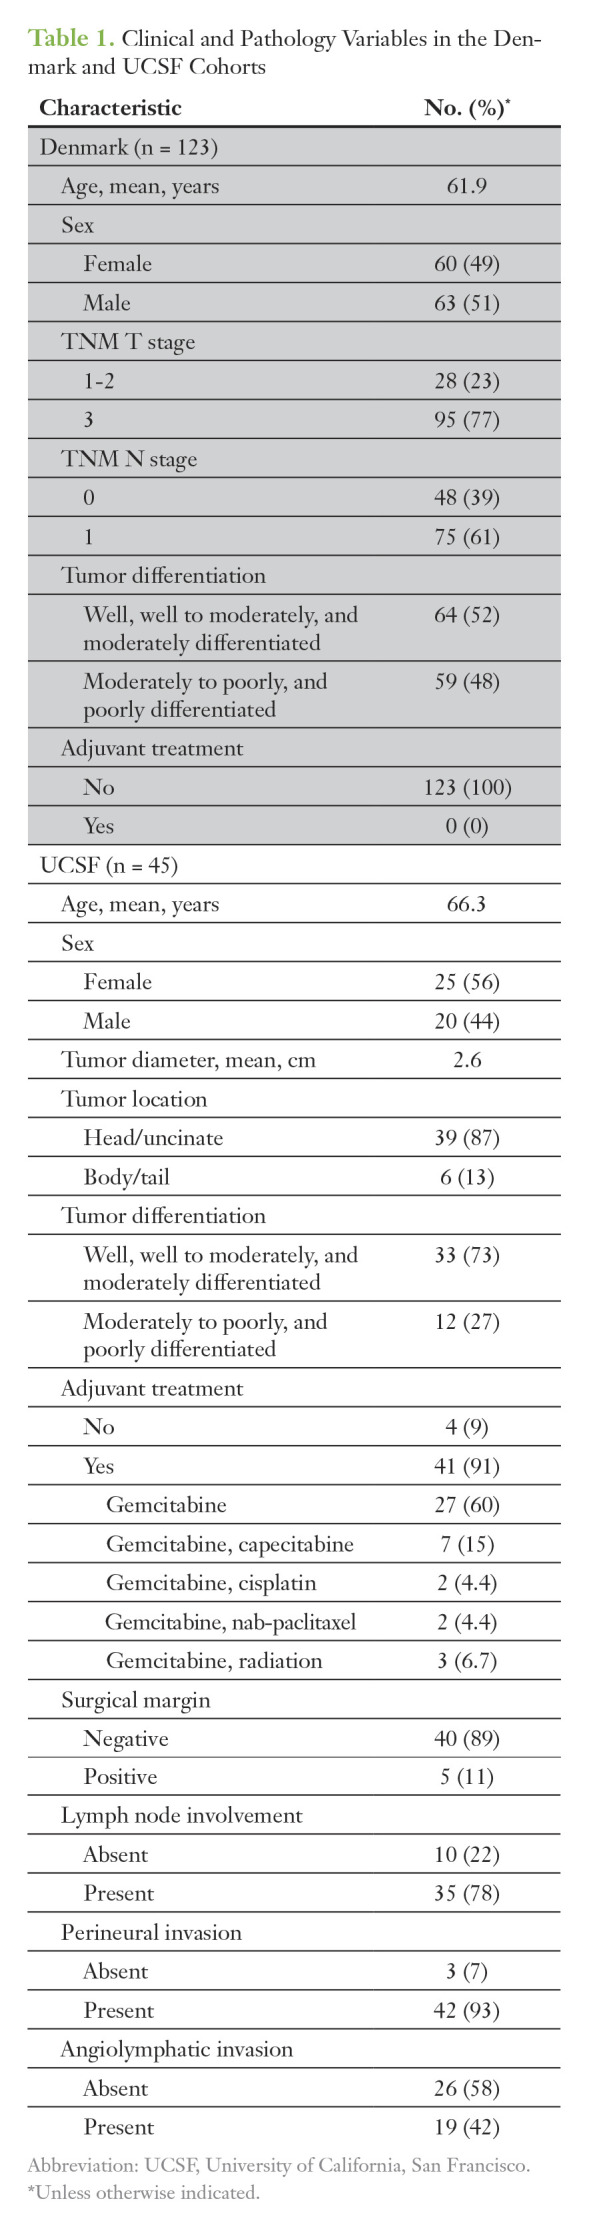
Automated TSD quantification was performed on samples from 123 patients with available tissue from Copenhagen, Denmark.20 This included 63 men and 60 women, whose mean age was 62 years at the time of surgery (range, 33 to 87 years). Median follow-up was 15.3 months (range, 0.4 to 296 months). Table 1 lists the clinical and pathology variables for this cohort. No patients in this cohort were treated with adjuvant or neoadjuvant therapy, per the standard of care in Europe during the collection period.
Table 1.
Clinical and Pathology Variables in the Denmark and UCSF Cohorts
The median TSD of this cohort was 0.60 (range, 0.09 to 0.95) and this median value was used to dichotomize high versus low TSD. Patients with a high TSD (> 0.60) had a median RFS of 21.1 months versus 10.0 months in patients with a low TSD (≤ 0.60), which was significant in a multivariate model controlling for tumor area, tumor differentiation, stage, American Society of Anesthesiologists classification, and smoking status (HR = 0.51; P = .008). Patients with high TSD also had a longer median OS of 21.3 months versus 11.7 months in patients with a low TSD, which was also significant in a multivariate analysis (HR = 0.57; P = 0.003; Fig 2A and 2B). These findings suggest that high TSD is associated with improved RFS and OS in patients with resected PDA tumors.
Fig 2.
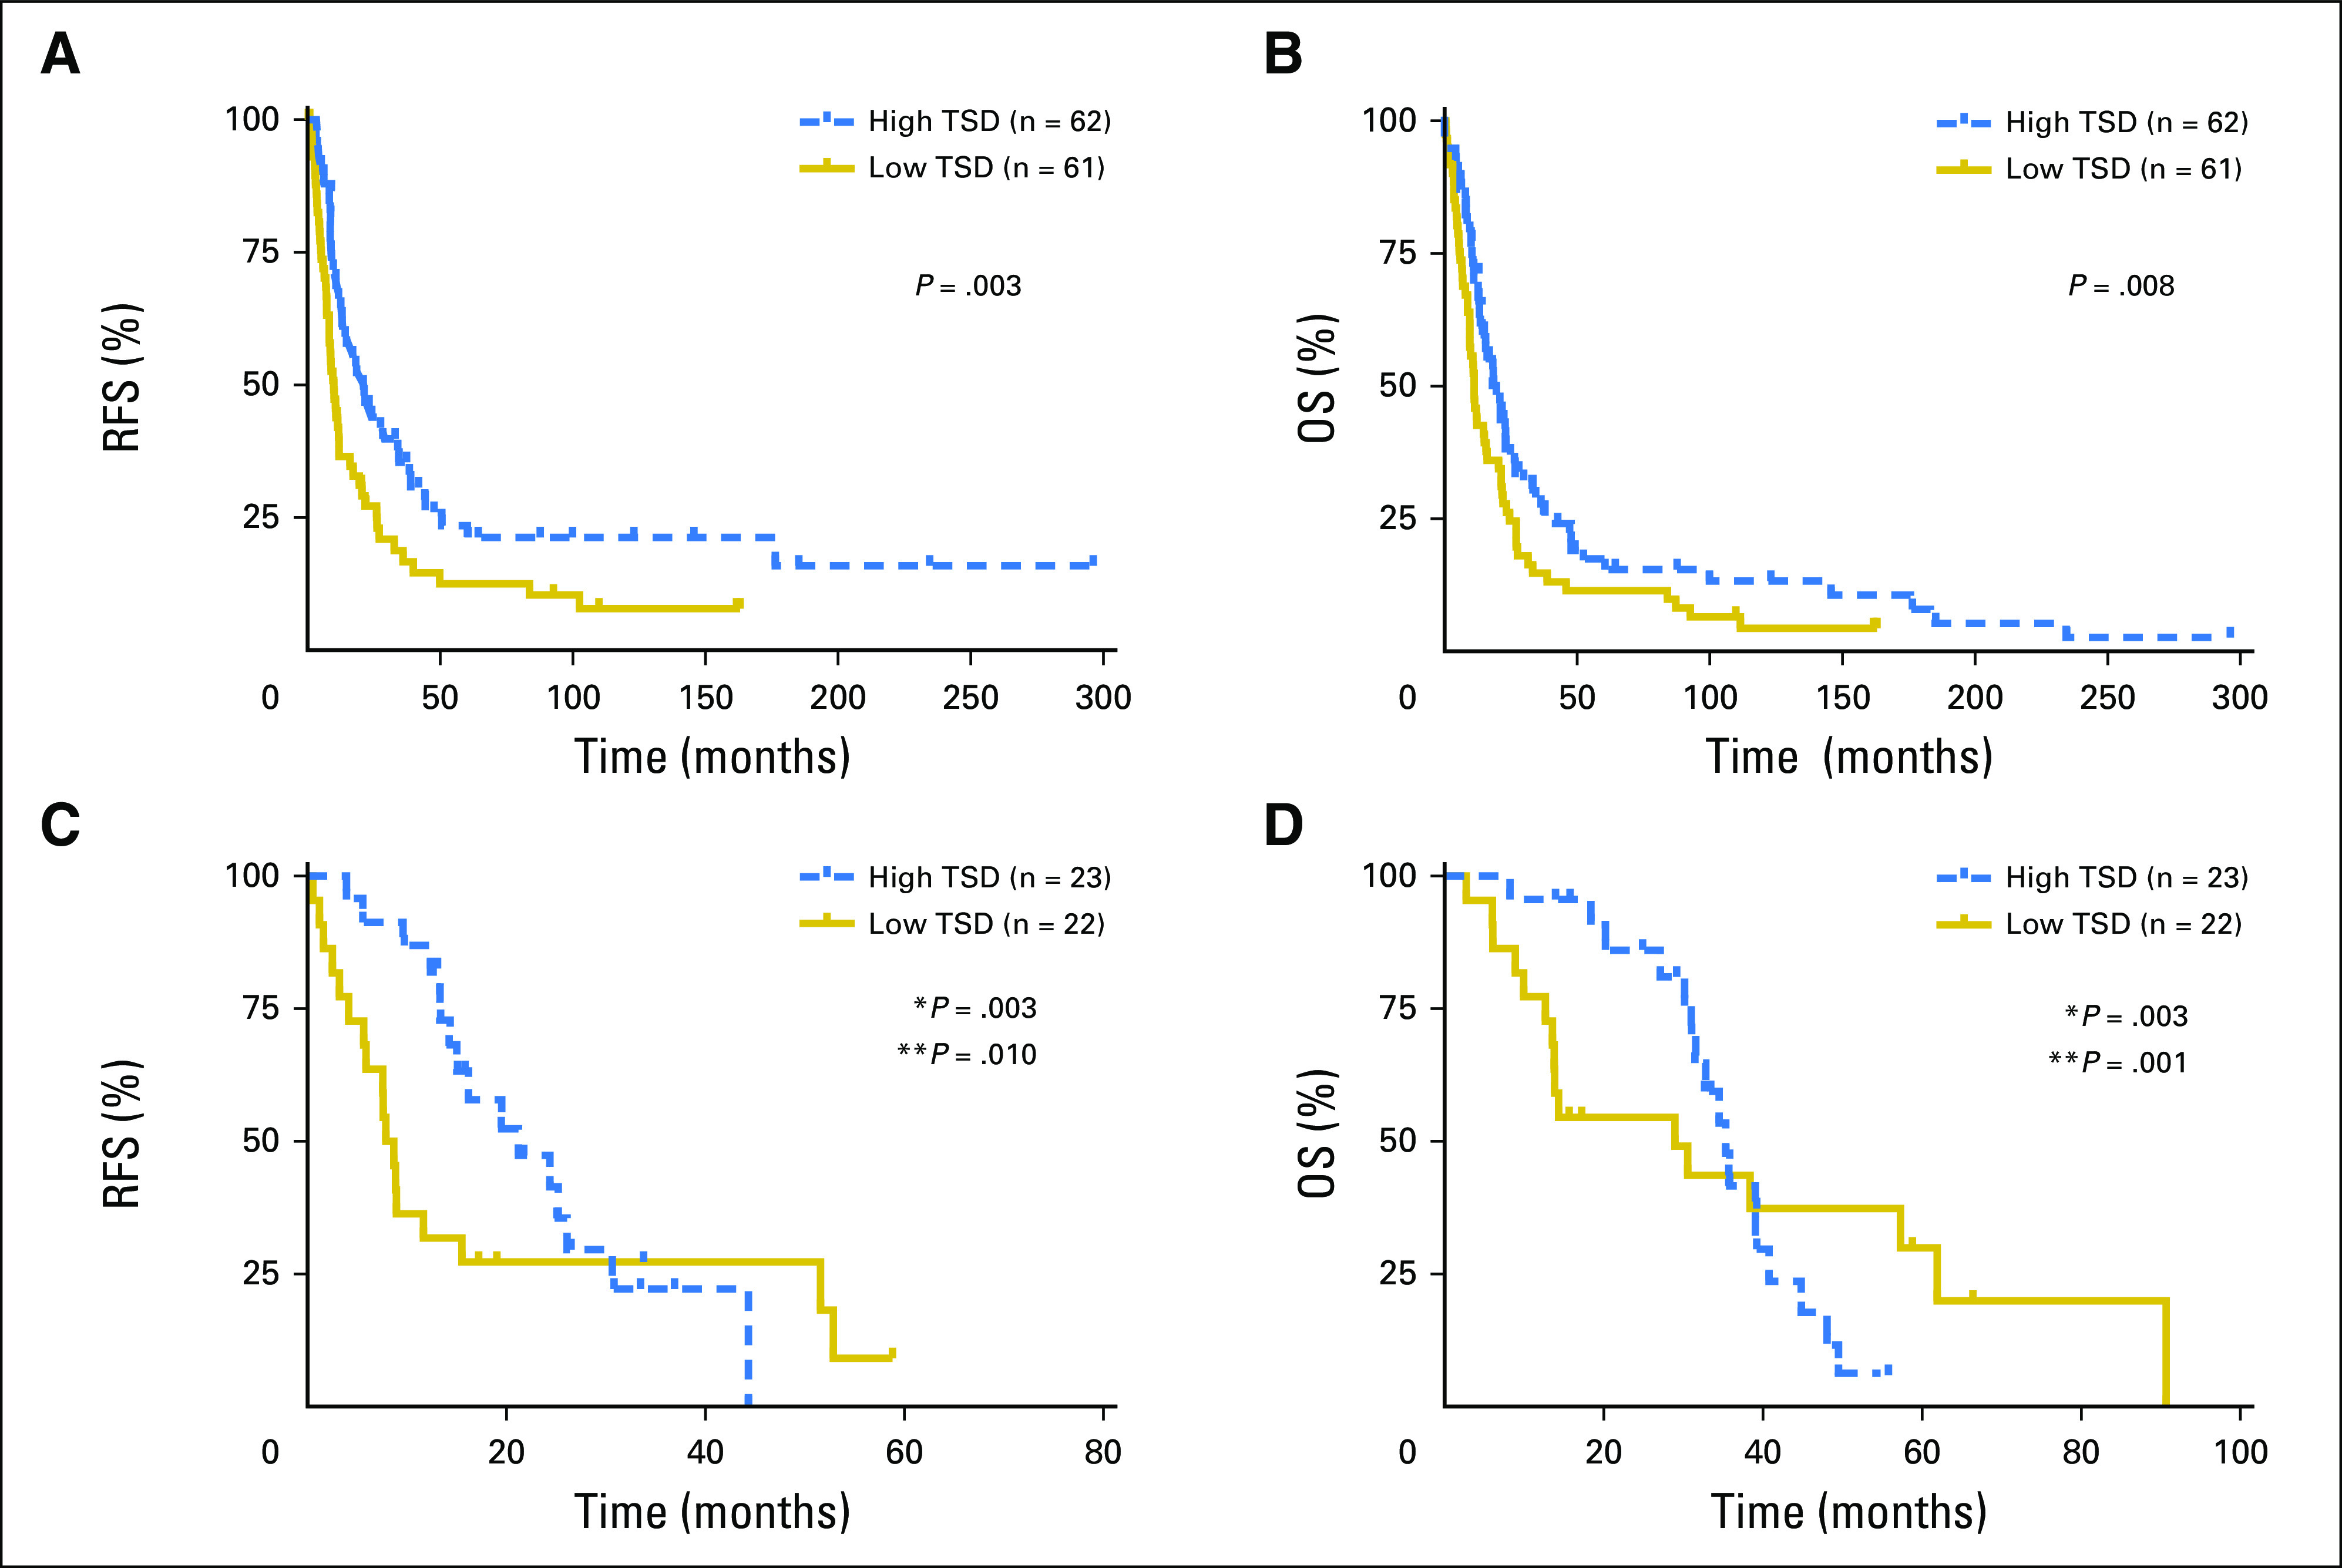
Recurrence-free survival (RFS) and overall survival (OS) stratified by tumor stromal density (TSD) in two independent cohorts. (A, B) Kaplan-Meier curves of (A) RFS and (B) OS for high versus low TSD in resected pancreatic adenocarcinoma (PDA) specimens from the Denmark patient cohort. Patients with a high versus low TSD had a median RFS of 21.1 versus 10.0 months (P = .003), and a median OS of 21.3 versus 11.7 months (P = .08). (C, D) Kaplan-Meier curves of RFS and OS for high versus low TSD in resected PDA specimens from the University of California, San Francisco, patient cohort. Patients with high TSD (> 0.6) had a median RFS of 14.6 months versus 8.7 months in those with low TSD (≤ 0.6). Patients with high TSD had median OS of 30.8 months versus 17.2 months in those with low TSD. TSD showed significant time-varying effects using a Cox model with time-varying coefficients. Patients with high TSD had a 97% reduction in risk of recurrence compared with those with low TSD at time zero (HR = 0.03 for high TSD; P = .003). However, the risk of recurrence increased over time (0.9% each day) in patients with high TSD (time-varying effect HR = 1.009 for high TSD; P = .010). Similarly, at time zero, patients with high TSD had a 97% reduction in risk of death compared with those with low TSD (time zero HR = 0.03 for high TSD; P = .003). The risk of death, however, increased over time (by 0.5% each day) in patients with high TSD (time-varying effect HR = 1.005 for high TSD; P = .001). *P = time zero; **P = time-varying effect..
To validate these prognostic findings, we analyzed 45 patients from an independent cohort who underwent curative-intent operations after preoperative CT staging and who did not receive neoadjuvant therapy but were treated with adjuvant chemotherapy when appropriate and/or feasible. This cohort included 20 men and 25 women undergoing resection at UCSF (mean age, of 66.3 years [range, 46 to 81 years]; Table 1). These patients had at least 12 months of follow-up, with a median follow-up of 29.2 months (range, 12.7 to 90.7 months).
The median TSD in this cohort was again 0.60 (range, 0.20 to 94). There was no difference in TSD between the Denmark and UCSF cohorts (P = .684). We analyzed TSD in these samples using the automated methods with identical settings and thresholds. Patients with high TSD (> 0.6) had a RFS of 14.6 months versus 8.7 months in those with low TSD (≤ 0.6; Fig 2C). Patients with high TSD had median OS of 30.8 months versus 17.2 months in those with low TSD (Fig 2D). Cox proportional hazards models did not show significant differences for RFS and OS when stratified by high versus low TSD (RFS, HR = 0.61, P = .160; OS, HR = 0.11, P = .121). However, TSD showed significant time-varying effects. Patients with high TSD had a 97% reduction in risk of recurrence compared with those with low TSD at time zero (HR = 0.03; P = .003). However, this risk increased over time (0.9% each day) in patients with high TSD (time-varying effect, HR = 1.009; P = .010). Similarly, at time zero, patients with high TSD had a 97% reduction in risk of death compared with those with low TSD (HR = 0.03; P = .003). The risk of death increased over time (0.5% each day) in patients with high TSD (time-varying effect, HR = 1.005; P = .001). These results suggest that patients in the UCSF cohort with high TSD had improved prognosis early on, but its protective effect diminished over time.
Preoperative CT Enhancement Patterns in Patients With Resectable PDA Tumors
CT scanning of patients with PDA classically demonstrates delayed enhancement after contrast administration.21 This pattern has been attributed to the presence of the abundant stroma.16 Therefore, we investigated the association of CT enhancement in primary (resected) PDA and TSD, as well as the association between CT enhancement and survival in the UCSF cohort. The mean time between the preoperative CT and surgery was 19 days (range, 2 to 45 days). The median normalized tumor enhancement ratio was 0.16 (range, 0.01 to 0.56) during the PP phase, and 0.40 (range, 0.12 to 0.82) during the PV phase. For each phase of enhancement, the tumors were classified as having either low or high enhancement ratios, using the median values as a threshold. Figures 3A and 3B show representative tumors classified as having high or low normalized enhancement ratio at the PP and PV phases, respectively.
Fig 3.
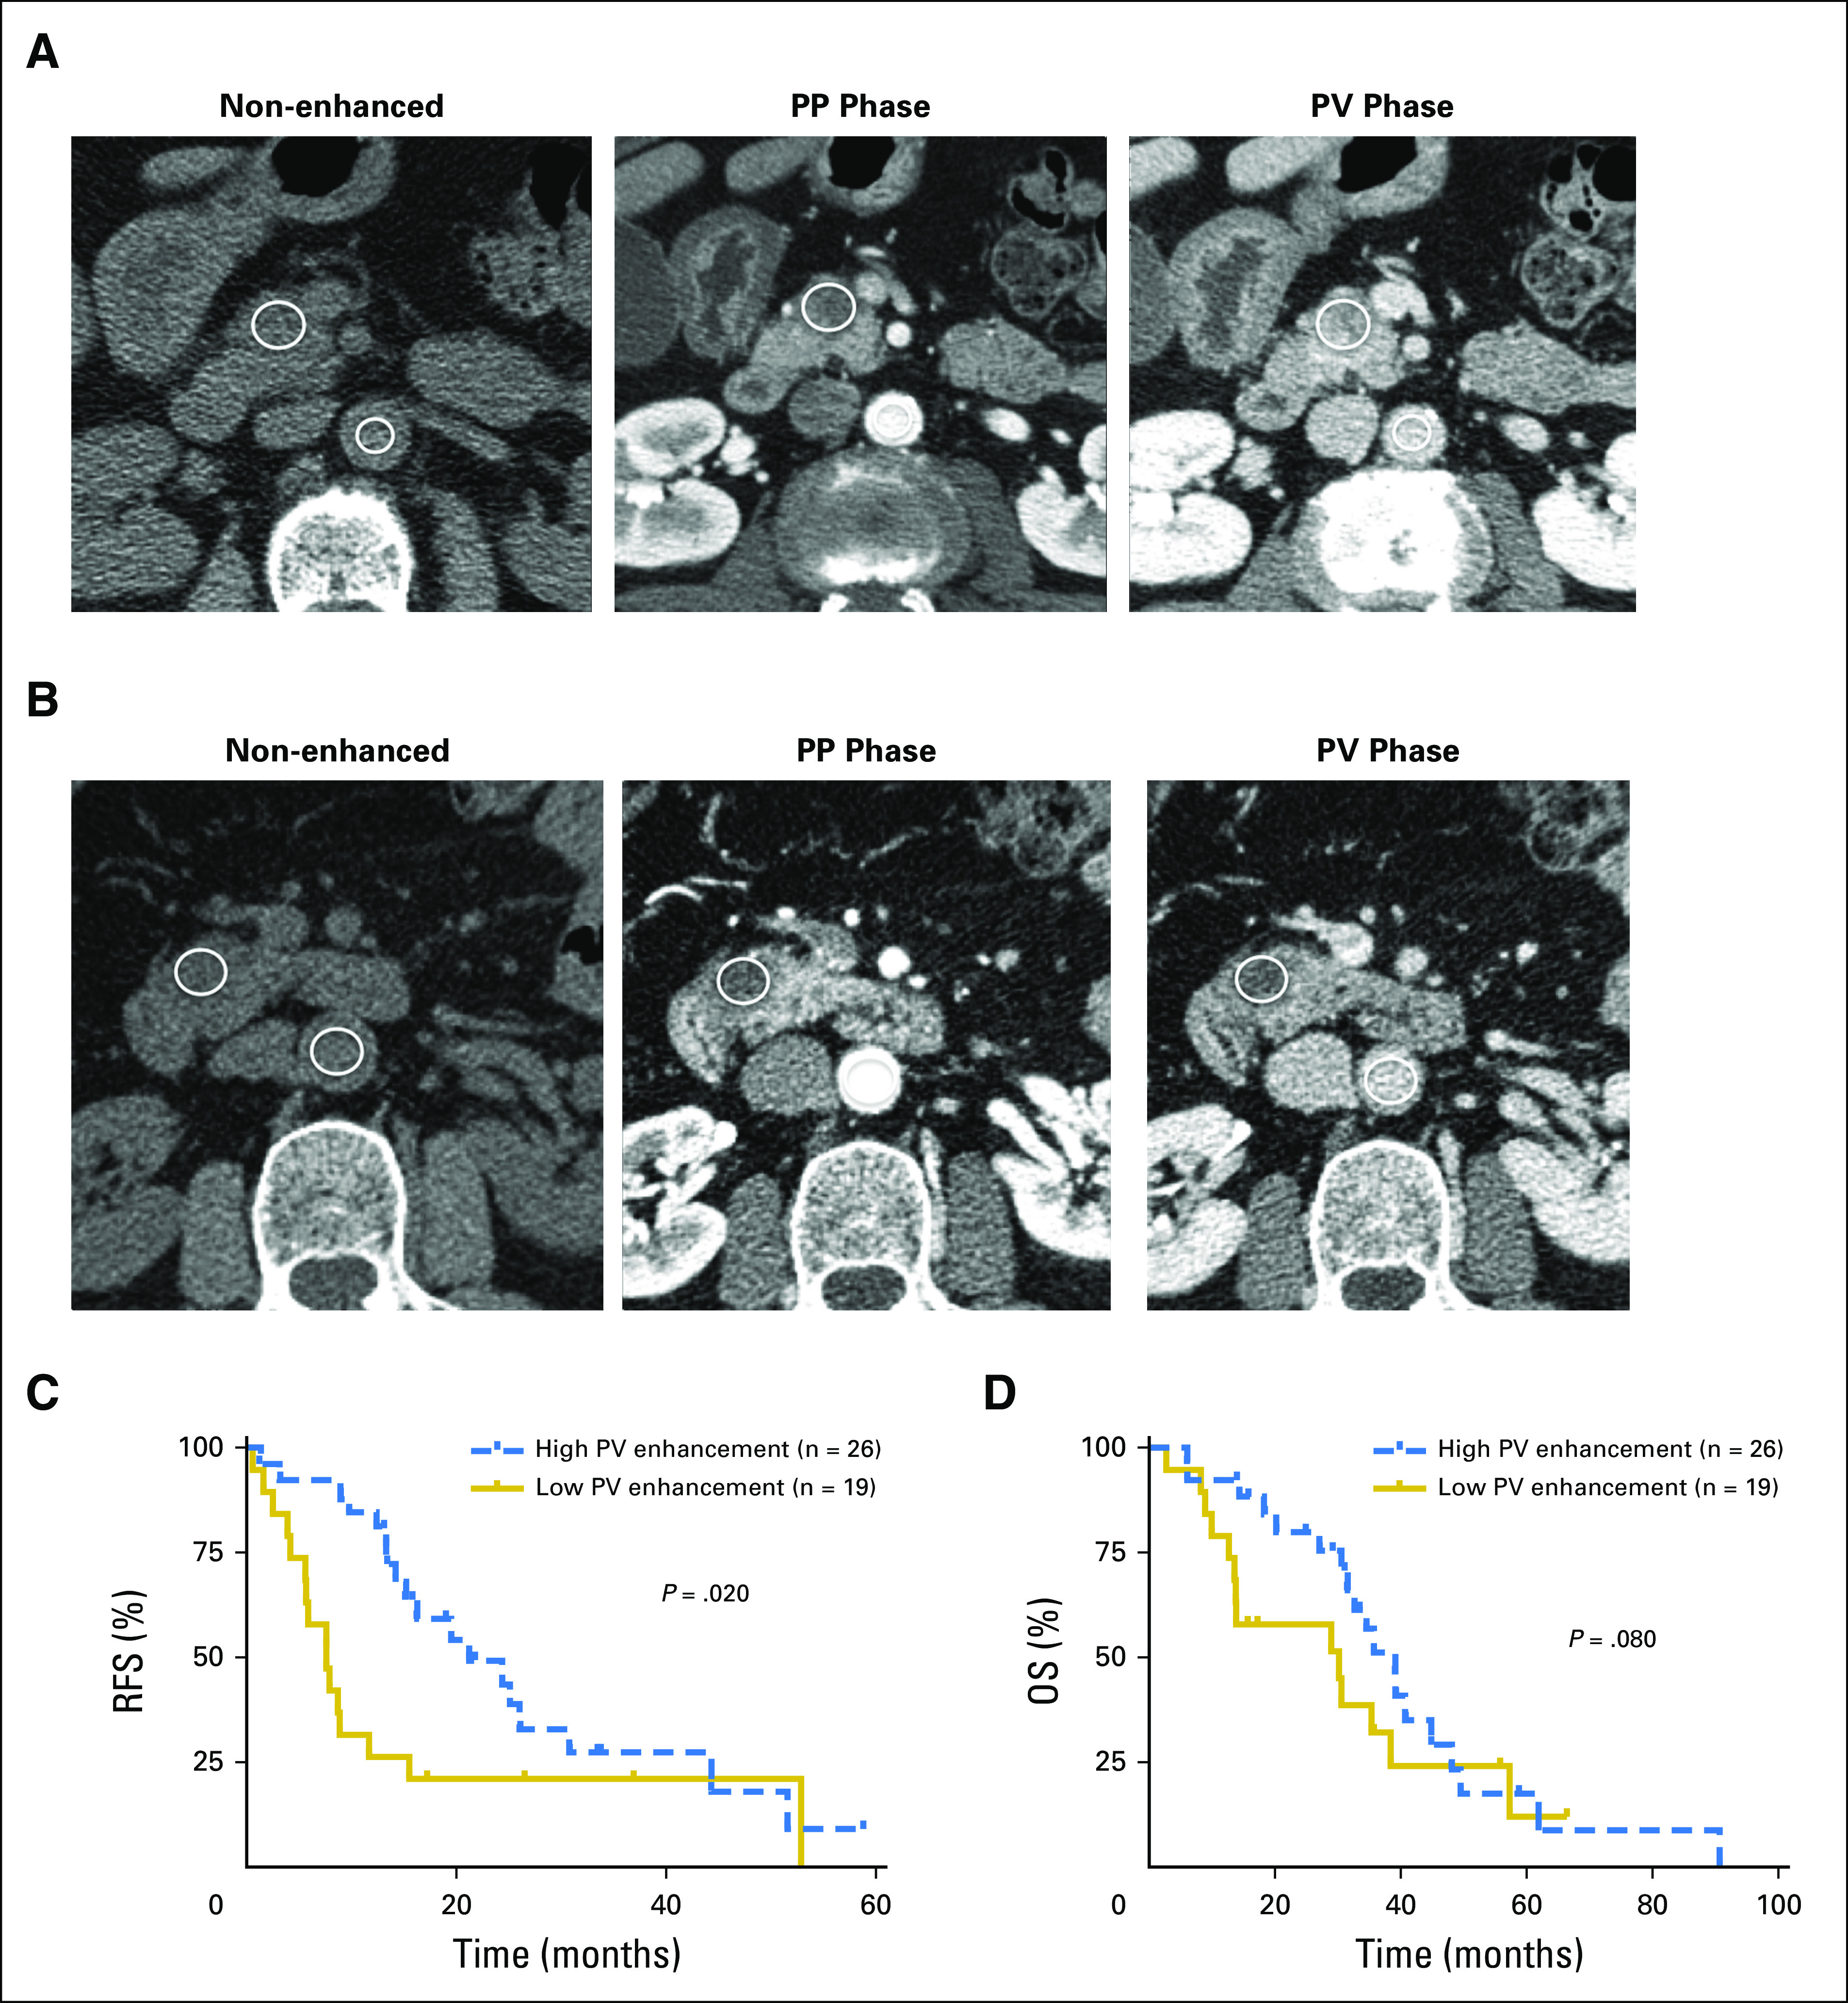
Preoperative computed tomography (CT) enhancement patterns in patients with resectable pancreatic adenocarcinoma tumors. (A) An example of a tumor with high normalized enhancement ratio at both pancreatic parenchymal (PP) and portovenous (PV) phases of the CT studies. The nonenhanced (left), PP phase (middle), and PV phase (right) images show region of interest placement in the tumor and aorta. The calculated normalized enhancement ratio was 0.25 at the PP phase and 0.66 at the PV phase. (B) An example of a tumor with low normalized enhancement ratio at both PP and PV phases of the CT studies. The calculated normalized enhancement ratio was 0.09 at the PP phase and 0.31 at the PV phase. (C, D) Kaplan-Meier curves of recurrence-free survival (RFS) and overall survival (OS) for high versus low PV tumor enhancement. Patients with high PV tumor enhancement ratio (≥ 0.40) had longer RFS than patients with a low PV tumor enhancement ratio (< 0.40; P = .020). There was a trend toward patients with a high PV tumor enhancement ratio having prolonged OS (P = .080).
We investigated the association between CT tumor enhancement and prognosis. Univariate analysis revealed that increasing tumor size (HR = 1.7; P = .010), poor tumor differentiation (HR = 4.6; P = .002), and normalized tumor enhancement ratio at the PV phase < 0.40 (HR = 7.1; P = .001) were significantly associated with recurrence by 12 months after resection. Normalized tumor enhancement ratio at the PV phase < 0.40 was independently associated with disease recurrence within 12 months after resection (HR = 5.6; P = .010) in a multivariate model including the same three variables. Univariate analysis showed that increasing tumor size (HR = 1.6; P = .020), positive resection margin (HR = 2.8; P = .030), and normalized tumor enhancement ratio at the PV phase < 0.40 (HR = 2.4; P = .021) were significantly associated with shorter OS. However, multivariate analysis including those same variables did not show normalized tumor enhancement ratio at the PV phase < 0.40 as an independent predictor of OS (HR = 1.8; P = .121).
Figures 3C and 3D show the Kaplan-Meier RFS and OS estimates when stratified by the PV phase normalized tumor enhancement ratio. Patients with normalized tumor enhancement ratio < 0.40 at the PV phase CT imaging had shorter time to recurrence than those with tumor enhancement ratio ≥ 0.40 (P = .020). There was a trend toward patients with normalized tumor enhancement ratio at PV phase < 0.40 having shorter survival compared with patients with normalized tumor enhancement ratio at PV phase ≥ 0.40 (P = .080).
TSD Correlated With CT Enhancement Patterns in Patients With Resectable PDA Tumors
Next, we compared normalized tumor enhancement ratio in the PP and PV phases with TSD in the same patients. In the PP phase, there was no difference in TSD between tumors with normalized enhancement ratios < 0.16 versus ≥ 0.16 (P = .800). In the PV phase, tumors with normalized enhancement ratios ≥ 0.40 had significantly higher TSD compared with those with enhancement ratios < 0.40 (P = .020; Fig 4A and 4B). There was a moderate linear correlation between the normalized tumor enhancement ratio at the PV phase on CT imaging and TSD (ρ = 0.52; P = .003; Fig 4C). These analyses demonstrate that preoperative CT enhancement at the PV phase may be a noninvasive surrogate for TSD in patients with resectable PDA tumors.
Fig 4.

Tumor stromal density (TSD) is associated with portovenous (PV) computed tomography (CT) enhancement patterns in patients with resectable pancreatic ductal adenocarcinoma (PDA) tumors. Box-and-whisker plots of TSD in tumors with high versus low normalized enhancement ratios in (A) the pancreatic parenchymal (PP) phase and (B) the PV phase. There was no difference in TSD between high versus low PP tumor enhancement groups (P = .800). Significantly higher TSD was found in tumors from patients with high PV tumor enhancement compared with those with low PV tumor enhancement (P = .020). (C) There is a moderate linear correlation between the normalized tumor enhancement ratio at the PV phase on CT imaging and TSD (ρ = 0.52; P = .003).
DISCUSSION
PDA is widely associated with DS in the surgical and pathology literature, in which resected disease is studied much more commonly than metastatic samples. The degree of heterogeneity seen in this desmoplastic response between patients and between anatomic sites in the same patient has not been well described. We developed an automated, image-based algorithm to quantify TSD in PDA that agrees well with visual pathologic assessment. This algorithm was then used to demonstrate TSD varies across metastatic sites and that TSD of the primary tumor positively associates with survival.
Most PDA patients die with metastases.22 Although effective treatment of metastatic disease is the most important priority in PDA, translational efforts and preclinical models have focused largely on primary tissues.23 We found significant differences in TSD across metastatic sites. Prior work has demonstrated that metastatic PDA tumors have limited driver-mutation heterogeneity when compared with the primary tumor and largely concordant tumor-specific gene expression patterns in samples across many primary and metastatic sites.17,24 However, metastatic sites may have different proteomic profiles.25 These important observations, coupled with our results, suggest the variation in TSD is a function of host organ-site physiology and not secondary to cancer genomic or epigenomic/transcriptional differences between the primary and metastatic tumors. Different sites of PDA likely react differently to tumor cells with respect to generation of DS that may have therapeutic implications.
We found that TSD correlated with both RFS and OS in a mature cohort of patients with resected PDA tumors who did not undergo adjuvant therapy. Our prognostic findings imply a protective role of stroma in PDA pathogenesis, in agreement with prior studies that used subjective assessments of various stromal characteristics.3,7,26
In the UCSF cohort, where most patients received adjuvant therapy, a lower risk of recurrence or death was seen initially in patients with high TSD, but the risk for both increased over time, with the survival curves eventually crossing. The differences in clinical management among cohorts are important in the interpretation of these results. The Denmark cohort did not receive any adjuvant therapy.19,20 In contrast, 91% (41 of 45) of the patients in the UCSF cohort received adjuvant therapy soon after resection, which more recently has become the standard of care.27 Interestingly, Sinn et al8 showed that a qualitatively dense stroma in PDA was associated with a significantly longer RFS and OS in the CONKO-001 trial, but this effect was restricted to patients in the observation group (no adjuvant therapy until recurrence) and not seen in patients randomly assigned to adjuvant gemcitabine.8 Our findings, along with those of Sinn et al,8 suggest patients with tumors that have low TSD may benefit more from adjuvant chemotherapy, closing the survival gap between high TSD and low TSD seen in the Denmark cohort.
Assessment of TSD is limited by the availability of adequate tissue samples. Thus, we evaluated a noninvasive imaging method to provide information about stroma density. We showed that normalized tumor enhancement ratio at the PV phase on CT imaging was correlated with TSD and prognosis, in agreement with a prior study that demonstrated resected PDA tumors with lower enhancement tended to be less fibrotic.16 The association between PDA enhancement and TSD may be explained by the properties of the CT contrast materials that pass freely between the intravascular and extravascular extracellular space but do not cross intact cell membranes. Therefore, higher enhancement is expected in tumors with higher extracellular matrix or higher stromal density.
Our study does have several limitations. The Denmark and UCSF cohorts comprised patients with resectable PDA, somewhat limiting the generalizability of our findings. Another limitation of our study is that only one board-certified pathologist reviewed specimens for manual TSD quantification, from which we show good correlation between manual and automated TSD quantification. To limit any potential bias, manual quantification was done blinded to the results of automated quantification and all other clinical and pathologic data.
In summary, we found TSD was lowest at solid-organ metastases, and that higher TSD was positively associated with outcome in patients with resected PDA tumors without adjuvant therapy. Tumor normalized enhancement ratios at the PV phase of multiphasic CT imaging are also associated with higher TSD and RFS, suggesting quantitative analyses of multiphasic CT imaging may be a noninvasive surrogate for TSD and/or an independent biomarker for therapy selection.
Acknowledgment
We thank Bentley Midkiff and the University of North Carolina at Chapel Hill Translational Pathology Laboratory Core Facility for excellent technical assistance.
Footnotes
This work was partially supported by Grants R01-CA199064 (J.J.Y.) and R01-CA176561 (E.A.C.) from the US National Institutes of Health; the University of North Carolina University Cancer Research Fund (J.J.Y.); University of California, San Francisco, Resource Allocation Program Funding (Z.W. and E.A.C.); and the Doris Duke Charitable Foundation (E.A.C.).
AUTHOR CONTRIBUTIONS
Conception and design: Robert J. Torphy, Zhen Wang, Benjamin Yeh, Jen Jen Yeh, Eric A. Collisson
Financial support: Jen Jen Yeh
Provision of study material or patients: Julia S. Johansen, Michael A. Hollingsworth, Jen Jen Yeh
Collection and assembly of data: Robert J. Torphy, Zhen Wang, Aisha True-Yasaki, Keith E. Volmar, Michael A. Hollingsworth, Jen Jen Yeh, Eric A. Collisson
Data analysis and interpretation: Robert J. Torphy, Zhen Wang, Keith E. Volmar, Naim Rashid, Jen Jen Yeh, Eric A. Collisson
Manuscript writing: All authors
Final approval of manuscript: All authors
Accountable for all aspects of the work: All authors
AUTHORS' DISCLOSURES OF POTENTIAL CONFLICTS OF INTEREST
The following represents disclosure information provided by authors of this manuscript. All relationships are considered compensated. Relationships are self-held unless noted. I = Immediate Family Member, Inst = My Institution. Relationships may not relate to the subject matter of this manuscript. For more information about ASCO's conflict of interest policy, please refer to www.asco.org/rwc or ascopubs.org/po/author-center.
Robert J. Torphy
No relationship to disclose
Zhen Wang
Stock and Other Ownership Interests: Nextrast
Honoraria: GE Healthcare (Inst)
Research Funding: Guerbet (Inst)
Patents, Royalties, Other Intellectual Property: Nextrast (Inst)
Travel, Accommodations, Expenses: GE Healthcare (Inst)
Aisha True-Yasaki
No relationship to disclose
Keith E. Volmar
No relationship to disclose
Rashid Naim
No relationship to disclose
Benjamin Yeh
Stock and Other Ownership Interests: Nextrast
Honoraria: GE Healthcare
Consulting or Advisory Role: GE Healthcare
Research Funding: GE Healthcare, Philips Healthcare, Guerbet
Patents, Royalties, Other Intellectual Property: Patents related to imaging contrast materials
Travel, Accommodations, Expenses: GE Healthcare
Julia S. Johansen
No relationship to disclose
Michael A. Hollingsworth
Stock and Other Ownership Interests: Sanguine Therapeutics and Diagnostics
Research Funding: Glycomimetics (Inst)
Patents, Royalties, Other Intellectual Property: Royalties on cell lines (Inst)
Jen Jen Yeh
No relationship to disclose
Eric A. Collisson
Stock and Other Ownership Interests: Gilead Sciences, ILMN
Consulting or Advisory Role: Guardant Health
Research Funding: Ignyta, Plexxikon (Inst)
REFERENCES
- 1.Neesse A, Michl P, Frese KK, et al. : Stromal biology and therapy in pancreatic cancer. Gut 60:861-868, 2011 [DOI] [PubMed] [Google Scholar]
- 2.Feig C, Gopinathan A, Neesse A, et al. : The pancreas cancer microenvironment. Clin Cancer Res 18:4266-4276, 2012 [DOI] [PMC free article] [PubMed] [Google Scholar]
- 3.Rhim AD, Oberstein PE, Thomas DH, et al. : Stromal elements act to restrain, rather than support, pancreatic ductal adenocarcinoma. Cancer Cell 25:735-747, 2014 [DOI] [PMC free article] [PubMed] [Google Scholar]
- 4.Beatty GL, Chiorean EG, Fishman MP, et al. : CD40 agonists alter tumor stroma and show efficacy against pancreatic carcinoma in mice and humans. Science 331:1612-1616, 2011 [DOI] [PMC free article] [PubMed] [Google Scholar]
- 5.Sherman MH, Yu RT, Tseng TW, et al. : Stromal cues regulate the pancreatic cancer epigenome and metabolome. Proc Natl Acad Sci USA 114:1129-1134, 2017 [DOI] [PMC free article] [PubMed] [Google Scholar]
- 6.Rucki AA, Foley K, Zhang P, et al. : Heterogeneous stromal signaling within the tumor microenvironment controls the metastasis of pancreatic cancer. Cancer Res 77:41-52, 2017 [DOI] [PMC free article] [PubMed] [Google Scholar]
- 7.Erkan M, Michalski CW, Rieder S, et al. : The activated stroma index is a novel and independent prognostic marker in pancreatic ductal adenocarcinoma. Clin Gastroenterol Hepatol 6:1155-1161, 2008 [DOI] [PubMed] [Google Scholar]
- 8.Sinn M, Denkert C, Striefler JK, et al. : α-Smooth muscle actin expression and desmoplastic stromal reaction in pancreatic cancer: Results from the CONKO-001 study. Br J Cancer 111:1917-1923, 2014 [DOI] [PMC free article] [PubMed] [Google Scholar]
- 9.Olive KP, Jacobetz MA, Davidson CJ, et al. : Inhibition of Hedgehog signaling enhances delivery of chemotherapy in a mouse model of pancreatic cancer. Science 324:1457-1461, 2009 [DOI] [PMC free article] [PubMed] [Google Scholar]
- 10.Jiang H, Hegde S, Knolhoff BL, et al. : Targeting focal adhesion kinase renders pancreatic cancers responsive to checkpoint immunotherapy. Nat Med 22:851-860, 2016 [DOI] [PMC free article] [PubMed] [Google Scholar]
- 11.Catenacci DVT, Junttila MR, Karrison T, et al. : Randomized phase Ib/II study of gemcitabine plus placebo or vismodegib, a hedgehog pathway inhibitor, in patients with metastatic pancreatic cancer. J Clin Oncol 33:4284-4292, 2015 [DOI] [PMC free article] [PubMed] [Google Scholar]
- 12.Özdemir BC, Pentcheva-Hoang T, Carstens JL, et al. : Depletion of carcinoma-associated fibroblasts and fibrosis induces immunosuppression and accelerates pancreas cancer with reduced survival. Cancer Cell 25:719-734, 2014 [Erratum: Cancer Cell. 28:831-3, 2015] [DOI] [PMC free article] [PubMed] [Google Scholar]
- 13.Lee JJ, Perera RM, Wang H, et al. : Stromal response to Hedgehog signaling restrains pancreatic cancer progression. Proc Natl Acad Sci USA 111:E3091-E3100, 2014 [DOI] [PMC free article] [PubMed] [Google Scholar]
- 14.Tamm EP, Balachandran A, Bhosale PR, et al. : Imaging of pancreatic adenocarcinoma: Update on staging/resectability. Radiol Clin North Am 50:407-428, 2012 [DOI] [PubMed] [Google Scholar]
- 15.Sahani DV, Shah ZK, Catalano OA, et al. : Radiology of pancreatic adenocarcinoma: Current status of imaging. J Gastroenterol Hepatol 23:23-33, 2008 [DOI] [PubMed] [Google Scholar]
- 16.Hata H, Mori H, Matsumoto S, et al. : Fibrous stroma and vascularity of pancreatic carcinoma: Correlation with enhancement patterns on CT. Abdom Imaging 35:172-180, 2010 [DOI] [PubMed] [Google Scholar]
- 17.Moffitt RA, Marayati R, Flate EL, et al. : Virtual microdissection identifies distinct tumor- and stroma-specific subtypes of pancreatic ductal adenocarcinoma. Nat Genet 47:1168-1178, 2015 [DOI] [PMC free article] [PubMed] [Google Scholar]
- 18.Schultz NA, Werner J, Willenbrock H, et al. : MicroRNA expression profiles associated with pancreatic adenocarcinoma and ampullary adenocarcinoma. Mod Pathol 25:1609-1622, 2012 [DOI] [PubMed] [Google Scholar]
- 19.Laklai H, Miroshnikova YA, Pickup MW, et al. : Genotype tunes pancreatic ductal adenocarcinoma tissue tension to induce matricellular fibrosis and tumor progression. Nat Med 22:497-505, 2016 [DOI] [PMC free article] [PubMed] [Google Scholar]
- 20.Schultz NA, Dehlendorff C, Jensen BV, et al. : MicroRNA biomarkers in whole blood for detection of pancreatic cancer. JAMA 311:392-404, 2014 [DOI] [PubMed] [Google Scholar]
- 21.Freeny PC, Marks WM, Ryan JA, et al. : Pancreatic ductal adenocarcinoma: Diagnosis and staging with dynamic CT. Radiology 166:125-133, 1988 [DOI] [PubMed] [Google Scholar]
- 22.Iacobuzio-Donahue Christine A: DPC4 gene status of the primary carcinoma correlates with patterns of failure in patients with pancreatic cancer. J Clin Oncol 10.1200/JCO.2008.17.7188 [DOI] [PMC free article] [PubMed] [Google Scholar]
- 23.Kim M-S, Zhong Y, Yachida S, et al. : Heterogeneity of pancreatic cancer metastases in a single patient revealed by quantitative proteomics. Mol Cell Proteomics 13:2803-2811, 2014 [DOI] [PMC free article] [PubMed] [Google Scholar]
- 24.Iacobuzio-Donahue CA, Fu B, Yachida S, et al. : DPC4 gene status of the primary carcinoma correlates with patterns of failure in patients with pancreatic cancer. J Clin Oncol 27:1806-1813, 2009 [DOI] [PMC free article] [PubMed] [Google Scholar]
- 25.Makohon-Moore AP, Zhang M, Reiter JG, et al. : Limited heterogeneity of known driver gene mutations among the metastases of individual patients with pancreatic cancer. Nat Genet 49:358-366, 2017 [DOI] [PMC free article] [PubMed] [Google Scholar]
- 26.Diana A, Wang LM, D’Costa Z, et al. : Prognostic value, localization and correlation of PD-1/PD-L1, CD8 and FOXP3 with the desmoplastic stroma in pancreatic ductal adenocarcinoma. Oncotarget 7:40992-41004, 2016 [DOI] [PMC free article] [PubMed] [Google Scholar]
- 27. doi: 10.6004/jnccn.2017.0131. National Comprehensive Cancer Network. Clinical Practice Guidelines in Oncology: Pancreatic Adenocarcinoma, Version 2.2017. https://www.nccn.org. [DOI] [PubMed]