

Abstract
Cytochrome P450 (CYP) superfamily genes encode enzymes that play a role in metabolizing endogenous compounds and in detoxifying exogenous chemicals. The CYP2D subfamily is a member of the CYP2 family, and its gene expansion in herbivores is presumably linked with the need to detoxify abundant plant toxins in the diet, which indicates that CYP2D gene expansion is associated with dietary preferences. To test this hypothesis, the dietary information and CYP2D gene number for 73 vertebrates from different taxonomic groups including 22 mammals, 49 birds, 1 reptile, and 1 amphibian were collected, and correlation analysis and ANOVA were conducted. The results showed that most species (45/73) had only one CYP2D gene, despite their different diets, and dietary preferences were not correlated with CYP2D gene numbers. Specifically, the majority of birds and 7 mammals had only 1 CYP2D gene, and the CYP2D gene number of mammals ranged from 1 to 11, irrespective of their feeding habits. Species with a CYP2D gene number ≥5 included carnivores, herbivores, and omnivores. Furthermore, statistical analyses revealed that no significant correlation existed between dietary preferences and CYP2D gene number, and there was no significant CYP2D gene number variation among species with different dietary preferences, regardless of whether all vertebrates or specific lineages were considered. Furthermore, gene dynamics which indicated by gene duplication events and loss events showed that CYP2D gene number variation had no relationship with diet, suggesting that diet was not a driving force of CYP2D gene expansion and that CYP2D gene expansion was more complex than previously recognized.
Keywords: CYP2D subfamily, diet, evolution, gene expansion, P450
1. INTRODUCTION
Most plant species can produce complex toxic secondary metabolites which have anti‐herbivore effect; these metabolites serve as sexual hormones, metal‐transporting agents, differentiation effectors, and so on (Demain & Fang, 2000; Sullivan, Hagen, & Hammerstein, 2008). In addition, among the plant secondary metabolites, alkaloids, such as cocaine and nicotine, are potent neurotoxins that evolved to prevent herbivores from consuming plants (Karban & Baldwin, 1997; Roberts & Wink, 1998; Sullivan et al., 2008). As countermeasures, herbivores have evolved physiological mechanisms to defend against or minimize the harmful effects of plant secondary chemicals (McArthur, Hagerman, & Robbins, 1991). Examples include evolving chemosensory receptors that prevent the animals from absorbing toxic or harmful substances, forming symbiotic relationships with microbes to extract nutrients from plants, forming cellular membranes for multidrug transport, and so forth (Karban & Agrawal, 2002). Among these strategies, perhaps the most general one is evolving enzymes that can detoxify plant secondary chemicals (Karban & Agrawal, 2002; Sullivan et al., 2008).
Enzymes in the cytochrome P450 (CYP) superfamily can protect animals against the attack of exogenous compounds; thus, these enzymes are important for survival. Cytochrome P450 (CYP) genes encode enzymes (Palmer & Reedijk, 1991) catalyzing the oxidation of exogenous and noxious environmental chemicals, such as drugs, steroids, and carcinogenic compounds present in food (Yasukochi & Satta, 2015). They are distributed widely across various organisms (Nelson, 2009), from archaea, bacteria, and viruses to higher plants and animals (Gotoh, 2012).
According to the difference in substrates, CYPs can be categorized into two types: the biosynthesis type (B‐type) and the detoxification type (D‐type) (Gotoh, 2012; Nebert & Dalton, 2006; Rezen, Debeljak, Kordis, & Rozman, 2004). In humans, the D‐type is responsible for the detoxification of xenobiotics such as aromatic compounds, plant alkaloids, and especially drugs; the B‐type is generally involved in endogenous processes, for example, the biosynthesis of physiologically active chemicals such as steroids, hormones, and cholesterols (Kawashima & Satta, 2014; Martignoni, Groothuis, & de Kanter, 2006). Although involved in steroid and eicosanoid metabolism, mammalian CYP1‐4s are usually viewed as detoxification enzymes (Gotoh, 2012; Nebert & Dalton, 2006).
Among vertebrate CYP families, CYP2 family is the largest and most diverse (Nelson, 2003; Nelson et al., 2004). The CYP2 family plays an important role in metabolizing various endogenous and exogenous chemicals (Lee et al., 2008; Wang & Tompkins, 2008). Due to their ability to metabolize a wide range of chemical compounds, including many clinically important drugs such as fluoxetine, the CYP2D genes of mammals have fascinated to many researchers and have received a considerable amount of attention (Kirischian, McArthur, Jesuthasan, Krattenmacher, & Wilson, 2011). Although the CYP2 family includes 29 subfamilies, only a few subfamilies are widely distributed across vertebrate taxa, and CYP2D subfamily members have mainly been identified in amphibians, birds, and mammals (Kirischian et al., 2011; Nelson, 2009). CYP2D isoform is the first one exhibiting polymorphism, and it functions in the monooxygenation of diverse substrates, such as β‐blockers, antidepressants, dextromethorphan, antiarrhythmics (Hiroi, Chow, Imaoka, & Funae, 2002; Martignoni et al., 2006).
The human CYP2D gene subfamily comprises CYP2D6, CYP2D7, and CYP2D8, the latter two of which are often pseudogenes in some species (Nelson, 2009). The CYP2D6 enzyme of human has a high affinity for alkaloids, and it can detoxify them (Fonne‐Pfister & Meyer, 1988). Although the proportion of the CYP2D6 enzyme accounts for only ~4% of the total P450 content of the liver, the enzyme is very important in that its substrates constitute approximately 25% of frequently prescribed drugs (e.g., antiarrhythmics, β‐blockers, and antidepressants) (Ingelman‐Sundberg, 2005; Yasukochi & Satta, 2015; Zuber, Anzenbacherova, & Anzenbacher, 2002).
CYP2D gene number refers to the number of gene belonging to the CYP2D gene subfamily; for example, if a species has CYP2D6, CYP2D7, and CYP2D8 then this species has 3 CYP2D genes. The number of CYP2D genes varies among species. Although most birds have a single CYP2D gene, species of amphibians and primary mammalian orders have many CYP2D genes and exhibit an independent expansion of the CYP2D subfamily. For example, primates have 2–3 CYP2D genes, whereas in rodents, rabbits, and horses, the CYP2D gene numbers are 5–7, 5, and 6, respectively (Cooke, Bligh, Cybulski, Ioannides, & Hall, 2012; Uno, Iwasaki, Yamazaki, & Nelson, 2011; Uno, Uehara, Kohara, Murayama, & Yamazaki, 2010; Yasukochi & Satta, 2015). It has been proposed that the expansion of CYP2D subfamily genes could be associated with feeding habits and with plant toxins (e.g., alkaloids) metabolism (Fonne‐Pfister & Meyer, 1988; Yasukochi & Satta, 2015). Generally, herbivores encounter more abundant plant toxins than omnivores and carnivores, which have fewer plant species in their diets. Additionally, the CYP2D subfamily, especially the CYP2D6 gene, is responsible for plant toxin detoxification. Thus, the study here intended to explore whether dietary preference was a driving force for CYP2D subfamily gene expansion across vertebrates. This problem was divided into several questions: (a) Is the gene number of CYP2D subfamily associated with diet? (b) Do the CYP2D gene numbers vary according to dietary preference? (c) Is the correlation mentioned in (a) or the relationship between gene number variance and diet mentioned in (b) lineage specific? and (d) Are the dynamics of CYP2D gene number associated with diet? To answer these questions, the number of CYP2D genes and dietary information were collected across the vertebrates, and corresponding statistical analyses and gene dynamics surveys were performed.
2. MATERIALS AND METHODS
2.1. Data sources
The data of CYP2D gene numbers were obtained from published papers (He, Chen, Yang, & Zhou, 2016; Nelson, 2009; Yasukochi & Satta, 2011) (see the Supporting Information [Link]) and multiple databases, including those of Ensembl (http://www.ensembl.org/), the National Center for Biotechnology Information (http://www.ncbi.nlm.nih.gov/genome/), the Cytochrome P450 Homepage (http://drnelson.uthsc.edu/CytochromeP450.html), and The Human Cytochrome P450 (CYP) Allele Nomenclature Database (http://www.cypalleles.ki.se/). The number of CYP2D genes selected was based on the criterion that the number was reported in publicly available literature. First, the database mentioned in Nelson (2009) was consulted due to its comprehensive summary of CYP2D genes from different taxonomic groups of species. Then, the newest literature on CYP2D genes and their related references were searched to obtain more information about CYP2D gene number. When the gene numbers conflicted with each other, the sequence present in the literature was checked, and more literature was examined to decide which one was true. In addition, dietary information was collected from literature and database resources. According to their dietary preferences, animals can be classified into three kinds: carnivores, omnivores, and herbivores, which are often based on the 90% rule (Harestad & Bunnell, 1979). In brief, a species is viewed as herbivorous (or carnivorous) when its diet contains ninety percent or more plant (or animal) tissue, and the others are considered omnivorous. The feeding habit was mainly obtained from the Animal Diversity Web (http://animaldiversity.org, last accessed September 21, 2017), and Li and Zhang (2014), Wang and Zhao (2015), etc. (see Supporting Information). The species tree was reconstructed by referring to Murphy, Pevzner, and O'Brien (2004), Zhao, Li, and Zhang (2015), and Jarvis et al. (2014). Numbers of total genes, intact genes, and pseudogenes of CYP2D subfamily members and diet were assigned to the corresponding species on the species tree.
2.2. Statistical analysis
To examine whether the number of CYP2D genes was related to dietary preference or not, a correlation analysis was performed. In addition, to test whether CYP2D gene number varied according to the diet of the species, analysis of variance (ANOVA) was conducted. Both analyses were carried out by using SPSS 16.0 (SPSS Inc., Chicago, IL). To test whether the correlation or gene number discrepancy was lineage specific, correlation analysis and ANOVA were also carried out in a bird group and a mammal group, respectively. However, species that are phylogenetically related are apt to resemble each other in most traits (Blomberg, Garland, & Ives, 2003), which results in non‐independence of data in the statistical analysis. Thus, the phylogenetic comparative method was used to solve this problem by removing the effect of phylogeny (Felsenstein, 1985; Harvey & Pagel, 1991). In this study, the PDAP module of Mesquite software (Maddison & Maddison, 2017) and the phytools package (Revell, 2012) of R 3.4.3 (R Core Team, 2016) were used to remove the effect of phylogeny during the statistical analyses.
2.3. Survey of gene duplication and gene loss events
To explore whether the dynamics of CYP2D gene number have a relationship with diet, gene duplication events and gene loss events were surveyed. First, amino acid sequences of the CYP2D subfamily members mentioned above were downloaded: from these, the pseudogenes were excluded due to their great divergence. In addition, because of the failure to obtain the gorilla CYP2D7 sequence, the survey here did not include the gorilla. Second, a neighbor‐joining tree of the CYP2D sequences was created by MEGA 6.0 (Tamura, Stecher, Peterson, Filipski, & Kumar, 2013) using the default setting. Third, the protein tree was compared to the species tree reconstructed before using Notung 2.9 (Durand, Halldorsson, & Vernot, 2006) to locate the duplication and loss events.
3. RESULTS
Seventy‐three species from 46 orders of vertebrates that had both CYP2D gene number and dietary information were obtained (Figure 1 and Supporting Information), including 22 mammals from 9 orders, 49 birds from 35 orders, 1 reptile, and 1 amphibian. Most species had at least 1 functional CYP2D gene. Specifically, in mammalian species, the CYP2D gene number ranged from 1 to 11, and 7 species had only 1 CYP2D gene, including carnivorous, herbivorous, and omnivorous species; in avian species, the number of CYP2D genes was either 1 or 0, regardless of their feeding preferences; and across the vertebrates, the species for which the CYP2D gene number was ≥5 included carnivores, herbivores, and omnivores. The results are shown in Figure 1. The numbers of total CYP2D genes, functional genes and pseudogenes ranged from 0 to 11, 0 to 9, and 0 to 3, respectively. Many species had only 1 intact CYP2D gene and 0 pseudogenes. In terms of gene expansion, 8, 9, and 6 functional genes existed in the carnivore (tarsier), omnivore (mouse), and herbivore (horse), respectively. Therefore, in a preliminary observation, there was no obvious relationship between CYP2D gene number and diet. To confirm this observation, correlation analysis was carried out. In detail, the dietary preference of a species was coded as 1 (herbivorous), 0.5 (omnivorous), or 0 (carnivorous), and correlation analysis between dietary codes and CYP2D gene numbers was performed. Because phylogenetic inertia, which means that more closely related species have more similar traits (Feng, Zhao, & Lu, 2015; Fisher & Owens, 2004), can result in data non‐independence, phylogenetically independent contrasts (PIC) (Felsenstein, 1985) were employed to remove this effect by using Mesquite software (Maddison & Maddison, 2017). Specifically, the 73 phylogenetically correlated data points were converted into 72 PICs using a species tree of the 73 species. Since the data did not fit the standard normal distribution (p < 0.05, Kolmogorov–Smirnov test), the nonparametric Spearman's rank correlation coefficient (ρ) was used to assess the correlation (Wang & Zhao, 2015). The result revealed no correlation between the number of CYP2D genes and diet. For the total number of CYP2D genes, the correlation coefficient and p‐value for the PICs of the dietary code and the CYP2D gene numbers were ρ = −0.137 and p = 0.25, respectively, and for functional genes, they were ρ = −0.07 and p = 0.56, respectively. When only considering mammals, the correlation coefficient and p‐value for the PICs were ρ = −0.303 and p = 0.182 (total) and ρ = −0.168 and p = 0.467 (functional), respectively. In addition, in birds, they were ρ = 0.015 and p = 0.918 (total) and ρ = −0.016 and p = 0.917 (functional), respectively. The results of correlation analyses are shown in Figure 2.
Figure 1.

CYP2D gene numbers and diet information of 73 vertebrates used in this study. C: carnivorous; H: herbivorous; O: omnivorous
Figure 2.

Phylogenetically independent contrasts (PICs) of dietary preferences had no correlation with PICs of CYP2D gene number. (a) PICs of total number of CYP2D gene didn't correlate with that of diet code in 73 species; (b) PICs of number of functional CYP2D gene had no correlation with that of diet code in 73 species; (c) PICs of total number of CYP2D gene didn't correlate with that of diet code in 22 mammals; (d) PICs of number of functional CYP2D gene had no correlation with that of diet code in 22 mammals; (e) PICs of total number of CYP2D gene didn't correlate with that of diet code in 49 birds; (f) PICs of number of functional CYP2D gene had no correlation with that of diet code in 49 birds. Each species was coded with 0 (carnivorous), 0.5 (omnivorous), or 1 (herbivorous), according to the potential toxins content in their food. The Spearman's rank correlation coefficient (ρ) was used to evaluate the association with a two‐tailed p‐value
To further clarify whether dietary preferences drove the expansion of CYP2D genes, analysis of variance (ANOVA) of dietary code and CYP2D gene numbers was performed. Since the data did not fit the standard normal distribution (p < 0.05, Kolmogorov‐Smirnov test), the Jonckheere–Terpstra test implemented in nonparametric tests was used to assess the differences. The result demonstrated that species with different dietary preferences did not significantly vary in the number of CYP2D genes for the total number of CYP2D genes (p = 0.782) or the number of functional CYP2D genes (p = 0.519). When only considering mammals, the p‐values for total CYP2D genes and functional CYP2D genes were 0.648 and 0.798, respectively. In birds, they were 0.303 and 0.115, respectively. After removing the phylogenetic similarity by using the R package, the conclusion was similar, with p = 0.733 for total CYP2D genes and p = 0.77 for functional CYP2D genes in the vertebrate group; in mammals, they were 0.69 and 0.858, respectively, and in birds, they were 0.488 and 0.314, respectively. The results of standard ANOVA and phylANOVA were clearly the same, and neither was significant. This result may have been due to the limited number of species, which is supported by the suggestion of Rohlfs and Nielsen (2015) that although standard ANOVA cannot analyze trait data without considering similarity between closely related species, such similarity has a limited effect on small samples sizes. In sum, species with different dietary preferences did not differ significantly in CYP2D gene number, regardless of the lineage level at which the data were analyzed.
3.1. Gene duplication and loss events
The NJ tree of CYP2D studied here is shown in Figure 3. The result of gene tree and species tree reconciliation revealed that 29 gene duplication events and 78 gene loss events happened in these species, and 18 species have no gain or loss (Table 1). When considering diet, the result demonstrated that gene duplication or loss events were not correlated with diet. For example, when the number of duplication events was 0 or equal to or greater than 4, the diet was carnivorous, herbivorous, or omnivorous. In addition, when the number of loss events was 0, 1 or 2, the species was carnivorous, herbivorous, or omnivorous.
Figure 3.
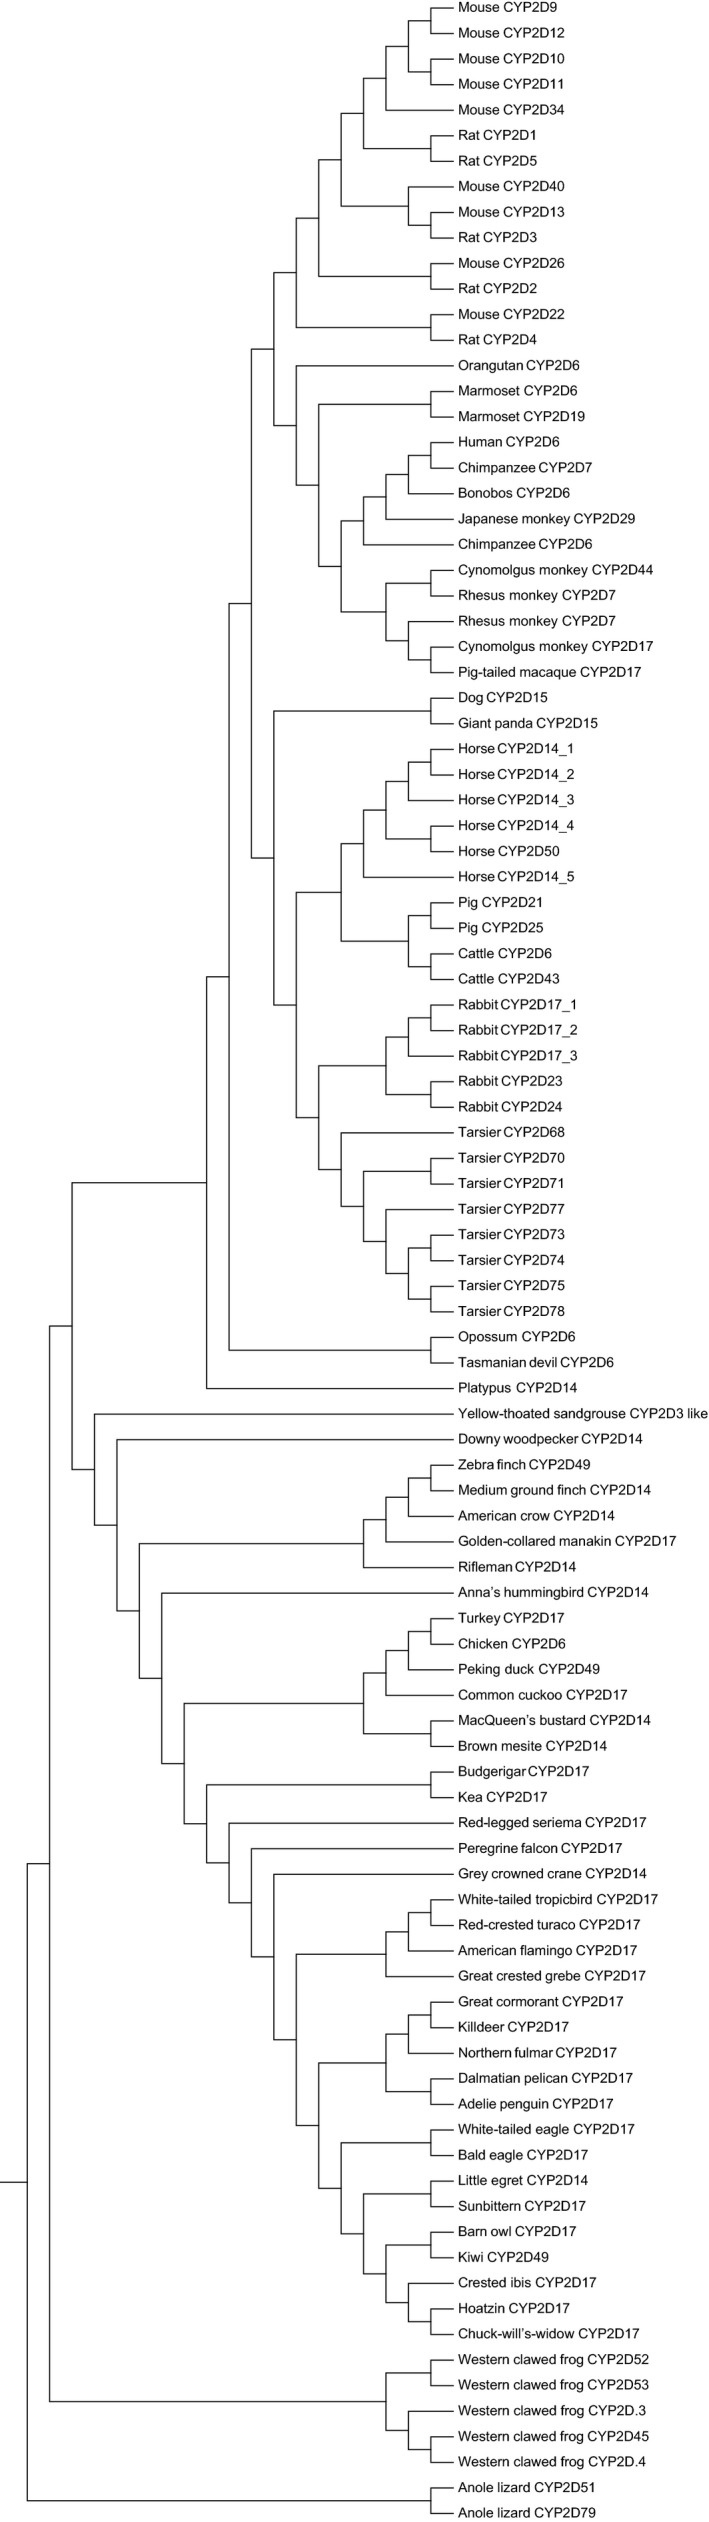
The NJ tree of all the studied enzymes to show the relationship between orthologs and paralogs of CYP2D subfamily. The enzymes of gorilla were excluded due to the failure to obtain CYP2D7. Amino acid sequence of mouse CYP2J6 was used as an outgroup
Table 1.
Times of gene duplication and loss events in CYP2D subfamily of the species studied. Diet information is also listed here for comparison
| Species | Duplications | Losses | Diet |
|---|---|---|---|
| Brown_mesite | 0 | 1 | O |
| Orangutan | 0 | 2 | O |
| MacQueen's_bustard | 0 | 1 | O |
| Tasmanian_devil | 0 | 0 | O |
| Red‐crested turaco | 0 | 1 | H |
| Sunbittern | 0 | 1 | C |
| Mouse | 4 | 0 | O |
| Human | 0 | 1 | O |
| Cynomolgus monkey | 0 | 1 | O |
| Little egret | 0 | 1 | C |
| Giant panda | 0 | 0 | H |
| Peking duck | 0 | 0 | O |
| Kea | 0 | 0 | O |
| Budgerigar | 0 | 0 | H |
| Red‐legged seriema | 0 | 3 | C |
| Crested ibis | 0 | 2 | C |
| Anole lizard | 1 | 1 | C |
| Gray crowned crane | 0 | 1 | O |
| Platypus | 0 | 0 | C |
| Medium ground finch | 0 | 0 | H |
| Marmoset | 1 | 5 | O |
| Opossum | 0 | 0 | O |
| Pig‐tailed macaque | 0 | 3 | H |
| White‐tailed tropicbird | 0 | 1 | C |
| Rat | 1 | 1 | O |
| Turkey | 0 | 0 | O |
| Japanese monkey | 0 | 2 | H |
| Killdeer | 0 | 1 | O |
| Hoatzin | 0 | 2 | H |
| Downy woodpecker | 0 | 1 | O |
| Yellow‐throated sandgrouse | 0 | 1 | H |
| Dalmatian pelican | 0 | 1 | C |
| Tarsier | 7 | 6 | C |
| American crow | 0 | 0 | O |
| Chimpanzee | 0 | 0 | O |
| Horse | 5 | 1 | H |
| Rifleman | 0 | 0 | C |
| Barn owl | 0 | 1 | C |
| Great crested grebe | 0 | 1 | C |
| Golden‐collared manakin | 0 | 0 | O |
| Adelie penguin | 0 | 1 | C |
| White‐tailed eagle | 0 | 0 | C |
| Rabbit | 4 | 1 | H |
| Great cormorant | 0 | 3 | C |
| Rhesus monkey | 0 | 2 | O |
| Peregrine falcon | 0 | 2 | C |
| Chuck‐will's‐widow | 0 | 1 | C |
| Bonobos | 0 | 4 | H |
| Kiwi | 0 | 14 | C |
| Bald eagle | 0 | 0 | C |
| Cattle | 1 | 1 | H |
| Chicken | 0 | 0 | O |
| Common cuckoo | 0 | 2 | C |
| Pig | 1 | 0 | O |
| Western clawed frog | 4 | 1 | C |
| American flamingo | 0 | 1 | C |
| Dog | 0 | 0 | C |
| Zebra finch | 0 | 0 | H |
| Anna's hummingbird | 0 | 1 | H |
| Northern fulmar | 0 | 1 | C |
| Total | 29 | 78 |
4. DISCUSSION
This study comprehensively collected information on CYP2D gene numbers across vertebrates with different diets. In total, the information on CYP2D gene numbers was obtained from 73 species, including 22 mammals from 9 orders, 49 birds from 35 orders, 1 reptile, and 1 amphibian. The details are shown in Figure 1 and the Supporting Information. From statistical analyses of the relationship between CYP2D gene number and dietary preferences, the results suggested that although in some herbivorous species (for example, the horse and rabbit), CYP2D genes showed expansion, this trend cannot be extrapolated to all vertebrates. In other words, the number of CYP2D genes did not vary with feeding habits. A number of reasons could account for the results, several of which are likely, as follows. First, according to their substrates, P450 enzymes can be sorted into either the biosynthesis or detoxification type, the latter of which contains the CYP1‐4 families (Gotoh, 2012; Kawashima & Satta, 2014), and the CYP2D subfamily is just one member of the CYP2 family responsible for toxin detoxification. Thus, the contribution of other CYP2 genes or other CYP families may affect the relationship between CYP2D gene number and dietary preferences. A previous study that analyzed the relationship between the number of CYP2 genes and diet in birds discovered that in migratory birds, omnivores had a higher number of CYP2 genes than carnivores and herbivores (Almeida et al., 2016). In a preliminary analysis using the data from Thomas (2007), the same trend was observed in mammals (data not shown). Both of these studies indicated that the gene numbers of the whole CYP2 family rather than those of only the CYP2D subfamily are associated with feeding habits. Second, Thomas (2007) suggested that throughout vertebrate evolution, CYP genes, which encode CYP450 enzymes acting upon exogenous chemicals, underwent active duplication and loss, mirroring numerous lineage‐ and species‐specific gene expansions. In addition, Sezutsu, Le Goff, and Feyereisen (2013) proposed that lineage‐specific expansions in CYP subfamilies are reflected in the distribution of CYP gene numbers within families and subfamilies. Thus, it is likely that CYP2D gene expansion did not happen at the level of vertebrates but at the species‐ and lineage‐specific levels. To test this hypothesis, a mammal group and a bird group were analyzed separately, but the result demonstrated that CYP2D gene copy numbers did not undergo lineage‐specific expansion along with diet. Thus, the pattern of evolution by birth‐ and death‐ of CYP2D genes appears to be more complex than previously appreciated. Third, other mechanisms can help to reduce the load of detoxification, which may result in smaller CYP2D gene numbers. For instance, for the number of CYP2D functional genes, an obvious difference is present between rodents and humans, with 9 and 1 genes, respectively. It is likely that for the mouse, the need for detoxification of potentially abundant toxins in the diet makes it necessary to keep several CYP2D genes active, whereas for human, the intellectual capability of avoiding the consumption of noxious substances and the passing on of information on appropriate food between generations can lead to the loss of selective pressure in maintaining the genes active (Ingelman‐Sundberg, 2005). Fourth, based on a comparison of several non‐human primates and human, the similarity range of CYP2D amino acid between non‐human primate and human is 90%–98% (He et al., 2016). In addition, different similarities will have different chances to substrate. Thus, no correlation between gene number and dietary preferences at the subfamily level could be attributed to the differentiation between amino acid similarities. Fifth, for gene duplication and loss events, Good et al. (2014) suggested that the rate of amino acid replacement was correlated with the number of P450 duplications and that gene loss could be due to the lower chemical diversity in narrower niches. In general, carnivores and herbivores are specialists, and omnivores are generalists; thus, the omnivores are confronted with more diverse chemicals, and accordingly, the number of duplications in omnivores should be greater than that in carnivores and herbivores do. However, in this study, the numbers of gene duplications and losses were not linked to dietary preferences. For example, when the number of gene duplication events was greater than or equal to 4, the feeding preferences were carnivorous (tarsier, western clawed frog), herbivorous (rabbit, horse), or omnivorous (mouse), and such a case also existed for gene loss events. Further, the conclusion of this study agreed with previous research (Sezutsu et al., 2013) proposing that the gain or loss of CYP genes did not rely on the ecological traits or life history traits of organisms, and thus, natural selection would not be predicted to be the determinant of CYP gene distribution. Finally, differences in how to deal with plant toxins might not be primarily ascribed to differentiation in the copy number of genes but instead to their isoforms, mutations, or regulation. In addition, the variation in CYP enzyme activity among different species may also affect the detoxification of diet (Rainio, Kanerva, Wahlberg, Nikinmaa, & Eeva, 2012). In sum, the gene expansion of the CYP2D subfamily is complex, and uncovering what truly acts as the driving force of CYP2D gene subfamily expansion still needs further investigation.
5. CONCLUSION
This study explored the association between the number of CYP2D subfamily genes and dietary preference and examined whether the number of genes varied according to diet. The results failed to conclude that CYP2D gene expansion was linked with diet, which means that feeding habit was not a driving force for CYP2D gene expansion. The reasons for CYP2D gene expansion are complicated, and the contribution of other CYP genes, other mechanisms reducing the load of detoxification, and differentiation between amino acid similarities may affect the relationship between CYP2D gene number and dietary preferences. The exact mechanism of the expansion still needs further study. As the genomes of increasing numbers of species are being sequenced, CYP gene data will increase, and further studies aiming to solve this problem are expected to be carried out.
AUTHOR CONTRIBUTIONS
Ping Feng conceived and designed the experiments, performed the experiments, analyzed the data, contributed reagents/materials/analysis tools, prepared figures and/or tables, authored or reviewed drafts of the paper, approved the final draft. Zhijun Liu helped to collect data, provided suggestions for this study, and approved the final draft.
DATA ACCESSIBILITY
The authors confirm that all data underlying the findings are fully available without restriction. All relevant data are presented in the paper and its Supporting Information.
Supporting information
ACKNOWLEDGMENTS
Many thanks to Hongtao Xiao for his technical assistance in R software analysis. This work was supported by the National Natural Science Foundation of China (NSFC) (grant no. 31500310 to P.F.), Scientific Research Foundation of the Higher Education Institutions of Guangxi Province, China (grant no. KY2015ZD016 to P.F.); Guangxi Key Laboratory of Rare and Endangered Animal Ecology, Guangxi Normal University (Grant No. GKN.17‐A‐01‐03); Key Laboratory of Ecology of Rare and Endangered Species and Environmental Protection (Guangxi Normal University), Ministry of Education, China (Grant No. ERESEP2017Z02), Ecological Doctoral Program Construction of Guangxi Normal University (Grant No. EDPC 2018003).
Feng P, Liu Z. Complex gene expansion of the CYP2D gene subfamily. Ecol Evol. 2018;8:11022–11030. 10.1002/ece3.4568
References
- Almeida, D. , Maldonado, E. , Khan, I. , Silva, L. , Gilbert, M. T. , Zhang, G. , … Antunes, A. (2016). Whole‐genome identification, phylogeny, and evolution of the cytochrome P450 family 2 (CYP2) subfamilies in birds. Genome Biology and Evolution, 8, 1115–1131. 10.1093/gbe/evw041 [DOI] [PMC free article] [PubMed] [Google Scholar]
- Blomberg, S. P. , Garland, T. Jr , & Ives, A. R. (2003). Testing for phylogenetic signal in comparative data: Behavioral traits are more labile. Evolution, 57, 717–745. 10.1111/j.0014-3820.2003.tb00285.x [DOI] [PubMed] [Google Scholar]
- Cooke, B. R. , Bligh, S. W. , Cybulski, Z. R. , Ioannides, C. , & Hall, M. (2012). Debrisoquine metabolism and CYP2D expression in marmoset liver microsomes. Drug Metabolism and Disposition, 40, 70–75. 10.1124/dmd.111.041566 [DOI] [PubMed] [Google Scholar]
- Demain, A. L. , & Fang, A. (2000). The natural functions of secondary metabolites. Advances in Biochemical Engineering/Biotechnology, 69, 1–39. [DOI] [PubMed] [Google Scholar]
- Durand, D. , Halldorsson, B. V. , & Vernot, B. (2006). A hybrid micro‐macroevolutionary approach to gene tree reconstruction. Journal of Computational Biology, 13, 320–335. 10.1089/cmb.2006.13.320 [DOI] [PubMed] [Google Scholar]
- Felsenstein, J. (1985). Phylogenies and the comparative method. The American Naturalist, 125, 1–15. 10.1086/284325 [DOI] [PubMed] [Google Scholar]
- Feng, P. , Zhao, H. B. , & Lu, X. (2015). Evolution of mitochondrial DNA and its relation to basal metabolic rate. Mitochondrial DNA, 26, 566–571. 10.3109/19401736.2013.873895 [DOI] [PubMed] [Google Scholar]
- Fisher, D. O. , & Owens, I. P. (2004). The comparative method in conservation biology. Trends in Ecology & Evolution, 19, 391–398. 10.1016/j.tree.2004.05.004 [DOI] [PubMed] [Google Scholar]
- Fonne‐Pfister, R. , & Meyer, U. A. (1988). Xenobiotic and endobiotic inhibitors of cytochrome P‐450dbl function, the target of the debrisoquine/sparteine type polymorphism. Biochemical Pharmacology, 37, 3829–3835. 10.1016/0006-2952(88)90063-9 [DOI] [PubMed] [Google Scholar]
- Good, R. T. , Gramzow, L. , Battlay, P. , Sztal, T. , Batterham, P. , & Robin, C. (2014). The molecular evolution of cytochrome P450 genes within and between drosophila species. Genome Biology and Evolution, 6, 1118–1134. 10.1093/gbe/evu083 [DOI] [PMC free article] [PubMed] [Google Scholar]
- Gotoh, O. (2012). Evolution of cytochrome p450 genes from the viewpoint of genome informatics. Biological & Pharmaceutical Bulletin, 35, 812–817. 10.1248/bpb.35.812 [DOI] [PubMed] [Google Scholar]
- Harestad, A. S. , & Bunnell, F. L. (1979). Home range and body‐weight‐Re‐evaluation. Ecology, 60, 389–402. 10.2307/1937667 [DOI] [Google Scholar]
- Harvey, D. , & Pagel, M. D. (1991). The comparative method in evolutionary biology. Oxford, UK: Oxford University Press. [Google Scholar]
- He, Z. X. , Chen, X. W. , Yang, Y. , & Zhou, S. F. (2016). A comparison of non‐human primate cytochrome P450 2D members and the implication in drug discovery. Current Drug Metabolism, 17, 520–527. 10.2174/1389200217666160219114241 [DOI] [PubMed] [Google Scholar]
- Hiroi, T. , Chow, T. , Imaoka, S. , & Funae, Y. (2002). Catalytic specificity of CYP2D isoforms in rat and human. Drug Metabolism and Disposition, 30, 970–976. 10.1124/dmd.30.9.970 [DOI] [PubMed] [Google Scholar]
- Ingelman‐Sundberg, M. (2005). Genetic polymorphisms of cytochrome P450 2D6 (CYP2D6): Clinical consequences, evolutionary aspects and functional diversity. The Pharmacogenomics Journal, 5, 6–13. 10.1038/sj.tpj.6500285 [DOI] [PubMed] [Google Scholar]
- Jarvis, E. D. , Mirarab, S. , Aberer, A. J. , Li, B. , Houde, P. , Li, C. , … Zhang, G. (2014). Whole‐genome analyses resolve early branches in the tree of life of modern birds. Science, 346, 1320–1331. 10.1126/science.1253451 [DOI] [PMC free article] [PubMed] [Google Scholar]
- Karban, R. , & Agrawal, A. A. (2002). Herbivore offense. Annual Review of Ecology and Systematics, 33, 641–664. 10.1146/annurev.ecolsys.33.010802.150443 [DOI] [Google Scholar]
- Karban, R. , & Baldwin, I. T. (1997). Induced responses to herbivory. Chicago, IL: University of Chicago Press; 10.7208/chicago/9780226424972.001.0001 [DOI] [Google Scholar]
- Kawashima, A. , & Satta, Y. (2014). Substrate‐dependent evolution of cytochrome P450: Rapid turnover of the detoxification‐type and conservation of the biosynthesis‐type. PLoS ONE, 9, e100059. [DOI] [PMC free article] [PubMed] [Google Scholar]
- Kirischian, N. , McArthur, A. G. , Jesuthasan, C. , Krattenmacher, B. , & Wilson, J. Y. (2011). Phylogenetic and functional analysis of the vertebrate cytochrome p450 2 family. Journal of Molecular Evolution, 72, 56–71. 10.1007/s00239-010-9402-7 [DOI] [PubMed] [Google Scholar]
- Lee, H. S. , Park, E. J. , Ji, H. Y. , Kim, S. Y. , Im, G. J. , Lee, S. M. , & Jang, I. J. (2008). Identification of cytochrome P450 enzymes responsible for N ‐dealkylation of a new oral erectogenic, mirodenafil. Xenobiotica, 38, 21–33. 10.1080/00498250701708521 [DOI] [PubMed] [Google Scholar]
- Li, D. , & Zhang, J. (2014). Diet shapes the evolution of the vertebrate bitter taste receptor gene repertoire. Molecular Biology and Evolution, 31, 303–309. 10.1093/molbev/mst219 [DOI] [PMC free article] [PubMed] [Google Scholar]
- Maddison, W. P. , & Maddison, D. R. (2017). Mesquite: A modular system for evolutionary analysis. Retrieved from http://mesquiteproject.org.
- Martignoni, M. , Groothuis, G. M. , & de Kanter, R. (2006). Species differences between mouse, rat, dog, monkey and human CYP‐mediated drug metabolism, inhibition and induction. Expert Opinion on Drug Metabolism & Toxicology, 2, 875–894. 10.1517/17425255.2.6.875 [DOI] [PubMed] [Google Scholar]
- McArthur, C. , Hagerman, A. E. , & Robbins, C. T. (1991). Physiological strategies of mammalian herbivores against plant defenses. Boca Raton, FL: CRC Press Inc. [Google Scholar]
- Murphy, W. J. , Pevzner, P. A. , & O'Brien, S. J. (2004). Mammalian phylogenomics comes of age. Trends in Genetics, 20, 631–639. 10.1016/j.tig.2004.09.005 [DOI] [PubMed] [Google Scholar]
- Nebert, D. W. , & Dalton, T. P. (2006). The role of cytochrome P450 enzymes in endogenous signalling pathways and environmental carcinogenesis. Nature Reviews Cancer, 6, 947–960. 10.1038/nrc2015 [DOI] [PubMed] [Google Scholar]
- Nelson, D. R. (2003). Comparison of P450s from human and fugu: 420 million years of vertebrate P450 evolution. Archives of Biochemistry and Biophysics, 409, 18–24. 10.1016/S0003-9861(02)00553-2 [DOI] [PubMed] [Google Scholar]
- Nelson, D. R. (2009). The cytochrome p450 homepage. Human Genomics, 4, 59–65. [DOI] [PMC free article] [PubMed] [Google Scholar]
- Nelson, D. R. , Zeldin, D. C. , Hoffman, S. M. , Maltais, L. J. , Wain, H. M. , & Nebert, D. W. (2004). Comparison of cytochrome P450 (CYP) genes from the mouse and human genomes, including nomenclature recommendations for genes, pseudogenes and alternative‐splice variants. Pharmacogenetics, 14, 1–18. 10.1097/00008571-200401000-00001 [DOI] [PubMed] [Google Scholar]
- Palmer, G. , & Reedijk, J. (1991). Nomenclature Committee of the International Union of Biochemistry (NC‐IUB). Nomenclature of electron‐transfer proteins. Recommendations 1989. Biochimica et Biophysica Acta, 1060, 599–611. [PubMed] [Google Scholar]
- R Core Team (2016). R: A language and environment for statistical computing. Vienna, Austria: R Foundation for Statistical Computing. [Google Scholar]
- Rainio, M. J. , Kanerva, M. , Wahlberg, N. , Nikinmaa, M. , & Eeva, T. (2012). Variation of basal EROD activities in ten passerine bird species–relationships with diet and migration status. PLoS ONE, 7, e33926 10.1371/journal.pone.0033926 [DOI] [PMC free article] [PubMed] [Google Scholar]
- Revell, L. J. (2012). Phytools: An R package for phylogenetic comparative biology (and other things). Methods in Ecology and Evolution, 3, 217–223. 10.1111/j.2041-210X.2011.00169.x [DOI] [Google Scholar]
- Rezen, T. , Debeljak, N. , Kordis, D. , & Rozman, D. (2004). New aspects on lanosterol 14alpha‐demethylase and cytochrome P450 evolution: Lanosterol/cycloartenol diversification and lateral transfer. Journal of Molecular Evolution, 59, 51–58. 10.1007/s00239-004-2603-1 [DOI] [PubMed] [Google Scholar]
- Roberts, M. F. , & Wink, M. (1998). Alkaloids: Biochemistry, ecology, and medicinal application. New York, NY: Plenum Press; 10.1007/978-1-4757-2905-4 [DOI] [Google Scholar]
- Rohlfs, R. V. , & Nielsen, R. (2015). Phylogenetic ANOVA: The expression variance and evolution model for quantitative trait evolution. Systematic Biology, 64, 695–708. 10.1093/sysbio/syv042 [DOI] [PMC free article] [PubMed] [Google Scholar]
- Sezutsu, H. , Le Goff, G. , & Feyereisen, R. (2013). Origins of P450 diversity. Philosophical Transactions of the Royal Society of London. Series B, Biological Sciences, 368, 20120428 10.1098/rstb.2012.0428 [DOI] [PMC free article] [PubMed] [Google Scholar]
- Sullivan, R. J. , Hagen, E. H. , & Hammerstein, P. (2008). Revealing the paradox of drug reward in human evolution. Proceedings of the Royal Society B‐Biological Sciences, 275, 1231–1241. 10.1098/rspb.2007.1673 [DOI] [PMC free article] [PubMed] [Google Scholar]
- Tamura, K. , Stecher, G. , Peterson, D. , Filipski, A. , & Kumar, S. (2013). MEGA6: Molecular evolutionary genetics analysis version 6.0. Molecular Biology and Evolution, 30, 2725–2729. 10.1093/molbev/mst197 [DOI] [PMC free article] [PubMed] [Google Scholar]
- Thomas, J. H. (2007). Rapid birth‐death evolution specific to xenobiotic cytochrome P450 genes in vertebrates. PLoS Genetics, 3, e67 10.1371/journal.pgen.0030067 [DOI] [PMC free article] [PubMed] [Google Scholar]
- Uno, Y. , Iwasaki, K. , Yamazaki, H. , & Nelson, D. R. (2011). Macaque cytochromes P450: Nomenclature, transcript, gene, genomic structure, and function. Drug Metabolism Reviews, 43, 346–361. 10.3109/03602532.2010.549492 [DOI] [PubMed] [Google Scholar]
- Uno, Y. , Uehara, S. , Kohara, S. , Murayama, N. , & Yamazaki, H. (2010). Cynomolgus monkey CYP2D44 newly identified in liver, metabolizes bufuralol, and dextromethorphan. Drug Metabolism and Disposition, 38, 1486–1492. 10.1124/dmd.110.033274 [DOI] [PubMed] [Google Scholar]
- Wang, H. , & Tompkins, L. M. (2008). CYP2B6: New insights into a historically overlooked cytochrome P450 isozyme. Current Drug Metabolism, 9, 598–610. 10.2174/138920008785821710 [DOI] [PMC free article] [PubMed] [Google Scholar]
- Wang, K. , & Zhao, H. B. (2015). Birds generally carry a small repertoire of bitter taste receptor genes. Genome Biology and Evolution, 7, 2705–2715. 10.1093/gbe/evv180 [DOI] [PMC free article] [PubMed] [Google Scholar]
- Yasukochi, Y. , & Satta, Y. (2011). Evolution of the CYP2D gene cluster in humans and four non‐human primates. Genes & Genetic Systems, 86, 109–116. 10.1266/ggs.86.109 [DOI] [PubMed] [Google Scholar]
- Yasukochi, Y. , & Satta, Y. (2015). Molecular evolution of the CYP2D subfamily in primates: Purifying selection on substrate recognition sites without the frequent or long‐tract gene conversion. Genome Biology and Evolution, 7, 1053–1067. 10.1093/gbe/evv056 [DOI] [PMC free article] [PubMed] [Google Scholar]
- Zhao, H. , Li, J. , & Zhang, J. (2015). Molecular evidence for the loss of three basic tastes in penguins. Current Biology, 25, R141–R142. 10.1016/j.cub.2015.01.026 [DOI] [PMC free article] [PubMed] [Google Scholar]
- Zuber, R. , Anzenbacherova, E. , & Anzenbacher, P. (2002). Cytochromes P450 and experimental models of drug metabolism. Journal of Cellular and Molecular Medicine, 6, 189–198. 10.1111/j.1582-4934.2002.tb00186.x [DOI] [PMC free article] [PubMed] [Google Scholar]
Associated Data
This section collects any data citations, data availability statements, or supplementary materials included in this article.
Supplementary Materials
Data Availability Statement
The authors confirm that all data underlying the findings are fully available without restriction. All relevant data are presented in the paper and its Supporting Information.