Abstract
Vesicular carriers transport proteins and lipids from one organelle to another, recognizing specific identifiers for the donor and acceptor membranes. Two important identifiers are phosphoinositides and GTP-bound GTPases, which provide well-defined but mutable labels. Phosphatidylinositol and its phosphorylated derivatives are present on the cytosolic faces of most cellular membranes1,2. Reversible phosphorylation of its headgroup produces seven distinct phosphoinositides. In endocytic traffic, phosphatidylinositol-4,5-biphosphate marks the plasma membrane, and phosphatidylinositol-3-phosphateand phosphatidylinositol-4-phosphate mark distinct endosomal compartments2,3. It is unknown what sequence of changes in lipid content confers on the vesicles their distinct identity at each intermediate step. Here we describe ‘coincidence-detecting’ sensors that selectively report the phosphoinositide composition of clathrin-associated structures, and the use of these sensors to follow the dynamics of phosphoinositide conversion during endocytosis. The membrane of an assembling coated pit, in equilibrium with the surrounding plasma membrane, contains phosphatidylinositol-4,5-biphosphate and a smaller amount of phosphatidylinositol-4-phosphate.Closure of the vesicle interrupts free exchange with the plasma membrane. A substantial burst of phosphatidylinositol-4-phosphate immediately after budding coincides with a burst of phosphatidylinositol-3-phosphate, distinct from any later encounter with the phosphatidylinositol-3-phosphate pool in early endosomes; phosphatidylinositol-3,4-biphosphate and the GTPase Rab5 then appear and remain as the uncoating vesicles mature into Rab5-positive endocytic intermediates. Our observations show that a cascade of molecular conversions, made possible by the separation of a vesicle from its parent membrane, can label membrane-traffic intermediates and determine their destinations.
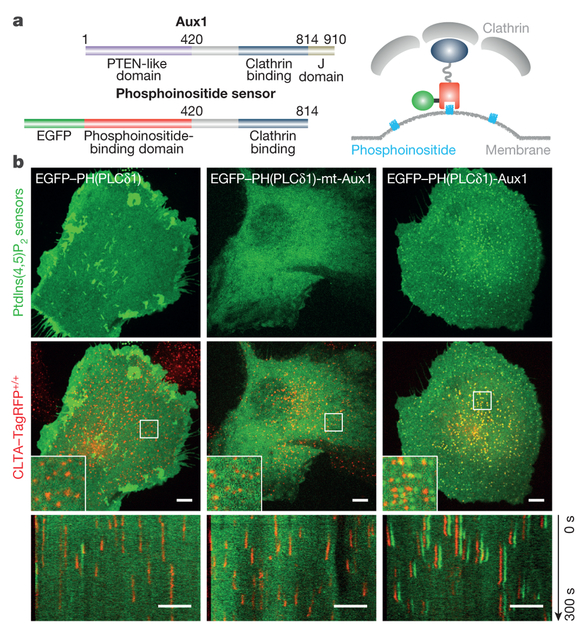
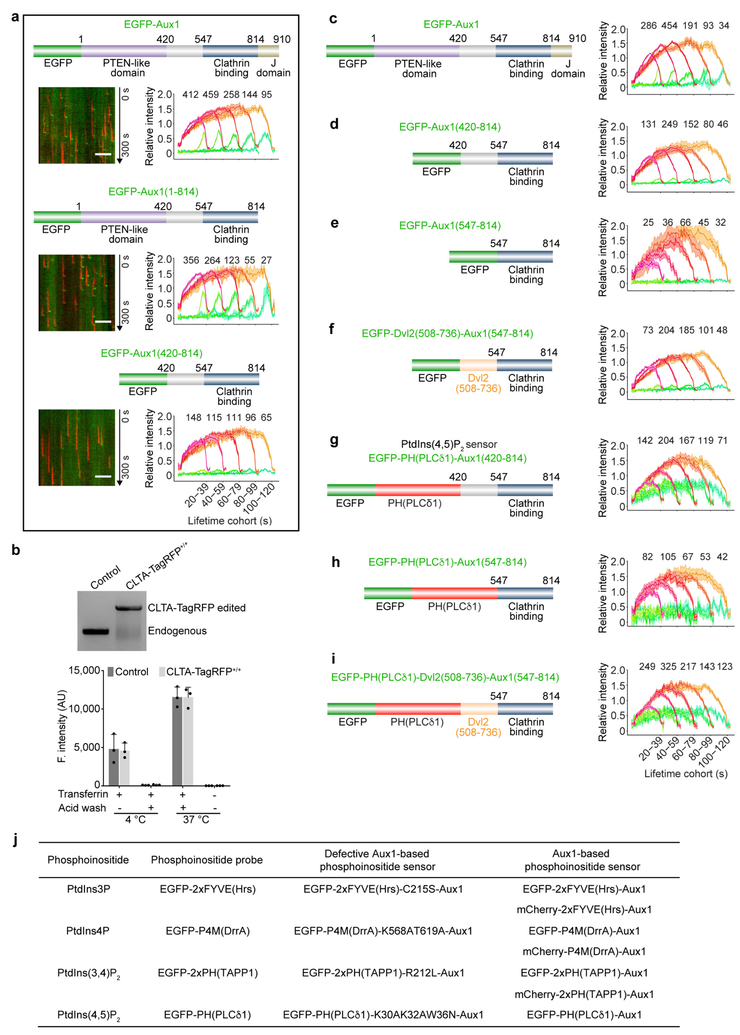
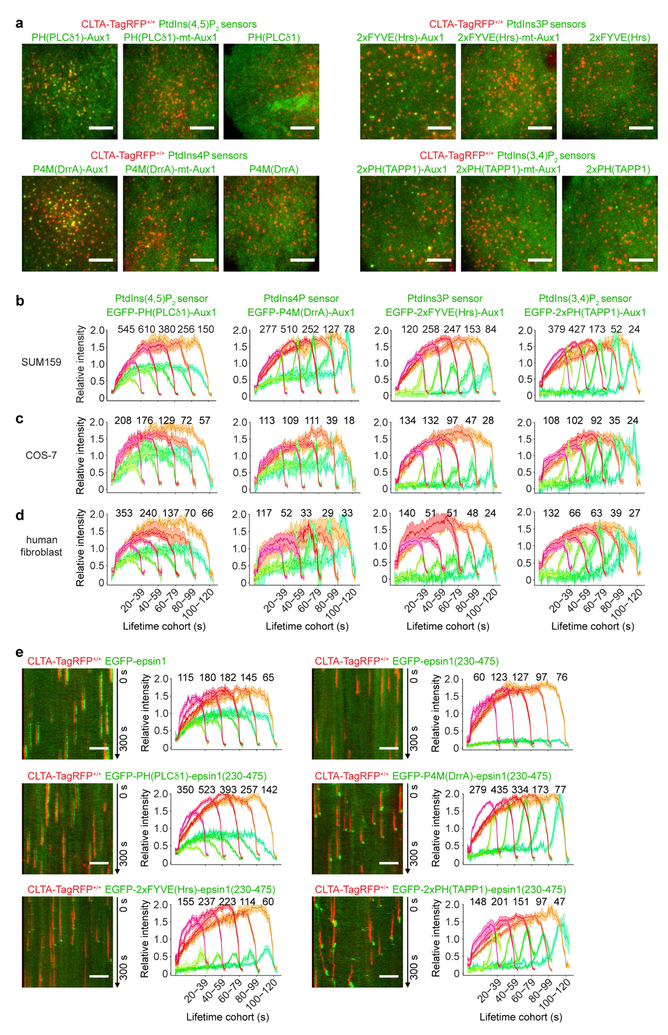
To design the new sensors, we capitalized on the way in which auxilin and epsin associate with clathrin coats4–6. Auxilins (in mammalian cells, auxilin1 (Aux1) and auxilin2 or GAK) require both a clathrin-binding domain and a phosphatase and tensin homologue (PTEN)-like domain for effective recruitment to newly budded clathrin-coated vesicles4,7,8 (Extended Data Fig. 1a, Supplementary Video 1). Binding to clathrin depends on the geometry of the clathrin lattice9, and neither domain is effective on its own at normal intracellular concentrations. Epsin also has both clathrin-binding and lipid-binding domains5,6. We proposed previously that the auxilin PTEN-like domain interacts with a specific phosphoinositide in the coat-engulfed membrane and that auxilins are effectively coincidence detectors4. We have therefore prepared a series of sensors (Extended Data Figs 1–4) in which a phosphoinositide-binding domain of known specificity is combined with the Auxl (Fig. 1a, Extended Data Fig. 1j) or epsinl (Extended Data Fig. 4e) clathrin-binding domain and an enhanced GFP (EGFP) or mCherry fluorophore. We validated their properties as described in Extended Data Figs 1–4 and the Supplementary Discussion.
Figure 1 |. Cellular localization of phosphoinositide-specific, auxilinl-based PtdIns(4,5)P2 sensors.
a, Left, domain organization of mammalian Auxl and of fluorescently tagged Auxl-based phosphoinositide sensors. Right, diagram of sensor-coat association. b, Localization of a general PtdIns(4,5)P2 sensor (EGFP-PH(PLCδl)), a mutated Auxl-based PtdIns(4,5)P2 sensor defective in binding PtdIns(4,5)P2 (EGFP-PH(PLCδl)-mt-Auxl), and a wild-type Auxl-based PtdIns(4,5)P2 sensor (EGFP-PH(PLCδl)-Auxl). Top, distribution of PtdIns(4,5)P2 sensor at a single time point; middle, CLTA-TagRFP superposed on PtdIns(4,5)P2 sensor (green), including enlarged region (square box); bottom, corresponding kymographs from 300-s time series imaged every 2 s by spinning-disk confocal microscopy. EGFP channel in the enlarged regions and kymographs shifted laterally by six pixels. Images are representative of at least three independent experiments. Scale bars, 5 μm.
In most experiments, we followed recruitment of these sensors in gene-edited SUM159 cells expressing the clathrin light chain A joined to the fluorescent marker TagRFP (CLTA-TagRFP) (Extended Data Fig. 1b). Cells were imaged by total internal reflection fluorescence (TIRF) microscopy, with illumination at an angle chosen to decrease sensitivity to sample depth but to increase sensitivity with respect to spinning-disk confocal fluorescence microscopy. We used a previously developed 2D-tracking computational framework for automated detection and tracking of the fluorescently tagged coated structures10. To follow the sensors on internal membranes, we used a lattice light-sheet microscope11 to visualize the full cellular volume.
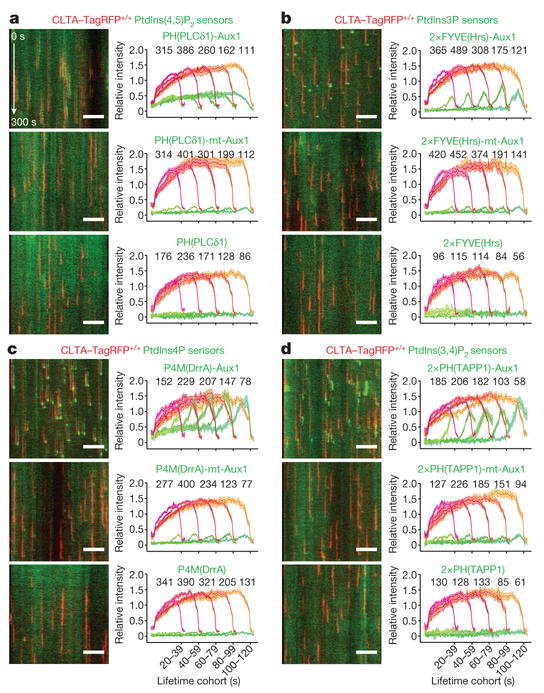
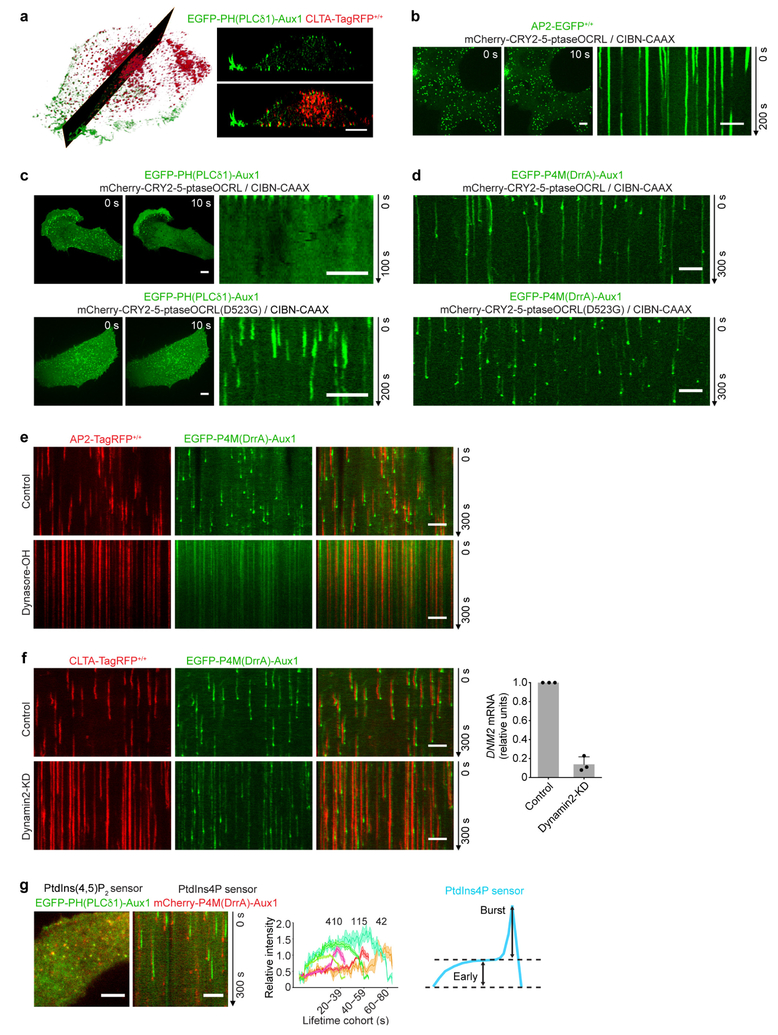
The phosphatidylinositol-4,5-biphosphate (PtdIns(4,5)P2) fluorescent sensor EGFP-PH(PLCδ1)-Aux1 was present in all plasma membrane coated pits of CLTA-TagRFP+/+ cells (Fig. 1b, Extended Data Fig. 4a, Supplementary Video 2). Unlike intact Aux1, which appears in a burst immediately after scission of a coated vesicle from the plasma membrane (Extended Data Fig. 1a, Supplementary Video 1), the sensor accumulated in clathrin-coated pits as they formed, followed by a gradual loss coinciding with disassembly of the clathrin coat (Figs 1b, 2a). The sensor did not associate with any clathrin-coated structures in endosomal membranes or in the trans-Golgi network (Extended Data Fig. 2a), both of which lack substantial concentrations of PtdIns(4,5)P22,3. As a control for the phosphoinositide-binding specificity of the PtdIns(4,5)P2 sensor, we showed that it failed to appear in coated pits if we introduced point mutations into the PH(PLCδ1) domain that are known to prevent PtdIns(4,5)P2 binding12,13 (Figs 1b, 2a). Moreover, EGFP-PH(PLCδ1) alone accumulated throughout the plasma membrane and not in fluorescence-enriched spots that colocalized with clathrin-coated pits (Figs 1b, 2a, Supplementary Video 2). In the plasma membrane, PtdIns(4,5)P2 is essential for initiating and sustaining assembly of endocytic coated pits14–16. Depletion of plasma membrane PtdIns(4,5)P2 by rapid, light-activated transfer of the inositol 5-phosphatase module of inositol polyphosphate 5-phosphatase OCRL from the cytosol to the plasma membrane14 prevented new AP2 adaptor complex fluorescent spots from appearing (no initiation of endocytic coated pits) and stalled those already present (no maturation of pits) (Extended Data Fig. 2b). The PtdIns(4,5)P2 sensor was not recruited to the stalled pits—a stringent test of its lipid specificity (Extended Data Fig. 2c).
Figure 2 |. Recruitment of phosphoinositide sensors reflects lipid composition of endocytic clathrin-coated structures.
Bottom surfaces of CLTA-TagRFP+/+ cells transiently expressing EGFP-tagged sensors specific for PtdIns(4,5)P2 (a), PtdIns3P (b), PtdIns4P (c) and PtdIns(3,4)P2 (d), imaged by TIRF microscopy every 1 s for 300 s and traces analysed by automated 2D tracking. The representative kymographs cover the entire time series. The EGFP channel in the kymographs was shifted laterally by six pixels. The plots show averaged fluorescence intensity traces (mean ± s.e.m.) of CLTA-TagRFP and phosphoinositide sensor, grouped by cohorts according to lifetimes. The numbers of analysed traces are shown above each cohort; the numbers of cells were 12, 10 and 11 (a); 12, 9 and 10 (b); 9, 10 and 12 (c); and 21, 8 and 10 (d). Data are representative of at least two independent experiments. Scale bars, 5 μm.
The phosphatidylinositol-3-phosphate (PtdIns3P) sensor EGFP-2 × FYVE(Hrs)-Aux1 appeared in a burst that coincided with clathrin coat disassembly (Fig. 2b, Supplementary Video 3). The Aux1 clathrin-binding domain ensured specificity of the sensor for clathrin-containing structures (Fig. 2b). There was no sensor recruitment for a disabled variant with mutations in the PtdIns3P binding site17 (Fig. 2b, Extended Data Fig. 4a). The PtdIns3P sensor recruitment mimicked the normal pattern of Aux1 association4,7: absent from assembling coated pits and appearing in a burst immediately after dynamin-catalysed release of coated vesicles (Extended Data Fig. 1a).
The phosphatidylinositol-4-phosphate (PtdIns4P) sensor EGFP-P4M(DrrA)-Aux1 accumulated at a low, steady rate along with clathrin and AP2, and then, like native Aux14,7, appeared in an acute burst just after budding (Fig. 2c, Extended Data Fig. 2e–g, Supplementary Video 4). The burst required membrane scission, as it was absent from the stalled (that is, persistent) coated pits in cells treated with the small-molecule dynamin inhibitor dynasore-OH or depleted of dynamin2 by small interfering RNA (siRNA) (Extended Data Fig. 2e, f). EGFP-P4M(DrrA)18, which lacked the clathrin-binding region, labelled the plasma membrane diffusely (Extended Data Fig. 4a) as well as the Golgi apparatus and late endosomes/lysosomes. We confirmed the specificity of PtdIns4P binding by mutation of PtdIns4P binding residues19 (Fig. 2c). In cells subjected to acute light-activated depletion of PtdIns(4,5)P2, PtdIns4P appeared in pits stalled by loss of PtdIns(4,5)P2, but the PtdIns4P burst accompanying uncoating did not occur (Extended Data Fig. 2d). PtdIns4P bursts appeared after membrane scission in the coated vesicles that had formed at the onset of light-activated depletion, when PtdIns(4,5)P2 had not yet been sufficiently depleted.
We enhanced the temporal precision of measurements between the onset of the loss of signal from the PtdIns(4,5)P2 sensor and the burst of signal from the PtdIns4P sensor by co-expressing the PtdIns(4,5)P2 and PtdIns4P sensors in the same cells (Extended Data Fig. 2g). PtdIns(4,5)P2 had begun to disappear at the time of onset of the PtdIns4P burst, which immediately followed conversion of a coated pit into a coated vesicle.
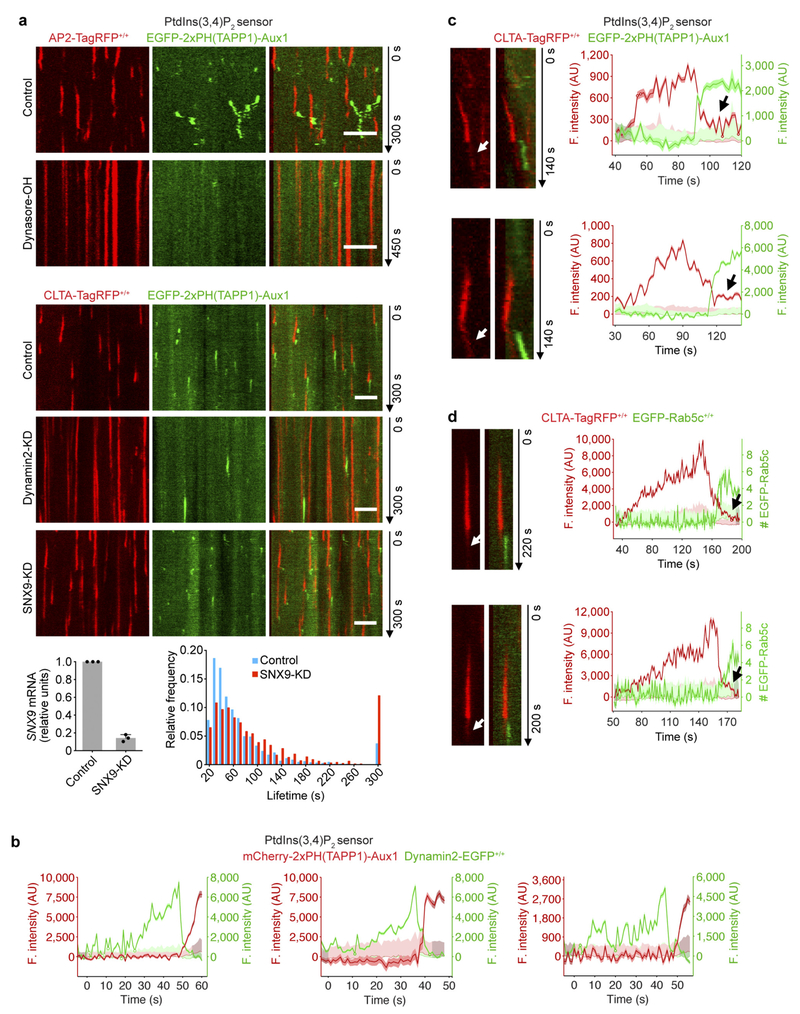
The PtdIns(3,4)P2 sensor, EGFP-2×PH(TAPP1)-Aux1, appeared in coated vesicles but not in coated pits; the association remained even after uncoating had finished (Fig. 2d, Supplementary Video 5). Depletion from coated pits of the proposed PtdIns(3,4)P2 effector SNX920 did not induce capture of the PtdIns(3,4)P2 sensor (Extended Data Fig. 5a), showing that protection of PtdIns(3,4)P2 by SNX9 cannot account for sensor exclusion. Acute dynamin accumulation leads to membrane scission, transforming the coated pit into a vesicle and releasing it from the plasma membrane21,22. In gene-edited dynamin2-EGFP+/+ SUM159 cells21, recruitment of the PtdIns(3,4)P2 sensor began only after the burst accumulation of dynamin2-EGFP was complete (Extended Data Fig. 5b), consistent with absence of the PtdIns(3,4)P2 sensor from stalled coated pits in cells treated with dynasore-OH or depleted of dynamin2 (Extended Data Fig. 5a). The onset of recruitment of the PtdIns(3,4)P2 sensor coincided with vesicle release from the plasma membrane, and continued during the subsequent loss of the clathrin signal (Fig. 2d, Extended Data Fig. 5a, Supplementary Video 5). Unlike the burst recruitment of Aux1 or of the PtdIns3P and PtdIns4P sensors, the PtdIns(3,4)P2 sensor remained associated with the vesicular carrier even after uncoating had ended (Fig. 2d, Extended Data Fig. 5a). This late association of the PtdIns(3,4)P2 sensor with the uncoated vesicles was possible because a few clathrin molecules remained on the uncoated vesicle (Extended Data Fig. 5c, d). As with the other sensors, we confirmed the specificity of the PtdIns(3,4)P2 sensor by showing that a version with mutations at the positions of PtdIns(3,4)P2-binding residues23 failed to appear in coated structures (Fig. 2d).
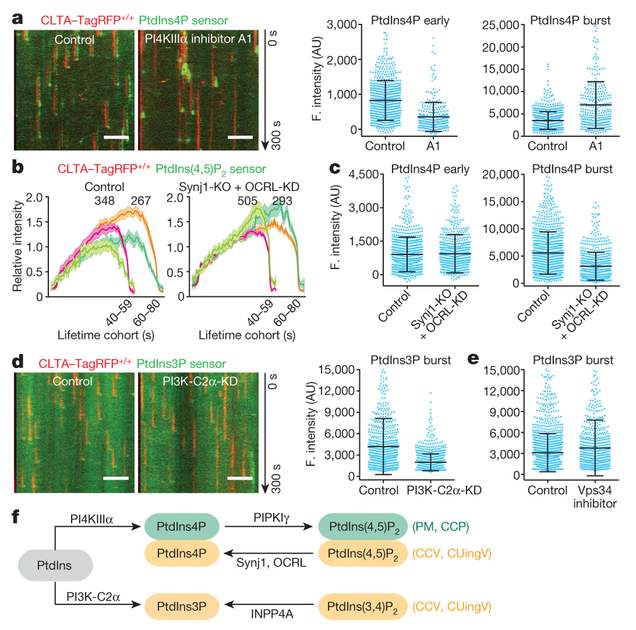
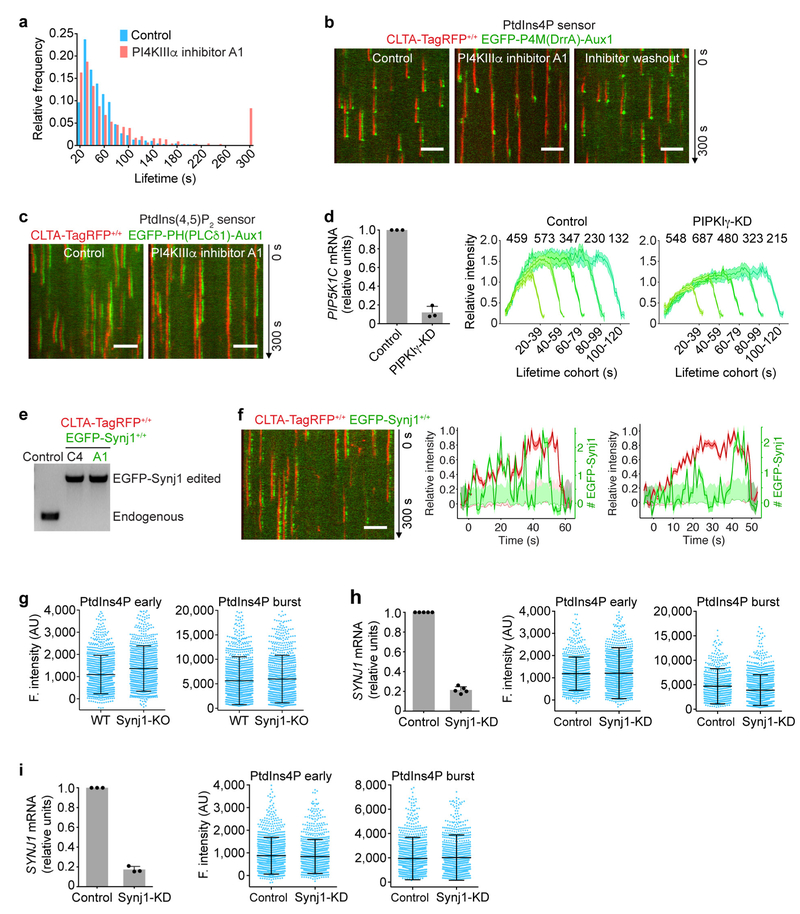
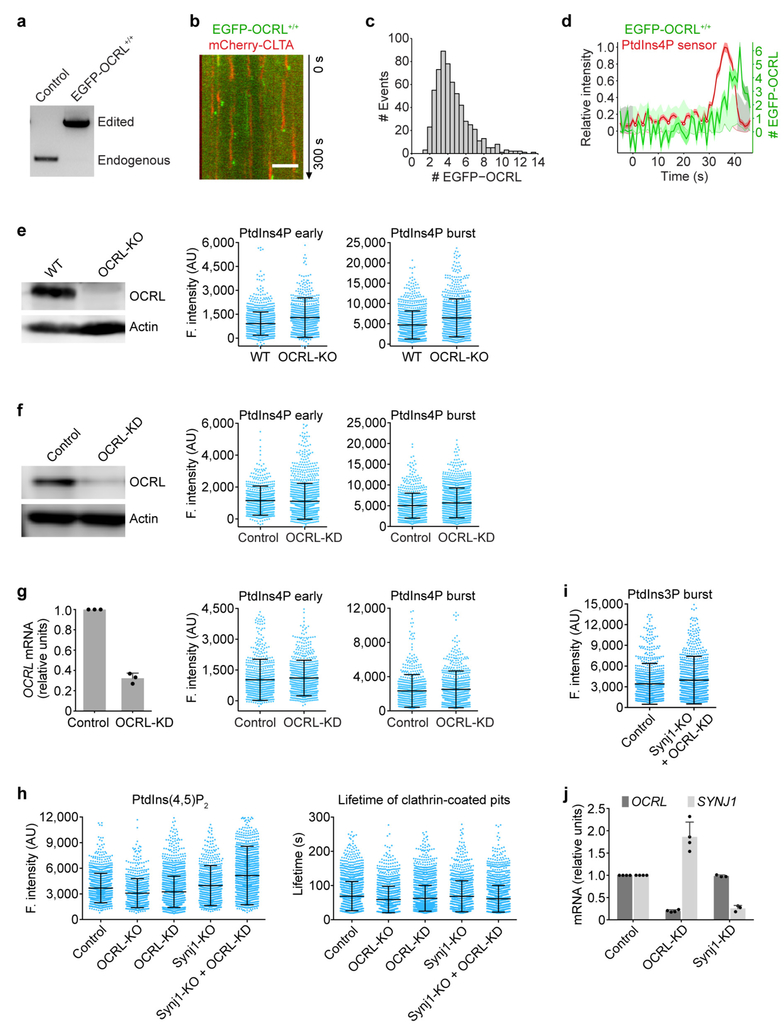
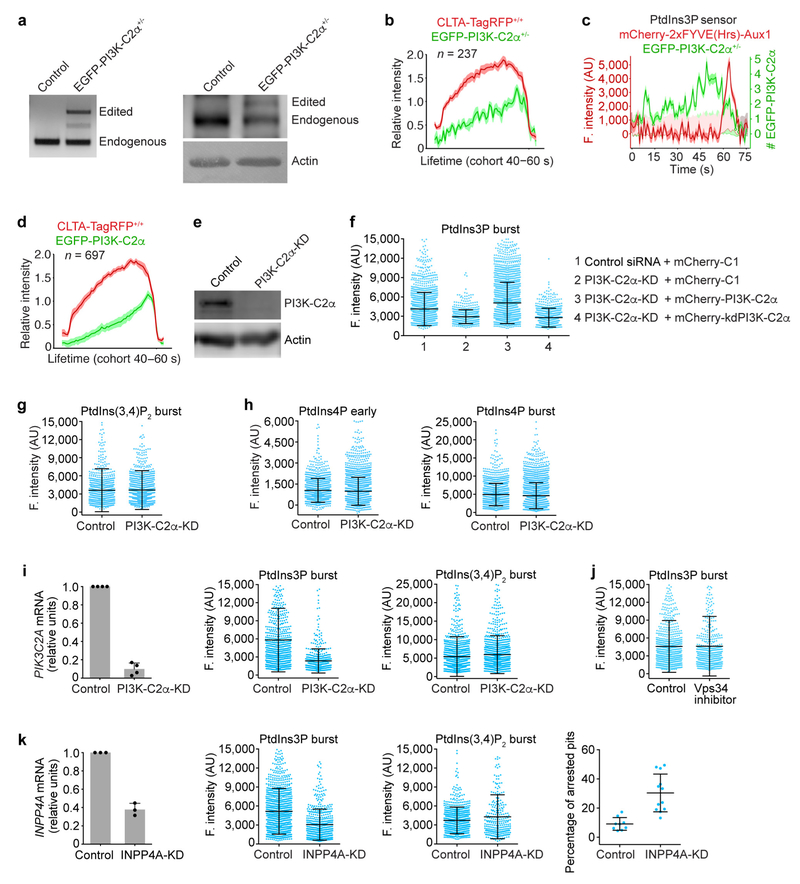
The presence in most cells of multiple enzymes for catalysing specific phosphoinositide interconversions suggests functional redundancy in generating the phosphoinositide dynamics just outlined. As described in more detail in Fig. 3, Extended Data Figs 6–8 and the Supplementary Discussion, we used gene editing and partial knockdown (KD) with RNAi to test for potential roles for phosphatidylinositol 4-kinase type IIIα (PI4KIIIα), phosphatidylinositol 4-phosphate 5-kinase type Iγ (PIPKIγ), synaptojanin1 (Synj1) and OCRL in the reactions that affect coated pits and their scission, and potential roles for the class II phosphatidylinositol 3-kinase C2α (PI3K-C2α), the class III phosphatidylinositol 3-kinase Vps34 and inositol polyphosphate-4-phosphatase type I (INPP4A) in generating PtdIns3P in coated vesicles. Our data indicate that PI4KIIIα and PIPKIγ generate PtdIns4P and a fraction of PtdIns(4,5)P2 in coated pits at the plasma membrane (Fig. 3a, Extended Data Fig. 6a–d) and that both Synj1 and OCRL—phosphatases that have been suggested to be part of the conversion cascade24,25—are major sources of the compositional changes we detect in PtdIns(4,5)P2 and PtdIns4P (Fig. 3b, c, Extended Data Fig. 7h). These enzymes thus appear to have redundant functions in the cells we have used, even though their arrival times at the coated structures overlapped only partly: Synj1 recruitment began during coated pit formation and continued as uncoating proceeded (Extended Data Fig. 6e, f), while OCRL recruitment began at the onset of uncoating (Extended Data Fig. 7a–d). We have also identified the kinase PI3K-C2α and the phosphatase INPP4A as the enzymes that generate PtdIns3P from phosphatidylinositol and PtdIns(3,4)P2 in coated vesicles (Fig. 3d, Extended Data Fig. 8). We have not yet identified the enzyme(s) that generate PtdIns(3,4)P2 in coated vesicles.
Figure 3 |. Interference of phosphoinositol kinases and phosphatases on phosphoinositide content of endocytic clathrin-coated structures.
a, Inhibition of PI4KIIIα lowered accumulation of PtdIns4P sensor during coated pit assembly. CLTA-TagRFP+/+ cells stably expressing the PtdIns4P sensor EGFP-P4M(DrrA)-Aux1 were treated with dimethyl sulfoxide (DMSO; control) or the PI4KIIIα inhibitor A1. Representative kymographs and sensor intensities from 738 and 303 traces from 5 control and 14 treated cells, respectively. A1 significantly decreased early PtdIns4P content (Cohen’s d = 0.89) and increased burst amplitude (Cohen’s d = 1.06). b, Eliminating Synj1 and depleting OCRL by 80% increased recruitment of the PtdIns(4,5)P2 sensor to clathrin-coated structures. The PtdIns(4,5)P2 sensor EGFP-PH(PLCδ1)-Aux1 was transiently expressed in control or Synj1-knockout (KO) CLTA-TagRFP+/+ cells treated with control or OCRL siRNA (OCRL-KD). Plots show averaged fluorescence (F.) intensity traces of clathrin and the PtdIns(4,5)P2 sensor associated with endocytic coated pits, including the numbers of analysed traces from 10 control and 11 Synj1-KO + OCRL-KD cells. c, Synj1-KO + OCRL-KD diminished PtdIns4P sensor burst during uncoating (Cohen’s d = 0.72) but had no effect on early PtdIns4P content of coated pits (Cohen’s d = 0.04); 895 and 704 traces from 9 control and 11 Synj1-KO + OCRL-KD cells, respectively. d, PI3K-C2α knockdown in CLTA-TagRFP+/+ cells stably expressing PtdIns3P sensor EGFP-2×FYVE(Hrs)-Aux1 significantly decreased the late burst of sensor (Cohen’s d = 0.81); 769 and 1,004 traces from 11 control and 13 PI3K-C2α-KD cells, respectively. e, Inhibition of Vps34 by PIK-III in CLTA-TagRFP+/+ cells expressing the PtdIns3P sensor EGFP-2×FYVE(Hrs)-Aux1 had a minor effect on sensor burst (Cohen’s d = 0.21); 1,695 and 742 traces from 7 control and 7 treated cells, respectively. f, Phosphoinositide kinases and phosphatases responsible for phosphoinositide interconversion in clathrin-mediated endocytic traffic. CCP, clathrin-coated pit; CCV, clathrin-coated vesicle; CUingV, clathrin-coated vesicle undergoing uncoating; PM, plasma membrane. Data from TIRF microscopy (300 s, 1-s intervals); EGFP signal in the kymographs laterally shifted six pixels. Scale bars, 5 μm. See Methods for statistics.
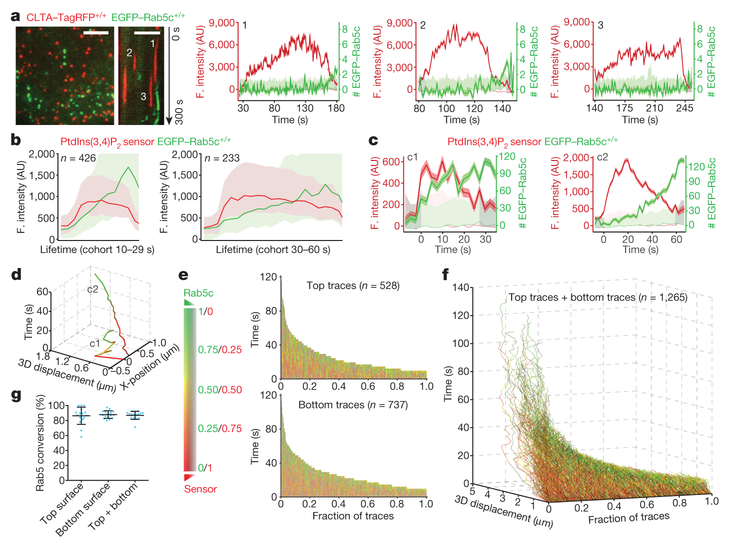
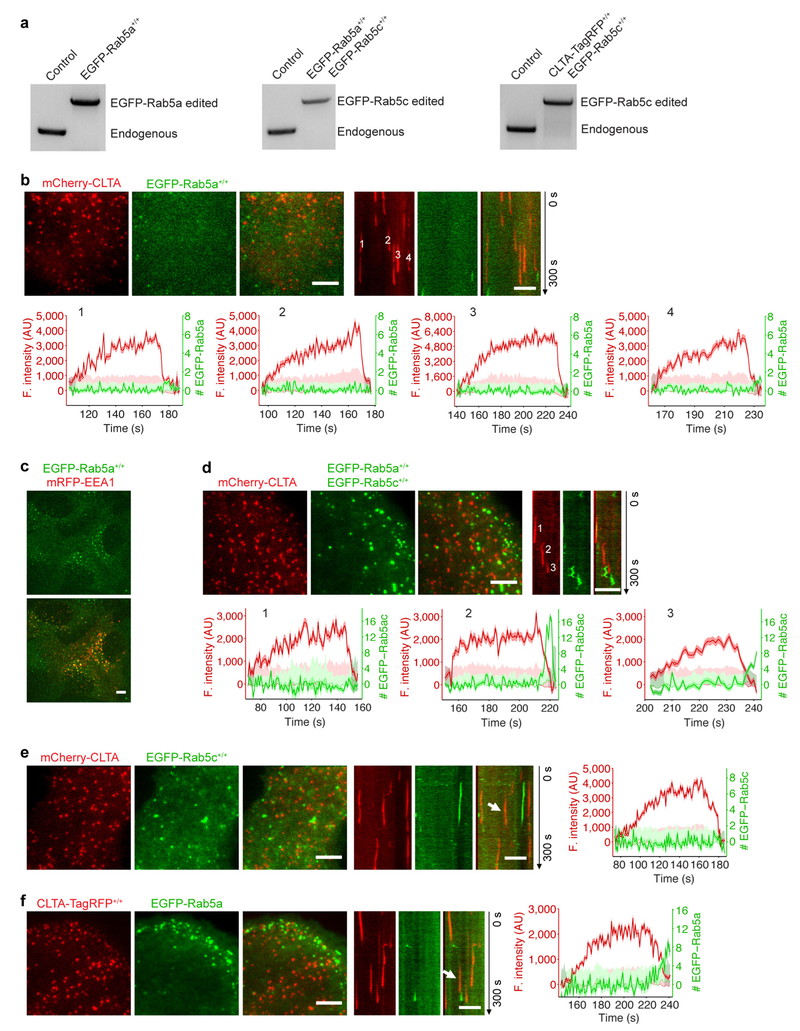
Rab5 is an early endosome-specific small GTPase26. We made three gene-edited SUM159 cell lines: EGFP-Rab5a+/+, expressing EGFP-Rab5a at both alleles; EGFP-Rab5c+/+, expressing EGFP-Rab5c at both alleles; and EGFP-Rab5a+/+ EGFP-Rab5c+/+, expressing both tagged proteins at all four alleles (Extended Data Fig. 9a). In no case did we detect any EGFP-Rab5 molecules in coated pits or coated vesicles, even using TIRF with single-molecule sensitivity (Fig. 4a, Extended Data Fig. 9b, d, Supplementary Video 6). The onset of Rab5 recruitment coincided in a few instances with the very end of uncoating (Fig. 4a, Extended Data Fig. 9b, d), but the TIRF geometry did not allow us to follow most of the uncoated vesicles as they moved into the cell. We obtained similar results in gene-edited human SVGA cells27 (Extended Data Fig. 9e) and in SUM159 cells transiently expressing EGFP-Rab5a (Extended Data Fig. 9f). As expected, we also found EGFP-Rab5a in small endosomal vesicles in the cell interior (Extended Data Fig. 9c).
Figure 4 |. Recruitment of Rab5 to clathrin-derived endocytic carriers.
a, Left, image and kymograph from TIRF microscopy (300 s, 1-s intervals, single-EGFP sensitivity) near the leading edge of the bottom surface of a cell double gene-edited for CLTA-TagRFP+/+ and EGFP-Rab5c+/+, showing the absence of Rab5c in endocytic clathrin-coated pits; EGFP signal in the kymograph shifted laterally by six pixels. Scale bars, 5 μm. Right, representative fluorescence intensity traces for clathrin and Rab5c (thicker lines), corresponding local backgrounds (thin lines) and number of recruited Rab5c molecules. Dark and light shaded areas: estimated uncertainties for detected intensity (s.d.) and significance threshold above background (~2 s.d.). Intensities during the intervals preceding and following the first and last detected signals (shaded regions) returned to background, confirming detection of independent events. Representative data from three independent experiments. b,3D lattice light-sheet microscopy imaging of gene-edited SUM159 cells expressing EGFP-Rab5c+/+ and the PtdIns(3,4)P2 sensor mCherry-2×PH(TAPP1)-Aux1. Averaged fluorescence intensity traces (mean ± s.e.m.) from two independent experiments (16 cells) showing recruitment profiles for traceable events lasting 10–29 s (left, 426 traces) and 30–60 s (right, 233 traces). c, Representative fluorescence intensities from two carriers (c1 and c2) from the cohort in b, computationally tracked in 3D until the object entered a region of high Rab5c-positive density. d, Tracks for c1 and c2, colour-coded as the Rab5c to PtdIns(3,4) P2 sensor ratio, showing time course of 3D displacement from initial positions. e, Cumulative time distributions for all 3D tracks regardless of lifetimes, colour-coded as the Rab5c to PtdIns(3,4)P2 sensor ratio; events grouped into those from top and bottom (attached) cell surfaces (16 cells). f, Distribution of 3D displacements for all 3D tracks from e. g, Recruitment of Rab5c by PtdIns(3,4)P2-containing, clathrin-derived endocytic carriers, grouped as events emanating from the top, bottom or both cell surfaces. Each data point represents results for a single cell (mean ± s.d., 16 cells).
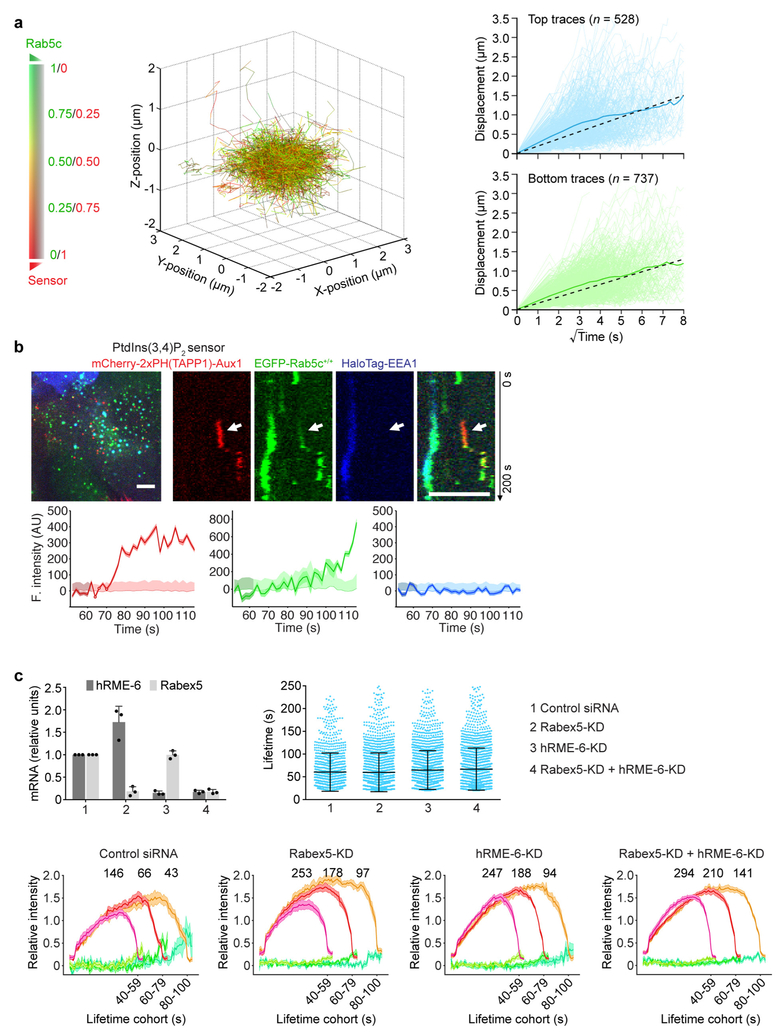
To follow uncoated vesicles after they moved away from the cell surface, we used lattice light-sheet microscopy to study the colocalization of Rab5 and the PtdIns(3,4)P2 sensor. Regardless of the cell surface from which they budded (Fig. 4g), about 85% of the vesicles recruited EGFP-Rab5c, with dynamics exemplified by the cohort analysis in Fig. 4b and the tracings in Fig. 4c–f. In all cases, a gradual increase in the EGFP-Rab5c signal overlapped with a steady loss of the PtdIns(3,4)P2 sensor, as shown by the heat map in Fig. 4e. The 3D information also allowed us to track the relative displacement of the vesicles during this period (Fig. 4f). In general, the vesicles diffused with undirected, 3D Brownian motion before acquiring Rab5c but switched to directed motion soon thereafter (Fig. 4d, f, Extended Data Fig. 10a, Supplementary Video 7); their translational speed then became too high for further tracking. These observations show that uncoated endocytic vesicles recruit Rab5 before they fuse with a Rab5-positive early endosome (Extended Data Fig. 10b). This recruitment depends on the Rab5 exchange factors hRME-6 and Rabex5 (Extended Data Fig. 10c and Supplementary Discussion).
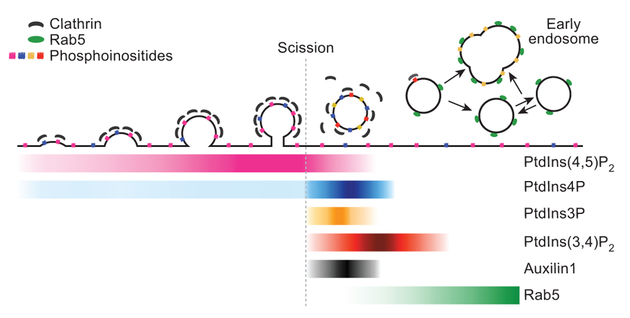
We summarize in Fig. 5 the appearance and disappearance of PtdIns(4,5)P2, PtdIns3P, PtdIns4P and PtdIns(3,4)P2 during the clathrin assembly-disassembly cycle. The events analysed begin with the assembly of coated pits at the plasma membrane, continue with the pinching off of coated vesicles and subsequent loss of the clathrin coat, and end with directional translocation of the uncoated vesicles to endosomes. The phosphoinositide content of the membrane of a nascent coated pit directly reflects the PtdIns(4,5)P2 and PtdIns4P composition of the surrounding plasma membrane, but it changes immediately after budding, with a succession of alterations in the levels of PtdIns(4,5)P2, PtdIns3P, PtdIns4P and PtdIns(3,4)P2 between the time a coated vesicle buds and the time uncoating is complete. The lateral diffusion coefficient of a phospholipid in a membrane bilayer is approximately 1 μm2 s−1, corresponding to a mean displacement in one second of about 2 μm, or about 50 times the radius of a typical coated pit. Thus, even recruitment of a phosphoinositide kinase to a nascent coated structure could not generate a local lipid concentration profile substantially different from that of the plasma membrane as a whole. Membrane scission abruptly blocks any further exchange, however, enabling enzymatic conversion to change relative phosphoinositide levels. A phosphatidylinositol 3-kinase produces PtdIns3P from phosphatidylinositol, and two 5-phosphatases produce PtdIns4P from PtdIns(4,5)P2 (Fig. 3f). The former activity might also then make PtdIns(3,4)P2, or a third enzyme might generate this product from PtdIns(3,4,5)P3. A third enzyme appears to be necessary, to account for the observation that loss of PI3K-C2α eliminates the PtdIns3P burst but not the accumulation of PtdIns(3,4)P2.
Figure 5 |. Relationship between conversion of phophoinositides and known structural events during clathrin-mediated endocytosis.
Drawing shows successive molecular conversions during clathrin-coated pit assembly and coated-pit budding and uncoating, with phosphoinositide composition (coloured dots and labelled coloured bars) deduced from recruitment of Aux1 sensors. Separation of a vesicle from its parent membrane blocks exchange with the plasma membrane and allows stable lipid conversions.
Our results lead to three general conclusions. (1) A programmed series of phosphoinositide conversions accompanies the various stages of the clathrin assembly-disassembly cycle in endocytic membrane traffic. (2) Because these conversions, with half-times of 1–5 s, depend on closure of the vesicle, their onset creates a molecular signal that scission is complete. (3) A cascade of dependencies leads to further molecular signals, one of which (accumulation of PtdIns(3,4)P2) announces substantial uncoating and may bring about arrival of Rab5 GTPases.
Most of the experiments in this paper were carried out with human SUM159 cells, which are particularly amenable to gene editing. Further experiments were conducted with human SVGA cells, human fibroblasts and monkey COS-7 cells. The identity of particular converting enzymes, or even the critical phosphoinositide species, might in principle differ in other cell types, and when multiple enzymes catalyse a particular step, one might dominate in a particular tissue. Synj1 dominates PtdIns(4,5)P2 conversion in neurons25, for example, whereas OCRL is more broadly important24. Nonetheless, we suggest that the underlying principle illustrated by the observations reported here—a cascade of molecular conversions made possible by separation of the vesicle from the parent membrane—will prove generally valid and that other routes of membrane traffic are likely to have distinct cascades with similar characteristics.
METHODS
Reagents.
The PI4KIIIα selective inhibitor A128 was a gift from T. Balla. The VPS34 selective inhibitors PIK-III29 and VPS34-IN130 were gifts from D. Alessi. The Janelia Fluor™ 646 fluorescently tagged HaloTag ligand31 was a gift from L. D. Lavis. The antibodies against PI3K-C2α (611046), OCRL (HPA012495) and HRP-conjugated 6 ×-His Tag (MA1–21315-HRP) were purchased from BD Transduction Laboratories, Sigma-Aldrich and Thermo Fisher Scientific, respectively.
Plasmids and transfection.
The DNA sequences encoding the full-length Aux1 (910 residues, NP_777261.1), or residues 1–814 and 420–814 of Aux1, were amplified by PCR from a full-length bovine cDNA clone4 and inserted into pEGFP-C1 to generate the plasmids EGFP-Aux1, EGFP-Aux1(1–814) and EGFP-Aux1(420–814), respectively. The PH domain of PLCδ112, the P4M domain of DrrA18, the tandem FYVE domains of Hrs17, the tandem PH domains of TAPP123, the triple repeat PHD domains of ING232, and the PH domain of Btk33 were amplified by PCR from the corresponding expression vectors, which were gifts from T. Balla, H. Stenmark, T. Takenawa and O. Gozani. Fragments with the DNA sequences encoding the corresponding phosphoinositide-binding domains were inserted into pEGFP-C1 or mCherry-C1 to generate the EGFP- or mCherry-fused phosphoinositide-binding proteins. A linker (5′-GGAGGATCCGGTGGATCTGGAGGTTCTGGTGGTTCTGGTGGTTCC-3′) was placed between EGFP or mCherry and the DNA fragments. To generate the Aux1-based phosphoinositide-binding sensors, the sequences of the lipid-binding domains described above or appropriate mutants unable to bind lipids were first amplified by PCR and then inserted between EGFP and Aux1(420–814) of plasmid EGFP-Aux1(420–814).
The DNA sequences encoding the full-length epsin1 isoform c (550 residues, NP_037465.2), or residues 230–475 of epsin1 isoform c (NP_037465.2) were amplified by PCR from a full-length human cDNA clone and inserted into pEGFP-C1 to generate the plasmids EGFP-epsin1 and EGFP-epsin1(230–475), respectively. To generate the epsin1-based phosphoinositide-binding sensors, the sequences of the lipid-binding domains described above were amplified by PCR and subsequently fused to epsin1(230–475) before insertion into pEGFP-C1.
The plasmids EGFP-PI3K-C2α (wild type) and EGFP-kdPI3K-C2α (kinase-deficient) were gifts from Y. Takuwa34. The wild-type and kinase-deficient PI3K-C2α versions resistant to siRNA (5′-GGATCTTTTTAAACCTATT-3′) were generated using PCR by introducing mutations (5′-AGATCTATTCAAACCGATT-3′)20 followed by insertion into mCherry-C1.
The mCherry-CLTA plasmid encoding mCherry fused to the N terminus of the rat clathrin light chain A1 has been described35. A chimaera of EEA1 fused at its N terminus with HaloTag was generated by replacement of EGFP in EGFP-EEA136 (Addgene plasmid #42307).
The plasmids CIBN-CAAX, mCherry-CRY2–5-ptaseOCRL and mCherry-CRY2–5-ptaseOCRL(D523G) used for light-activated membrane targeting14 were gifts from P. De Camilli.
Transfections were performed using TransfeX Transfection Reagent (ATCC) according to the manufacturer’s instructions and cells with relatively low levels of sensor expression were imaged 16–20 h after transfection.
Cell culture.
The mostly diploid SUM159 human breast carcinoma cells37 were provided by J. Brugge; they were grown at 37 °C and 5% CO2 in DMEM/F-12/GlutaMAX (GIBCO), supplemented with 5% fetal bovine serum (FBS, Atlanta Biologicals), 100 U/ml penicillin and streptomycin (VWR International), 1 μg/ml hydrocortisone (Sigma-Aldrich), 5 μg/ml insulin (Sigma-Aldrich), and 10 mM HEPES (Mediatech), pH 7.4. The de-identified human dermal fibroblasts from a control culture (PHL336)38,39 were a gift from P. De Camilli. COS-7 cells were obtained from The American Type Culture Collection (ATCC). COS-7 cells and human dermal fibroblasts were grown at 37 °C and 5% CO2 in DMEM (GIBCO) supplemented with 10% FBS (Atlanta Biologicals), 100 U/ml penicillin and streptomycin (VWR International). All cells were routinely verified to be mycoplasma free using a PCR-based assay.
Genome editing of SUM159 cells to express EGFP-Synj1+/+, EGFP-OCRL+/+, EGFP-PI3K-C2α+/−, EGFP-Rab5a+/+, or EGFP-Rab5c+/+ using the CRISPR-Cas9 approach.
SUM159 cells were gene-edited to incorporate EGFP to the N terminus of Synj1 (only the Synj1 isoform 170-kDa was detected by cDNA sequencing), OCRL (only isoform 1b was detected by cDNA sequencing), PI3K-C2α, Rab5a and Rab5c using the CRISPR-Cas9 approach40. The target sequences at the genomic locus recognized by the single-guide RNA (sgRNA) are 5′-GCGGCGCAATGCGGAAGAGA-3′ for SYNJ1,5′-CTGGATGGAGCCGC CGCTCC-3′ for OCRL, 5′-TTTGGTCTTTTTAGTGGACA-3′ for PIK3C2A, 5′-ACTTATTTCAAATTTGGACA-3′ for RAB5A, and 5′-TGGACGGGCAATGGCGGGTC-3′ for RAB5C. The sgRNA containing the targeting sequence was delivered as PCR amplicons containing a PCR-amplifìed U6-driven sgRNA expression cassette40.
Donor constructs used as templates for homologous recombination to repair the Cas9-induced double-strand DNA breaks were generated by cloning into the pUC19 vector with two ~800-nucleotide fragments of human genomic DNA upstream and downstream of the start codon of SYNJ1, OCRL, PIK3C2A, RAB5A or RAB5C and the open reading frame of EGFP using Gibson Assembly Master Mix (New England BioLabs). The upstream and downstream genomic fragments were generated by PCR amplification reactions from the genomic DNA extracted from SUM159 cells using the QiaAmp DNA mini kit (Qiagen). The open reading frame encoding EGFP and a flexible linker (5′-GGAGGTTCTGGTGGTTCTGGTGGTTCC-3′) was obtained by PCR from an EGFP expression vector.
SUM159 cells plated overnight in 6-well plates were transfected with 800 ng each of the donor plasmid, the plasmid coding for the Streptococcus pyogenes Cas9, and the free PCR product using Lipofectamin 2000 (Invitrogen) according to the manufacturer’s instructions. Between seven and ten days after transfection, cells expressing EGFP chimaeras were enriched by fluorescence-activated cell sorting (FACS) using a FACSAria II instrument (BD Biosciences) equipped with an 85-μm nozzle. The sorted cells were expanded and subjected to one or two more subsequent bulk sortings to enrich the EGFP-positive cells. After that, the enriched cells were subjected to single-cell sorting into 96-well plates to select and then expand monoclonal cell populations; a subset of these cell populations were screened for successful incorporation in the genomic locus of EGFP by PCR using GoTaq Polymerase (Promega).
Genome editing of SUM159 cells to express CLTA-TagRFP using the TALEN-based approach.
SUM159 cells were genome edited to incorporate TagRFP into the C terminus of clathrin light chain A (CLTA) using a TALEN-based protocol41. The upstream targeting sequence 5′-TCTCCCTCAAGCAGGCCCCG-3′ is located nine nucleotides upstream of the CLTA stop codon TGA. The downstream targeting sequence 5′-TGTAGTGTTTCCACAGGGTG-3′ is located five nucleotides downstream of the CLTA stop codon TGA. The donor construct was generated by fusion of two ~800-nucleotide fragments of human genomic DNA upstream and downstream of the stop codon of CLTA with the open reading frame of TagRFP into the pCR8/GW TOPO vector (Invitrogen).
SUM159 cells plated overnight in 6-well plates were transfected with 600 ng each of the upstream and downstream TALEN targeting sequences and the donor construct using TransIT-2020 Transfection Reagent (Mirus Bio) according to the manufacturer’s instructions. The monoclonal cell populations were obtained by flow cytometry single cell sorting as described above and screened for both alleles modified to express CLTA-TagRFP by PCR using GoTaq Polymerase (Promega).
Knockout of OCRL and Synjl in SUM159 cells using the CRISPR-Cas9 approach.
Knockout of OCRL and Synj1 were performed using the CRISPR-Cas9 approach by transduction with a lentiviral vector (LentiCRISPR) encoding Cas9 and the appropriate sgRNA targeting sequence42.
The target sequence for OCRL overlapping the start codon ATG (underlined) is 5′-CTGGATGGAGCCGCCGCTCC-3′. Plasmids encoding LentiCRISPR, psPAX2 packaging and pVSV-G envelope were cotransfected into HEK293T cells using TransIT-293 (Mirus Bio) and supernatant containing lentivirus was collected 3 days after. This medium was then added to the gene-edited CLTA-TagRFP+/+ SUM159 cells and replaced 24 h afterwards with fresh medium containing 4 μg/ml puromycin (InvivoGen), followed by incubation for another 48 h. Surviving cells were plated into 96-well plates (1 cell per well) and cultured for another 2–3 weeks. Screening of the monoclonal cell populations was done by DNA sequencing of genomic PCR fragments of ~450 nucleotides centred on the sgRNA targeting sequence. O CRL-KO clones with mutations in both alleles (frame shift insertions or deletions) were identified and loss of OCRL protein expression was confirmed by western blot analysis.
Knockout of Synj1 in CLTA-TagRFP+/+ cells was performed as described above using the target sequence for SYNJ1 5′-GGGTACATACTCCAAAGTAC-3′. Synj 1-KO clones with mutations in both alleles (frame shift insertions or deletions) were identified by genomic DNA sequencing and confirmed by cDNA sequencing.
Ectopic stable expression of proteins.
SUM159 or CLTA-TagRFP+/+ SUM159 cells stably expressing the EGFP-tagged Aux1-based lipid sensors were generated by transfection followed 5–7 days later by FACS to isolate the population of cells expressing EGFP, followed by 1–2 additional bulk FACS sorting to obtain a pool and isolated cell clones stably expressing relatively low levels of sensors.
COS-7 cells or human dermal fibroblasts stably expressing TagRFP-CLTA were generated by transduction using a lentiviral vector encoding TagRFP-CLTA. The pools of cells expressing TagRFP-CLTA were identified by FACS 5–7 days after transduction. Stable expression of the Aux1-based lipid sensors in the TagRFP-CLTA COS-7 cells was obtained by subsequent transduction with lentivirus encoding appropriate sensors and those expressing relatively low levels of sensors were isolated by FACS.
mRNA depletion by shRNA or siRNA knockdown.
Lentivirus short hairpin RNA (shRNA) expressing 5′-CCGAGTTACTTCCACTGAGTT-3′ was used to knock down Synj1 (Broad Institute TRC library). The lentivirus shRNA with the unrelated sequence 5′-CCTAAGGTTAAGTCGCCCTCG-3′ was used as control. Lentivirus shRNA was produced in HEK293T cells as described above. A pool of supernatant containing lentivirus collected 24, 48 and 72 h post transfection was added to SUM159 or COS-7 cells. After 24 h, the cells were transferred to fresh medium containing 4 μg/ml puromycin (InvivoGen) and cultured for another 48 h, followed by growth for another 48 h in fresh medium. At this point, the cells were subjected to live-cell imaging and analysed by real-time quantitative PCR to confirm the efficiency of the knockdown.
siRNAs were used to knockdown the expression of OCRL, PI3K-C2α, dynamin2, SNX9, INPP4A, PIPKIγ, hRME-6 or Rabex5. The OCRL siRNA sequences used were: 5′-GGGT GAAGGTT GTGGAT GA-3′ and 5′-GGGCAATATGAGTTAATAATT-3′. The PI3K-C2α, dynamin2, SNX9 and INPP4A siRNA sequences used were 5′-GGATCTTTTTAAACCTATT-3′, 5′-GCAACTGACCAACCACATC-3′, 5′-AACAGTCGTGCTAGTTCCTCATCCA-3′ and 5′-GGAAATATACAAGAC CCAG-3’, respectively. They all included 3′-dTdT overhangs (Dharmacon). ON-TARGETplus SMARTpools (a mixture of four siRNAs) were used to knockdown PIPKIγ (M-004782–00-0005; Dharmacon), hRME-6 (L-026206–01-0005; Dharmacon) and Rabex5 (L-008541–00-0005; Dharmacon). A non-targeting siRNA (D-001210–03-05; Dharmacon) was used as a control.
Knockdown of OCRL or dynamin2 was achieved by transfection using Lipofectamine RNAiMAX (Invitrogen) of cells plated overnight and then subjected to analysis by live-cell imaging, real-time quantitative PCR and western blot analysis 3 days later. Knockdown of PI3K-C2α, SNX9, INPP4A, PIPKIγ, hRME-6 or Rabex5 was done by two sequential transfections, the first one in cells after overnight plating and the second two days later, followed by analysis 2 days later. Oligofectamine (Invitrogen) was used for PI3K-C2α and Lipofectamine RNAiMAX (Invitrogen) for the others.
Real-time quantitative PCR.
Real-time quantitative PCR was performed according to the manufacturer’s instructions as follows. Total RNA was extracted using RNeasy Plus Mini Kit (Qiagen). The SuperScript VILO cDNA Synthesis Kit (Invitrogen) was used to generate cDNA from the extracted RNA. Real-time quantitative PCR was performed using the FastStart Universal SYBR Green Master (Rox) (Roche) and the StepOnePlus Real-time PCR System (Applied Biosystems). GAPDH expression was analysed for normalization. The following primers were used: (1) Synj1 forward: 5′-GAGGCAATCAAGGGTACATACT-3′; Synj1 reverse: 5′-TCCAGTGACTAGGACCAGATAA-3′; (2) OCRL forward: 5′-TTT GAAGTTCCTCTCAGCTGTC-3′; OCRL reverse: 5′-CAGAAGGTTTGTCCTTAG TGTCT-3′; (3) PI3K-C2α forward: 5′-TTCCACTTTGGAAGTTACCAGGC; PI3K-C2α reverse: 5′-AGATCACACTCTGCTACATCCGT-3′; (4) dynamin2 forward: 5′-ACTTACATCCGGGAACGGGA-3′; dynamin2 reverse: 5′-CTCTG CTGGGCATTGGCAAAC-3′; (5) SNX9 forward: 5′ - GAT G AG AAG G A AT G GAAAACTGGAA-3′; SNX9 reverse: 5′-AGCCTCGCACTTCTGCTCTATT-3′; (6) INPP4A forward: 5′-GCTGTTTGACGCCTTGCC-3′; INPP4A reverse: 5′-GACGTATCGCCAAACCTCTC-3′; (7) PIPKIγ forward: 5′-ATCCTGCAGTCC TACAGGTTCA-3′; PIPKIγ reverse: 5′-GTTCTTCCGAAAGACCGTGT-3′; (8) hRME-6 forward: 5′-ACGCGAGTGAAGAACAGCTT-3′; hRME-6 reverse: 5′-TGTTCATGAAGAACCTGGTCGC-3′; (9) Rabex5 forward: 5′-CTTCCACAAG ACAGGCCAAGA-3′; Rabex5 reverse: 5′-TGTTCTTCAATGCTTAGAT CCCTTT-3′; and (10) GAPDH forward: 5′-AATCCCATCACCATCTTCCA-3′; GAPDH reverse: 5′-TGGACTCCACGACGTACTCA-3′.
Western blot analysis.
Western blot analysis was performed as described35. The cells were washed three times in PBS and then solubilized at 4 °C for 30 min in lysis buffer (150 mM NaCl, 15 mM MgCl2, 1 mM EGTA, 10% glycerol, 1% Triton X-100, 50 mM HEPES, pH 7.4) with a protease inhibitor cocktail (Roche). Then the samples were pelleted at 14,000g for 5 min at 4 °C. The supernatant was collected and the protein concentration (total lysate) was determined using the BCA assay (Pierce). The samples were then mixed with 5 × sample buffer (250 mM Tris-HCl at pH 6.8, 10% SDS, 50% glycerol, 0.5% bromophenol blue and 10% β-mercaptoethanol) and heated to 99 °C for 10 min, fractionated by SDS-PAGE, and transferred to nitrocellulose membranes (Whatman). The membrane was then incubated in Tris-buffered saline with Tween 20 (TBST) (150 mM NaCl, 50 mM Tris and 0.1% Tween 20, pH 7.6) containing 3% BSA for 1 h at room temperature, followed by overnight incubation at 4 °C with the anti-OCRL antibody (1:250) or anti-PI3K-C2α antibody (1:500) diluted in TBST containing 3% BSA. After three washes in TBST (10 min each), the membrane was incubated with the appropriate HRP-conjugated secondary antibody (Amersham Biosciences) at room temperature for 1 h. After three more washes (10 min each) in TBST, the membrane was incubated with LumiGLO Chemiluminescent Substrate (KPL) and imaged using a Las 3000 system (Fujifilm).
Purification of the Auxl-based sensors and lipid-protein overlay assay.
The DNA sequences encoding EGFP-Aux1(420–814) and the four EGFP-tagged Auxl-based phosphoinositide-binding sensors (EGFP-2×FYVE(Hrs)-Aux1, EGFP-cP4M(DrrA)-Aux1, EGFP-2×PH(TAPP1)-Aux1 and EGFP-PH(PLCδl)-Auxl) were flanked at the N-and C termini by 6×-His tags upon insertion into the pET-28a bacterial expression vector. Expression of the chimaeric proteins was carried out in BL21 Escherichia coli, with induction by incubation with 0.6 mM isopropyl-thiogalactopyranoside, at 37 °C for 3 h for EGFP-2×FYVE(Hrs)-Aux1, or 22 °C for the remaining proteins (overnight growth, except for EGFP-2×PH(TAPP1)-Aux1, for which growth was limited to 6 h). Cells were lysed by brief sonication, and lysates subjected to ultracentrifugation. The supernatant was incubated with nickel-nitrilotriacetic acid resin (Thermo Fisher Scientific) for 20 min at 4 °C, and proteins eluted using 200 mM imidazole. EGFP-2×PH(TAPP1)-Aux1 was further purified by gel filtration chromatography (Superdex 200; GE Healthcare). Western blot analysis using an HRP-conjugated 6 × - His Tag monoclonal antibody (1:4,000 diluted in TBST containing 2% milk) confirmed that all protein samples corresponded to the full-length EGFP chimaeras, with no prominent degradation products.
The phosphoinositide-binding specificity of the Aux1-based sensors was determined by a lipid-protein overlay assay using PIP Strips according to the manufacturer’s instructions (P-6001; Echelon). In brief, the PIP Strips were first incubated with blocking buffer (TBST containing 3% fatty acid free BSA) for 1 h at room temperature. Then the PIP Strips were incubated with the chimaeric proteins (~0.4–10 μg/ml) in blocking buffer for 1 h at room temperature. After three washes in TBST (5 min each), the PIP Strips were incubated with the HRP-conjugated 6×-His Tag monoclonal antibody (1:4,000 diluted in TBST containing 2% milk) for 1 h at room temperature. After three washes (5 min each) in TBST, the PIP Strips were incubated with LumiGLO Chemiluminescent Substrate (KPL) and imaged using the Amersham Imager 600 (GE Healthcare).
Transferrin uptake.
Transferrin uptake by a flow cytometry-based assay was done as described21. In brief, SUM159 cells stably expressing increasing amounts of the various Aux1-based EGFP-tagged sensors were plated overnight in 12-well plates. The cells were then washed once with α-MEM (GIBCO) and then incubated with 5 μg/ml Alexa Fluor 647-conjugated transferrin (Invitrogen) in α-MEM for 10 min at 4 °C or 37 °C. The plates were then placed on top of wet ice and the cells rinsed with ice-chilled PBS, followed by two brief rinses with the ice-chilled PBS or acid wash medium (150 mM NaCl, 1 mM MgCl2, 0.125 mM CaCl2, and 0.1 M glycine, pH 2.5) to remove membrane-bound transferrin. The cells were released from the plates by incubation in 5 mM EDTA in PBS, spun, resuspended in ice-chilled PBS, spun and resuspended in 250 μl ice-chilled PBS containing 0.1% FBS. The amount of membrane bound or internalized transferrin (~ 15,000–30,000 cells per measurement) was determined using the 633-nm laser line of the FACSCanto2 (BD Biosciences).
TIRF and spinning-disk confocal microscopy: live-cell imaging and image analysis.
The TIRF microscopy system used as described35 was based on a fully enclosed, environmentally temperature-controlled Axiovert 200M microscope equipped with an Alpha Plan-Apo 100 × objective (1.46 NA, Carl Zeiss), a TIRF slider with manual angle and focus controls (Carl Zeiss), and a cooled CCD camera (QuantEM, 512SC, Photometrics). A 2 × magnification lens was placed in front of the CCD camera, which provided a final pixel size corresponding to 80 nm of image. Solid-state lasers were used for excitation at 488 nm (Saphire, Coherent) and 561 nm (Jive, Cobolt AB). The emission light was collected using a dual view emission splitting unit (DV2, Photometrics) equipped with a 520/35 nm bandpass filter for EGFP collection and a 620/60 nm bandpass filter for TagRFP and mCherry collection. In order to increase the penetration depth of TIRF illumination while maintaining the single molecule sensitivity, the oblique-angle illumination TIRF mode was used with the incidence angle of the excitation light slightly below the critical angle43,44. The spinning-disk confocal microscopy set up was used as described35. Time series were acquired using Slidebook (Intelligent Imaging Innovations).
Glass coverslips (#1.5; Warner Instruments) were cleaned by sonication for 30 min in ethanol and then dried. Cells were plated on the cleaned coverslips and cultured for 4–6 h for SUM159 cells and overnight for COS-7 cells or human dermal fibroblasts. The coverslips with plated cells were then placed in an Attofluor Cell Chamber (Invitrogen) and covered with pre-warmed α-MEM (GIBCO) supplemented with 5% FBS and 20 mM HEPES. The chamber was then inserted into the temperature-controlled sample holder maintained at 37 °C in a humidified environment at 5% CO2 (20/20 Technology) placed inside the environmentally controlled chamber of the microscope.
The detection and tracking of clathrin-coated structures and the associated EGFP-labelled Aux1-based phosphoinositide sensors were carried out using the cmeAnalysis software package with clathrin CLTA-TagRFP as the ‘master’ channel and EGFP-labelled sensors as the ‘slave’ channel10. For the automated detection, the standard deviation of the estimated Gaussian point spread function (PSF) was 1.36 pixels for TagRFP and 1.19 pixels for EGFP. The minimum and maximum tracking search radius were one and three pixels, respectively, with a maximum gap length of two frames within a trajectory. Valid clathrin traces with lifetimes between 20 and 120 s and with significant sensor signal in the slave channel were automatically selected. The intensity-lifetime cohorts were generated as described10 and showed similar distributions to those previously determined for endocytic clathrin-coated pits and vesicles imaged in htertRPE-1 and SUM159 cells45,46. The burst signal of the PtdIns4P sensor was calculated as the difference between maximum intensity during burst and average intensity from five early-stage frames starting 13 s before the peak.
The single EGFP molecule calibration was carried out as described previously35 where single EGFP molecules were detected using the cmeAnalysis software package10. Recombinant EGFP made in E. coli was used to determine the fluorescence intensity of a single EGFP molecule. The recombinant EGFP in PBS was placed on the freshly plasma glow-discharged glass coverslip (Harrick Plasma) for 10 min. After three gentle washes with PBS, the coverslip with adsorbed EGFP was imaged by TIRF microscopy using the same imaging conditions used for the experiments.
Lattice light-sheet microscopy: live-cell imaging and image analysis.
SUM159 cells expressing EGFP-Rab5c+/+ and the PtdIns(3,4)P2 sensor mCherry-2× PH(TAPP1)-Aux1 were imaged using lattice light-sheet microscopy with a dithered square lattice light-sheet as described previously11,46. The cells were plated on 5-mm coverslips (Bellco Glass) for at least 4 h before imaging, and were imaged in FluoroBrite DMEM medium (Thermo Fisher Scientific) containing 5% FBS and 20 mM HEPES at 37 °C. The cells were sequentially excited with a 488-nm laser (15–30 mW) and a 560-nm laser (50–100 mW) for ~30 ms for each channel using a 0.35-inner and 0.4-outer numerical aperture excitation annulus. The 3D volumes of the imaged cells were recorded by scanning the sample every ~2.5 s for 5 min at 500-nm step sizes in the s-axis (corresponding to ~261 nm along the z-axis), thereby capturing a volume of ~50 μm × 50 μm × 20 μm (512 × 512 × 41 pixels).
As the optical sections were acquired by scanning the sample at 500-nm step sizes, the volumes were deskewed using a geometric image transform function as described11,46. The time-series were subjected to 3D detection and tracking of diffraction-limited objects (minimum and maximum search radius of three and six pixels, respectively; and allowing for a two-frame maximum gap in a trajectory) as described46. Lifetime distributions, intensity cohorts, and event density statistics were calculated as described46. The fitted amplitudes of the diffraction-limited objects were converted to an approximate number of molecules using singlemolecule calibration. In brief, diluted purified EGFP (~picomolar concentration range) was deposited on air plasma-oxidized 5-mm glass coverslips and imaged by lattice light-sheet microscopy with the same experimental settings and power conditions while varying the exposure times in order to be able to image single EGFP molecules. A previously described 3D point-source detection algorithm46 was used to detect EGFP molecules immobilized on glass substrates over time, where these detected diffraction-limited objects were further filtered out on the basis of their lifetime, and on a statistical t-test between the fitted amplitude of the EGFP and the fitted local background (α = 0.01) to determine whether a detected value was statistically significant before stochastically bleaching in the imaging window. The smallest step-size of the filtered molecules was determined at varying exposures by fitting the distribution of amplitudes with a mixture-model Gaussian fitting algorithm10, to determine the conversion factor at the experimental imaging exposure conditions. The point-to-point 3D displacement (Fig. 4d, f) was calculated using the sub-pixel positions of each detected object over time (fitted using a PSF approximated 3D Gaussian kernel). All analyses were performed using custom routines written in MATLAB 2014a (MathWorks).
The colour-coded plots shown in Fig. 4d–f and Extended Data Fig. 10a were generated using custom MATLAB routines. For each track, the signal intensities corresponding to mCherry-PH(TAPP1)-Aux1 and EGFP-Rab5c were rescaled from 0 to 1. A patch object, that is, the single connecting coloured line segment between two time points generated for each interval (tn − tn+1, tn+1 − tn+2, and so on) helped us to visualize the content of the tracked object as a function of time. The patch object corresponding to each interval was configured for its colour and transparency; in brief, the normalized values of mCherry-PH(TAPP1)-Aux1 and EGFP-Rab5c were directly placed in the red and green fields, respectively, of an RGB colour matrix. The transparency of the patch object was scaled from 33% to 100%, where objects with normalized mCherry-PH(TAPP1)-Aux1 and EGFP-Rab5c values of zero would correspond to an RGB matrix of [0,0,0] and appear as a translucent black patch with 33% opacity; for comparison, normalized mCherry-PH(TAPP1)-Aux1 and EGFP-Rab5c values of one would correspond to an RGB matrix of [1,1,0] and appear as a solid orange patch (100% red from mCherry-PH(TAPP1)-Aux1 + 100% green from EGFP-Rab5c) with 100% opacity. Lastly, the various combinations of normalized mCherry-PH(TAPP1)-Aux1 and EGFP-Rab5c values populating the RGB and transparency matrix are shown in the 2D colourmap inset next to the figures.
Statistical tests.
Because the large sizes of the sample sizes, Cohen’s d effect size47 was used to report the practical significance of the difference in magnitude between the means of different treatments. The data in Fig. 3 are mean ± s.d. in a, c-e and mean ± s.e.m. in b. Data are representative of at least two independent experiments. 95% confidence intervals of Cohen’s d are: [0.75, 1.03] and [0.92, 1.20] (a); [0.62, 0.82] and [−0.06, 0.14] (c); [0.71, 0.90] (d); [0.12, 0.30] (e).
No statistical methods were used to predetermine sample size. The experiments were not randomized and the investigators were not blinded to allocation during experiments and outcome assessment.
Code availability.
The custom MATLAB routines are available upon request from the corresponding author.
Data availability.
The data that support the findings of the current study are available from the corresponding author upon reasonable request. The full gel source data have been provided in Supplementary Fig. 1.
Extended Data
Extended Data Figure 1 |. Characterization of gene-edited SUM159 cells expressing clathrin light chain A and minimal requirements for the targeting specificity of the Aux1-based PtdIns(4,5)P2 sensor to endocytic coated pits and vesicles.
a, Schematic representation of the constructs EGFP-Auxl, EGFP-Aux1(1–814), and EGFP-Aux1(420–814) used for transient expression in CLTA-TagRFP+/+ cells. The representative kymographs are from 300-s time series imaged every 1 s by TIRF microscopy at the bottom surface of the cells. The kymographs were shifted laterally by six pixels. Scale bars, 5 μm. The plots show averaged fluorescence intensity traces (mean ± s.e.m.) of CLTA-TagRFP (red) and the Aux1 constructs (green) from endocytic clathrin-coated pits and vesicles automatically identified using the 2D tracking software in 11, 6 and 12 cells, respectively, and then grouped in cohorts according to lifetimes. Note that removal of the PTEN-like domain but not the J domain largely inhibited the burst-like recruitment of Aux1. The numbers of analysed traces are shown above each cohort. Data are representative of at least two independent experiments. b, Genomic PCR analysis showing biallelic integration of the TagRFP sequence into the CLTA genomic locus in the SUM159 clonal gene-edited CLTA-TagRFP+/+ cell line (top), representative of three independent experiments. Transferrin uptake comparing parental, unedited SUM159 control cells and the gene-edited CTLA-TagRFP+/+ cells determined by flow cytometry (n = 3 independent experiments, mean ± s.d.) (bottom). c-e, Schematic representation of the constructs EGFP-Aux1, EGFP-Aux1(420–814) and EGFP-Aux1(547–814) used for transient expression in gene-edited AP2-TagRFP+/+ SUM159 cells and then imaged by TIRF microscopy. The plots show averaged fluorescence intensity traces (mean ± s.e.m.) of AP2-TagRFP+/+ (red) and of the Aux1 constructs (green) from endocytic clathrin-coated pits and vesicles identified in 5, 6 and 6 cells, respectively, and then grouped in cohorts according to lifetimes. Note that removal of residues 420–546 from EGFP-Aux1(420–814) has largely inhibited its small, burst-like recruitment. The numbers of analysed traces are shown above each cohort. Data are representative of two independent experiments. f, A linker derived from the unstructured region (residues 508–736) of Dishevelled2 (Dvl2) was inserted between EGFP and Aux1(547–814) to make the construct EGFP-Dvl2(508–736)-Aux1(547–814), which showed very small burst-like recruitment, similar to that of EGFP-Aux1(420–814), which also lacked the PTEN-like domain (n = 5 cells). Data are representative of two independent experiments. g, h, The constructs EGFP-PH(PLCδ1)-Aux1(420–814) or EGFP-PH(PLCδ1)-Aux1(547–814) were used for transient expression in AP2-TagRFP+/+ cells and then imaged by TIRF microscopy. The plots show averaged fluorescence intensity traces (mean ± s.e.m.) of AP2-TagRFP+/+ (red) and of the Aux1-based PtdIns(4,5)P2 sensors (green) associated with endocytic clathrin-coated pits and vesicles identified in 9 and 6 cells, and then grouped in cohorts according to their lifetimes. Note that the removal of the linker Aux1 residues 420–546 from EGFP-PH(PLCδ1)-Aux1 (420–814) largely inhibited its recruitment to coated pits (h). The numbers of analysed traces are shown above each cohort. Data are representative of two independent experiments. i, The Dvl2(508–736) linker was inserted between EGFP-PH(PLCδ1) and Aux1(547–814) to make the PtdIns(4,5)P2 sensor EGFP-PH(PLCδ1)-Dvl2(508–736)-Aux1(547–814). This chimaera is recruited to coated pits with an efficiency similar to that of EGFP-PH(PLCδ1)-Aux1(420–814) (n = 12 cells). Data are representative of two independent experiments. j, Table summarizing general phosphoinositide probes and Aux1-based phosphoinositide sensors used in this study. The results obtained with sensors specific for PtdIns3P, PtdIns4P, PtdIns(4,5)P2, and PtdIns(3,4)P2, were obtained using the tandem FYVE domains of Hrs, the P4M domain of DrrA, the PH domain of PLCδ1 and the tandem PH domains of TAPP1, respectively.
Extended Data Figure 2 |. Restricted localization and lipid specificity of the Aux1-based phosphoinositide sensors.
a, Intracellular distribution of the Auxl-based PtdIns(4,5)P2 sensor recorded by lattice light-sheet microscopy. The representative images are from a CLTA-TagRFP+/+ (red) cell expressing the Auxl-based PtdIns(4,5)P2 sensor EGFP-PH(PLCδl)-Auxl. The left panel shows a deconvolved 3D rendering from a single time point and illustrates the location of the optical section shown in the right panels. The images contrast the full colocalization throughout the plasma membrane of the fluorescent signals corresponding to the sensor and clathrin with the absence of colocalization in endosomal clathrin-containing structures. The EGFP channel in the right lower panel was shifted laterally by six pixels. b, Bottom surface of a gene-edited AP2-EGFP+/+ cell, bearing endocytic AP2 complexes labelled by σ2-EGFP and co-expressing CIBN-CAAX and the mCherry-tagged inositol 5-phosphatase module of OCRL (mCherry-CRY2–5-ptaseOCRL), imaged at 1-s intervals for 200 s by spinning-disk confocal microscopy. Acute depletion of plasma membrane PtdIns(4,5)P2, by recruitment of mCherry-CRY2–5-ptaseOCRL from the cytosol to the plasma membrane, was triggered by illumination with 488-nm light beginning at t = 0 s. The kymograph shows that partially formed coated pits stalled and new ones failed to initiate owing to loss of PtdIns(4,5)P2. c, Bottom surface of a SUM159 cell co-expressing the PtdIns(4,5)P2 sensor EGFP-PH(PLCδl)-Auxl together with CIBN-CAAX and mCherry-CRY2–5-ptaseOCRL imaged at 2-s intervals for l00 s by spinning-disk confocal microscopy. Acute, light-mediated depletion of plasma membrane PtdIns(4,5)P2 was initiated at t = 0 s. The kymograph illustrates loss of membrane recruitment of the Auxl-based PtdIns(4,5)P2 sensor (top). Recruitment of the Auxl-based PtdIns(4,5)P2 sensor to assembling endocytic coated pits was not affected when a mutant of the phosphatase module of OCRL, unable to hydrolyse PtdIns(4,5)P2, was targeted to the plasma membrane by light activation (bottom). SUMl59 cells co-expressing the PtdIns(4,5)P2 sensor EGFP-PH(PLCδl)-Auxl, together with CIBN-CAAX and the catalytically inactive mCherry-CRY2–5-ptaseOCRL(D523G) (bottom). Images at single time points and the corresponding kymograph are shown. d, Early recruitment of the Auxl-based PtdIns4P sensor to stalled coated pits was not affected when the active phosphatase module of OCRL was targeted to the plasma membrane by light activation (top). The late burst of the PtdIns4P sensor was absent, however, consistent with failure of the stalled (that is, persistent) coated pits to finish assembly and hence failure to bud into coated vesicles. As expected, membrane targeting of the mutant phosphatase module of OCRL had no effect on recruitment of the PtdIns4P sensor to coated pits and vesicles (bottom). The cells co-expressed the PtdIns4P sensor EGFP-P4M(DrrA)-Aux1, together with CIBN-CAAX and mCherry-CRY2–5-ptaseOCRL (top) or the catalytically inactive mCherry-CRY2–5-ptaseOCRL(D523G) (bottom). The bottom surface of the cells was imaged using spinning-disk confocal microscopy. e, Blocking dynamin activity prevented the acute burst but not the binding of the PtdIns4P sensor to arrested (that is, persistent) coated structures at the plasma membrane. AP2-TagRFP+/+ cells expressing the PtdIns4P sensor EGFP-P4M(DrrA)-Aux1 were treated for 10 min without or with dynasore-OH (30 μM) and then imaged using TIRF microscopy. f, CLTA-TagRFP+/+ cells stably expressing the PtdIns4P sensor EGFP-P4M(DrrA)-Auxl were treated with siRNA targeting dynamin2 (DNM2) or with a control sequence, and imaged by TIRF microscopy. The kymograph from a time series of the cell depleted of dynamin2 shows stalling of coated pits, absence of acute PtdIns4P burst and maintenance of the binding of the PtdIns4P sensor to arrested (that is, persistent) coated structures at the plasma membrane. The right panel shows the efficiency of DNM2 mRNA depletion measured by real-time quantitative PCR (n = 3 independent experiments, mean ± s.d.). g, Direct comparison of the recruitment dynamics at endocytic clathrin-coated structures of the Auxl-based PtdIns(4,5)P2 and PtdIns4P sensors. The left panels show a representative image and the corresponding kymograph from a time series, obtained by TIRF microscopy from the bottom surface of a SUM159 cell coexpressing the PtdIns(4,5)P2 sensor (green) and the PtdIns4P sensor (red). The central panel shows the averaged fluorescence intensity traces (mean ± s.e.m.) of the PtdIns(4,5)P2 sensor (green) and the PtdIns4P sensor (red), including the numbers of traces analysed for each lifetime cohort. The right panel is a schematic representation of the early (Early) and late (Burst) recruitment of the PtdIns4P sensor during clathrin-coated pit formation. Note that although the PtdIns4P and PtdIns(4,5)P2 sensors are both recruited early during coated pit formation, only the PtdIns4P sensor then appears as a transient burst coinciding with decline of the PtdIns(4,5)P2 signal. The EGFP channel in all the kymographs with EGFP and TagRFP overlaid was shifted laterally by six pixels. Data are representative of at least two independent experiments. Scale bars, 5 μm.
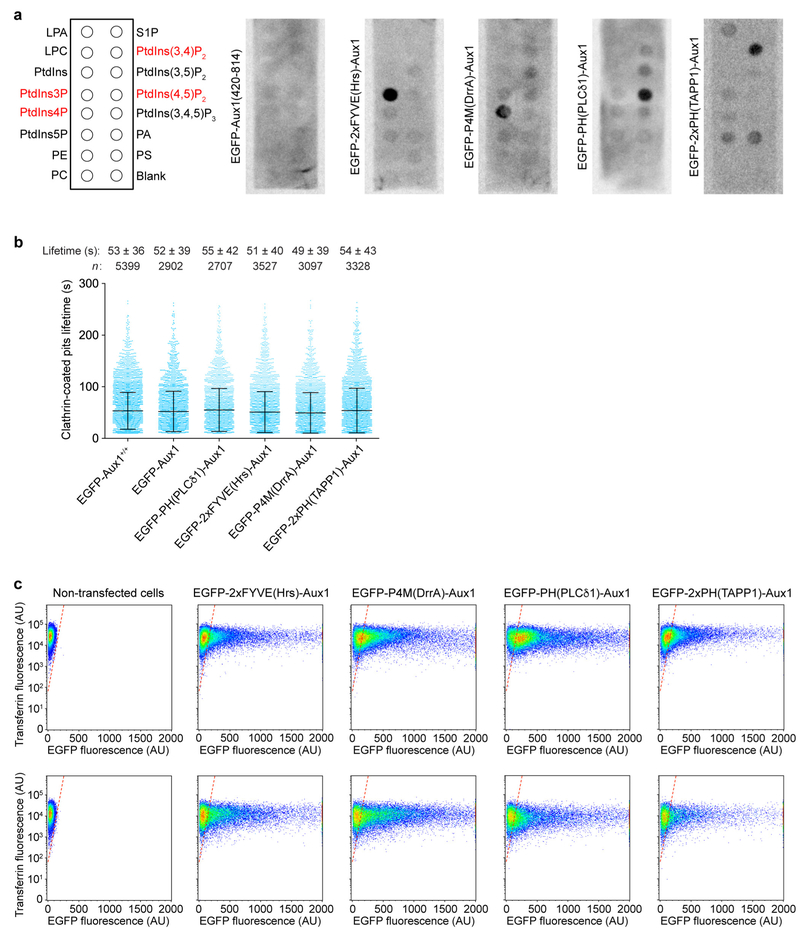
Extended Data Figure 3 |. Validation of the Auxl-based phosphoinositide-binding sensors.
a, The lipid-binding regions in the Auxl-based sensors are required for their phosphoinositide specificity. Shown are representative chemiluminescence images obtained from the lipid-protein overlay assay using the indicated Auxl-based sensors. The strip contained lysophosphatidic acid (LPA), lysophosphocholine (LPC), Ptdlns, PtdIns3P, PtdIns4P, PtdIns5P, phosphatidylethanolamine (PE), phosphatidylcholine (PC), sphingosine-l-phosphate (S1P), PtdIns(3,4)P2, PtdIns(3,5)P2, PtdIns(4,5)P2, PtdIns(3,4,5)P3, phosphatidic acid (PA), and phosphatidylserine (PS). The lipids that recruited the various sensors are highlighted in red. b, The relatively low levels of transient expression of the Auxl-based phosphoinositide sensors, as used in this study, did not detectably affect the assembly dynamics of endocytic clathrin-coated pits and vesicles. The plot shows the distributions of lifetimes and number of clathrin traces determined by 2D automated analysis obtained from time series acquired by TIRF microscopy. The data are from SUM159 cells gene-edited for CLTA-TagRFP+/+ and EGFP-Aux1+/+, or gene-edited for CLTA-TagRFP+/+ and transiently expressing EGFP-Auxl, the PtdIns(4,5)P2 sensor EGFP-PH(PLCδ1)-Aux1, the PtdIns3P sensor EGFP-2×FYVE(Hrs)-Aux1, the PtdIns4P sensor EGFP-P4M(DrrA)-Auxl, or the PtdIns(3,4)P2 sensor EGFP-2×PH(TAPP1)-Aux1. There was no significant difference between the distributions of coated pit lifetimes between cells expressing the sensors and the double gene-edited EGFP-Aux1+/+ and CLTA-TagRFP+/+ cells used as control. Data are mean ± s.d. Cohen’s d values with 95% confidence interval (CI) are: 0.03 [−0.01, 0.08], 0.04 [0, 0.09], 0.07 [0.02, 0.11], 0.11 [0.07, 0.15], 0.01 [−0.03, 0.05]. c, The expression of the Aux1-based sensors do not affect the receptor-mediated uptake of transferrin. The plots show the absence of effect in the extent of internalized (top) and membrane-bound (bottom) Alexa Fluor 647-conjugated transferrin in the control non-transfected SUM159 cells and SUM159 cells stably expressing increasing amounts of the various Aux1-based EGFP-tagged sensors as determined by flow cytometry. Data are representative of two independent experiments.
Extended Data Figure 4 |. Expression of the Auxl-based sensors in SUM159 cells, COS-7 cells and human fibroblasts, and expression of the chimaeric sensors containing the epsin1 clathrin-binding domain in SUM159 cells.
a, Bottom surfaces of CLTA-TagRFP+/+ cells transiently expressing EGFP-tagged sensors specific for PtdIns(4,5)P2, PtdIns3P, PtdIns4P and PtdIns(3,4)P2, imaged by TIRF microscopy for 300 s at 1-s intervals. Each set of results shows data obtained from a wild-type Aux1-based sensor specific to the corresponding phosphoinositide (left), an Aux1-based sensor mutated to eliminate phosphoinositide binding (middle) and a general sensor with defined phosphoinositide specificity (right). The representative images correspond to a single time point. b, Gene-edited CLTA-TagRFP+/+ SUM159 cells stably expressing the indicated Auxl-based phosphoinositide sensors were imaged by TIRF microscopy. The plots show average fluorescence intensity traces (mean ± s.e.m.) of TagRFP-CLTA (red) and the phosphoinositide sensors (green) tracked in 17, 10, 12 and 14 cells and then grouped by cohorts according to their lifetimes. The numbers of analysed traces are shown above each cohort. c, COS-7 cells stably expressing TagRFP-CLTA and the indicated Auxl-based phosphoinositide sensors were imaged by TIRF microscopy and the traces from 7, 10, 9 and 18 cells were analysed as described in b. d, Human fibroblasts stably expressing TagRFP-CLTA and transiently expressing the Auxl-based phosphoinositide sensors were imaged by TIRF microscopy and the traces from 14, 11, 23 and 21 cells were analysed as described in b. e, The EGFP-tagged full-length epsin1, its EGFP-tagged clathrin-binding domain (residues 230–475), or EGFP-tagged sensors containing the indicated protein domains specific for defined phosphoinositides fused at their C terminus to the epsin1 clathrin-binding domain were transiently expressed in CLTA-TagRFP+/+ SUM159 cells and imaged by TIRF microscopy. The EGFP channel in the kymographs was shifted laterally by six pixels. The plots show averaged fluorescence intensity traces (mean ± s.e.m.) of CLTA-TagRFP (red) and the epsin1-based sensors (green) identified in 7, 8, 13, 11, 15 and 14 cells and then grouped by cohorts according to lifetimes. The numbers of analysed traces are shown above each cohort. Data are representative of at least two independent experiments. Scale bars, 5 μm.
Extended Data Figure 5 |. Association of the Auxl-based PtdIns(3,4)P2 sensor together with a few copies of clathrin with uncoated vesicles.
a, Blocking by the dynamin inhibitor dynasore-OH of accumulation of the PtdIns(3,4)P2 sensor on clathrin-coated structures in AP2-TagRFP+/+ cells transiently expressing the PtdIns(3,4)P2 sensor EGFP-2 × PH(TAPP1)-Aux1 (top). The cells were incubated for 10 min without or with 30 μM dynasore-OH and then imaged by spinning-disk confocal microscopy at the bottom surface. The representative kymograph highlights the expected stalling of coated pits induced by brief exposure to dynasore-OH together with their failure to recruit the PtdIns(3,4)P2 sensor. CLTA-TagRFP+/+ cells stably expressing the PtdIns(3,4)P2 sensor EGFP-2×PH(TAPP1)-Aux1 were treated with siRNA targeting dynamin2 or SNX9, or with a control sequence, and imaged by TIRF microscopy (bottom). The kymograph from a time series of a cell depleted of dynamin2 shows that the stalled (that is, persistent) coated pits lack the PtdIns(3,4)P2 sensor. The bottom panels show the efficiency of depletion of SNX9 mRNA measured by real-time quantitative PCR (n = 3 independent experiments, mean ± s.d.) and the distributions of lifetimes for clathrin-coated structures in control (1,513 traces from 8 cells) and SNX9-KD cells (1,038 traces from 11 cells). b, Representative fluorescence traces obtained from gene-edited dynamin2-EGFP+/+ SUM159 cells transiently expressing the Aux1-based PtdIns(3,4)P2 sensor mCherry-2× PH(TAPP1)-Aux1 imaged by TIRF microscopy. Recruitment of the PtdIns(3,4)P2 sensor follows loss of the dynamin signal corresponding to the membrane scission associated with coated pit budding and formation of a coated vesicle. c, Temporal relationship between recruitment of the Auxl-based PtdIns(3,4)P2 sensor and the onset of uncoating of endocytic clathrin-coated vesicles. CLTA-TagRFP+/+ cells transiently expressing the PtdIns(3,4)P2 sensor EGFP-2×PH(TAPP1)-Aux1 were imaged by spinning-disk confocal microscopy towards the leading edge of their bottom surface. Tracking endocytic events near the leading edge of the cell where the uncoated vesicles show limited vertical movement enabled us to capture examples of endocytic events still containing a small number of clathrin triskelions associated with uncoated vesicles (arrows). The representative kymographs (left) and corresponding fluorescence intensity traces (right) from naked vesicles show association of the PtdIns(3,4)P2 sensor together with a few copies of clathrin (arrow) after culmination of the uncoating process. d, Double gene-edited CLTA-TagRFP+/+ and EGFP-Rab5c+/+ SUM159 cells were imaged by TIRF microscopy at the leading edge of their bottom surface. Representative kymographs (left) and corresponding fluorescence intensity traces (right) highlight that a small number of clathrin triskelions remained associated with the uncoated vesicles (arrows). Temporal relationship showing that onset of Rab5c recruitment occurred after the uncoating of endocytic clathrin-coated vesicles. The EGFP channel in all the kymographs with EGFP and TagRFP overlaid was shifted laterally by six pixels. Data are representative of at least two independent experiments. Scale bars, 5 μm.
Extended Data Figure 6 |. Effects of interfering with the activity of inositol kinases and inositol phosphatases on the PtdIns4P and PtdIns(4,5)P2 content of endocytic clathrin-coated structures.
a, Inhibition of PI4KIIIα by the small molecule A1 increased the number of longer-lived coated pits. CLTA-TagRFP+/+ cells stably expressing the PtdIns4P sensor EGFP-P4M(DrrA)-Aux1 were treated for 10 min with DMSO alone, or with DMSO and 100 nM A1, and then imaged by TIRF microscopy. The distributions of coated-structure lifetimes for the control (1,413 traces from 5 cells) and for A1 treated cells (864 traces from 14 cells) are shown. b, Inhibition of PI4KIIIα by A1 is reversible. CLTA-TagRFP+/+ cells expressing the PtdIns4P sensor EGFP-P4M(DrrA)-Aux1 were treated for 10 min with DMSO alone, or with DMSO and 100 nM A1, and then imaged by TIRF microscopy. To verify reversibility, the medium containing A1 was removed for 30 min and the cells also imaged by TIRF microscopy. c, Representative kymographs from a time series obtained by TIRF microscopy comparing recruitment of the PtdIns(4,5)P2 sensor EGFP-PH(PLCδ1)-Aux1 stably expressed in control CLTA-TagRFP+/+ cells and cells treated with the inhibitor A1. The PtdIns(4,5)P2 sensor was still recruited in the presence of the A1 inhibitor. d, The left panel shows efficient depletion of PIP5K1C mRNA measured by real-time quantitative PCR in CLΓA-TagRFP+/+ cells stably expressing the PtdIns(4,5)P2 sensor EGFP-PH(PLCδ1)-Aux1 (n = 3 independent experiments). The plots show averaged fluorescence intensity traces of the PtdIns(4,5)P2 sensor associated with endocytic clathrin-coated pits identified in 9 control and 11 PIPKIγ-KD cells, grouped in cohorts according to lifetimes. The numbers of analysed traces are shown above each cohort. Data are from time series obtained by TIRF microscopy. e, Genomic PCR analysis showing biallelic integration of the EGFP sequence into the SYNJ1 genomic locus in two clonal gene-edited SUM159 cell lines expressing EGFP-Synj1+/+ and CTLA-TagRFP+/+. Clone A1 was used in this study. f, The representative kymograph from a time series acquired by TIRF microscopy of SUM159 cells double gene-edited for EGFP-Synj1+/+ and CLTA-TagRFP+/+. Representative traces show the fluorescence intensity profile of CLTA-TagRFP (red) and the number of EGFP-Synjl molecules (green) associated with two endocytic events. Synj1 was recruited erratically throughout all stages of clathrin-coated pit formation. g, Knockout of Synjl in gene-edited CLTA-TagRFP+/+ SUM159 cells by CRISPR-Cas9 targeted knockout of SYNJ1. There were minor differences between wild-type and knockout cells in the fluorescence intensities of the recruited PtdIns4P sensor during the early (Cohen’s d = 0.29) and late burst stages (Cohen’s d = 0.12), comparing 1,388 and 1,150 traces from 16 control and 10 knockout cells, respectively. h, Knockdown of Synj1 in gene-edited CLTA-TagRFP+/+ SUM159 cells stably expressing the PtdIns4P sensor EGFP-P4M(DrrA)-Aux1. The left panel shows the efficiency, measured by real-time quantitative PCR, of SYNJ1 mRNA knockdown mediated by lentivirus transduction with shRNA (n = 5 independent experiments). Data in the central and right panels are from time series obtained by TIRF microscopy. There were no significant differences in the fluorescence intensity of the recruited PtdIns4P sensor from the early (Cohen’s d = 0.02) or late burst stages (Cohen’s d = 0.24), comparing 760 and 1,499 traces from 7 control and 9 knockdown cells, respectively. i, Knockdown of Synj1 in COS-7 cells stably expressing TagRFP-CLTA and the PtdIns4P sensor EGFP-P4M(DrrA)-Aux1. The left panel shows the efficiency, measured by real-time quantitative PCR, of SYNJ1 mRNA knockdown mediated by lentivirus transduction with shRNA (n = 3 independent experiments). Data in the central and right panels are from time series obtained by TIRF microscopy. There were no significant differences in the fluorescence intensity of the recruited PtdIns4P sensor from the early (Cohen’s d = 0.05) and late burst stages (Cohen’s d = 0.04), comparing 1,430 and 1,051 traces from 26 control and 25 knockdown cells, respectively. Data are mean ± s.d. in d (bar graph), g-i and mean ± s.e.m. in d (cohorts). Data are representative of at least two independent experiments. Cohen’s d with 95% CI are: [0.21, 0.37] and [0.04, 0.20] (g); [−0.07, 0.11] and [0.15, 0.33] (h); [−0.03, 0.12] and [−0.04, 0.12] (i). The EGFP channel in all the kymographs was shifted laterally by six pixels. Scale bars, 5 μm.
Extended Data Figure 7 |. Effect of interfering, individually or jointly, with the activities of inositol 5-phosphatases on the PtdIns4P and PtdIns(4,5)P2 content of endocytic clathrin-coated structures.
a, Genomic PCR analysis showing biallelic integration of the EGFP sequence into the OCRL genomic locus in the clonal gene-edited EGFP-OCRL+/+ SUM159 cell line. b, Representative kymograph from a time series obtained by TIRF microscopy of EGFP-OCRL+/+ cells transiently expressing mCherry-CLTA, showing the burst-like recruitment of EGFP-OCRL during vesicle uncoating. The EGFP channel was shifted laterally by six pixels. Scale bar, 5 μm. c, Distribution of the maximum number of EGFP-OCRL molecules recruited during uncoating to individual clathrin-coated vesicles in EGFP-OCRL+/+ cells (606 traces from 12 cells). d, Representative plot of one endocytic event showing fluorescence intensity traces of EGFP-OCRL (expressed as number of recruited molecules) and the PtdIns4P sensor mCherry-P4M(DrrA)-Aux1 from a time series obtained by TIRF microscopy of double gene-edited EGFP-OCRL+/+ cells expressing the PtdIns4P sensor. e, Expression of OCRL was eliminated in CLTA-TagRFP+/+ cells by CRISPR-Cas9 targeted knockout of OCRL as determined by western-blot analysis using antibodies against OCRL and actin (loading control). The fluorescence intensities of the recruited PtdIns4P sensor were obtained by comparing 1,177 and 1,015 traces from 10 control and 11 knockout cells, respectively. f, Reduction in the expression of OCRL mediated by siRNA in CLTA-TagRFP+/+ cells was confirmed by western blot analysis using antibodies against OCRL and actin. CLTA-TagRFP+/+ cells stably expressing the PtdIns4P sensor EGFP-P4M(DrrA)-Aux1 were treated with siRNA targeting either OCRL or a control sequence, and imaged by TIRF microscopy. No significant differences were observed in the fluorescence intensity associated with the recruitment of the PtdIns4P sensor during the early (Cohen’s d = 0.04) or late burst stages (Cohen’s d = 0.20) in 740 and 1,442 traces from 6 control and 5 knockdown cells, respectively. g, Knockdown of OCRL in COS-7 cells stably expressing TagRFP-CLTA and the PtdIns4P sensor EGFP-P4M(DrrA)-Aux1. Efficiency of OCRL depletion by siRNA was determined by real-time quantitative PCR (n = 3 independent experiments). PtdIns4P sensor recruitment data obtained from time series obtained by TIRF microscopy showed there were no significant differences in the fluorescence intensity of the recruited PtdIns4P sensor from the early (Cohen’s d = 0.09) and late burst stages (Cohen’s d = 0.09), comparing 709 and 848 traces from 15 control and 17 knockdown cells, respectively. h, Elimination of Synjl together with approximately 80% depletion of OCRL (Synjl-KO + OCRL-KD) increased the recruitment of the PtdIns(4,5)P2 sensor to coated pits and vesicles. Expression was reduced by CRISPR-Cas9 targeted knockout of OCRL or Synjl and by siRNA of OCRL in CLTA-TagRFP+/+ cells transiently expressing the PtdIns(4,5)P2 sensor EGFP-PH(PLCδ1)-Aux1. The cells were imaged by TIRF microscopy, and the plots show the maximum fluorescence intensity of the PtdIns(4,5)P2 sensor recruited at the approximate time of vesicle budding (1,436, 843, 2,142, 897 and 1,674 traces) and the lifetimes of the coated vesicles (1,851, 1,320, 2,534, 1,076 and 1,876 traces) from 10 control, 9 OCRL-KO, 11 OCRL-KD, 11 Synj1-KO and 11 Synj1-KO + OCRL-KD cells, respectively. The recruitment of the PtdIns(4,5) P2 sensor in Synj1-KO + OCRL-KD cells was significantly higher than control cells (Cohen’s d = 0.53). i, Elimination of Synj1 together with approximately 80% depletion of OCRL (Synj1-KO + OCRL-KD) did not affect recruitment of the PtdIns3P sensor (Cohen’s d = 0.17) to coated vesicles, comparing 918 and 990 traces from 14 control and 15 Synj1-KO + OCRL-KD cells, respectively. j, The expression levels of mRNA for OCRL and SYNJ1, measured by real time quantitative PCR, in control, OCRL-KD and Synj1-KD cells (n = 4 experiments for OCRL-KD and n = 3 experiments for Synj1-KD). Data are mean ± s.d. Data are representative of at least two independent experiments. Cohen’s d with 95% CI are: [−0.05, 0.12] and [0.11, 0.28] (f); [−0.01, 0.19] and [−0.01, 0.19] (g); [0.46, 0.60] (h); [0.08, 0.26] (i).
Extended Data Figure 8 |. No changes in the PtdIns(3,4)P2 content of endocytic clathrin-coated structures induced by interference with the activity of candidate inositol kinases.
a, Genomic PCR analysis (left) showing single allelic integration of the EGFP sequence into the PIK3C2A genomic locus in the clonal gene-edited EGFP-PI3K-C2α+/− SUM159 cells. Western blot analysis (right) of cell lysates probed with antibodies against PI3K-C2α and actin from SUM159 cells and EGFP-PI3K-C2α+/− cells show expression of EGFP-PI3K-C2α. b, Dual gene-edited EGFP-PI3K-C2α+/− and CLTA-TagRFP+/+ SUM159 cells were imaged by TIRF microscopy. The plots show averaged fluorescence intensity traces (mean ± s.e.m.) of CLTA-TagRFP and EGFP-PI3K-C2α corresponding to the cohort of coated pits lasting 40–60 s (237 traces from 6 cells). c, Representative plot from a time series obtained by TIRF microscopy of a EGFP-PI3K-C2α+/− cell transiently expressing the PtdIns3P sensor mCherry-2 × FYVE(Hrs)-Aux1. The tracing highlights the presence of a few copies of EGFP-PI3K-C2α at the time the PtdIns3P burst was detected. d, CLTA-TagRFP+/+ cells transiently expressing EGFP-PI3K-C2α were imaged by TIRF microscopy. The plots show averaged fluorescence intensity traces (mean ± s.e.m.) of CLTA-TagRFP and EGFP-PI3K-C2α corresponding to the cohort of coated pits lasting 40–60 s (697 traces from 10 cells). e, Reduction in the expression of PI3K-C2α following treatment with siRNA was confirmed by western blot analysis using antibodies against PI3K-C2α and actin. f, PI3K-C2α is partially required for the burst recruitment of the PtdIns3P sensor. SUM159 cells stably expressing the PtdIns3P sensor EGFP-2×FYVE(Hrs)-Aux1 were treated with control siRNA (1) or with siRNA specific for PI3K-C2α (2) to transiently deplete its expression. Cells treated with siRNA for PI3K-C2α were also transfected with either siRNA-resistant wild-type mCherry-PI3K-C2α (3) or kinase-deficient mCherry-kdPI3K-C2α (4) one day before TIRF imaging. Burst recruitment of the PtdIns3P sensor was prevented by depletion of PI3K-C2α (Cohen’s d = 0.52, comparing 2,150 and 674 traces from 10 control cells and 10 PI3K-C2α-KD cells, respectively) and was only rescued upon expression of wild-type mCherry-PI3K-C2α (Cohen’s d = 0.72, comparing 3,304 and 674 traces from 9 wild-type PI3K-C2α-expressing cells and 10 PI3K-C2α-KD cells, respectively) but not the kinase-deficient mCherry-kdPI3K-C2α (Cohen’s d = 0.11, comparing 1,113 and 674 traces from 12 kinase-deficient PI3K-C2α-expressing cells and 10 PI3K-C2α-KD cells, respectively). g, CLTA-TagRFP+/+ cells stably expressing the PtdIns(3,4)P2 sensor EGFP-2 × PH(TAPP1)-Aux1 were treated with control siRNA or with siRNA specific for PI3K-C2α to transiently deplete its expression. Data analysis from time series obtained by TIRF microscopy showed that PI3K-C2α depletion did not affect the maximum fluorescence intensity of the recruited PtdIns(3,4)P2 sensor (Cohen’s d = 0.05) determined for 1,136 and 1,579 traces from 10 control and 10 PI3K-C2α-KD cells, respectively. h, CLTA-TagRFP+/+ cells stably expressing the PtdIns4P sensor EGFP-P4M(DrrA)-Aux1 were treated with siRNA to knockdown the expression of PI3K-C2α, and time series were obtained by TIRF microscopy. PI3K-C2α depletion did not affect the fluorescence intensity of the recruited PtdIns4P sensor during the early (Cohen’s d = 0.07) or late burst stages (Cohen’s d = 0.09), determined for 1,394 and 2,316 traces from 11 control cells and 12 PI3K-C2α-KD cells, respectively. i, PI3K-C2α is partially required for the burst recruitment of the PtdIns3P sensor in COS-7 cells stably expressing TagRFP-CLTA together with the PtdIns3P sensor EGFP-2×FYVE(Hrs)-Aux1 or the PtdIns(3,4)P2 sensor EGFP-2 ×PH(TAPP1)-Aux1. The efficiency of PI3K-C2α depletion was determined by real-time quantitative PCR (left, n = 4 independent experiments). Analysis of time series obtained by TIRF microscopy shows a significant decrease in the recruitment of the PtdIns3P sensor (middle, Cohen’s d = 0.82) in cells depleted of PI3K-C2α (569 traces from 16 cells) when compared with cells treated with control siRNA (787 traces from 12 cells). PI3K-C2α depletion did not affect the maximum fluorescence intensity of the recruited PtdIns(3,4)P2 sensor (right, Cohen’s d = 0.10) determined for 1,229 and 1,158 traces from 24 control and 27 PI3K-C2α-KD cells, respectively. j, Inhibition of Vps34 by the small molecule VPS34-IN1. CLTA-TagRFP+/+ cells stably expressing the PtdIns3P sensor EGFP-2 × FYVE(Hrs)-Aux1 were treated for 1 h with 5 μM VPS34-IN1 and time series obtained by TIRF microscopy. Inhibition of Vps34 did not affect the maximum fluorescence intensity of the recruited PtdIns3P sensor during the late burst stage of recruitment (Cohen’s d = 0.01), comparing 853 and 522 traces from 9 control DMSO and 12 VPS34-IN1 treated cells, respectively. k, INPP4A is partially required for the burst recruitment of the PtdIns3P sensor. Efficiency of INPP4A depletion by siRNA in CLTA-TagRFP+/+ cells stably expressing the PtdIns3P sensor EGFP-2 × FYVE(Hrs)-Aux1 or the PtdIns(3,4)P2 sensor EGFP-2×PH(TAPP1)-Aux1 was determined by real-time quantitative PCR (left, n = 3 independent experiments, mean ± s.d.). Analysis of time series obtained by TIRF microscopy (middle) shows a significant decrease in the recruitment of the PtdIns3P sensor (Cohen’s d = 0.64) in cells depleted of INPP4A (511 traces from 12 cells) when compared with cells treated with control siRNA (1,179 traces from 9 cells). INPP4A depletion has a minor effect on the recruitment of the PtdIns(3,4)P2 sensor (Cohen’s d = 0.23) determined for 866 and 274 traces from 13 control and 14 INPP4A-KD cells, respectively. INPP4A-depleted cells (n = 12) had significantly more arrested pits than control cells (n = 9) (right, P = 0.0002, unpaired two-tailed Student’s í-test). Data are mean ± s.e.m. in b, d and mean ± s.d. in f-k. Data are representative of at least two independent experiments. Cohen’s d with 95% CI are: [0.43, 0.61], [0.64, 0.81] and [0.02, 0.21] (f); [−0.03, 0.12] (g); [0.00, 0.13] and [0.02, 0.15] (h); [0.71, 0.93] and [0.02, 0.18] (i); [−0.10, 0.12] (j); [0.53, 0.74] and [0.09, 0.37] (k).
Extended Data Figure 9 |. Recruitment of Rab5 to clathrin-derived endocytic carriers.
a, Genomic PCR analysis showing biallelic integration of the EGFP sequence into the RAB5A genomic locus in gene-edited EGFP-Rab5a+/+ SUM159 cells (left), into the RAB5A and RAB5C genomic loci of EGFP-Rab5a+/+ EGFP-Rab5c+/+ SUM159 cells (middle), and into the RAB5C genomic locus of CLTA-TagRFP+/+ EGFP-Rab5c+/+ SUM159 cells (right), respectively. b, Rab5a was not recruited to clathrin-coated pits or vesicles; the onset of recruitment followed conclusion of the uncoating stage of endocytic clathrin-coated vesicles (events 1 and 4). EGFP-Rab5a+/+ cells transiently expressing mCherry-CLTA were imaged by TIRF microscopy. The representative kymograph and fluorescence intensity traces including the number of recruited Rab5a molecules are shown for four endocytic events. c, EGFP-Rab5a+/+ cells transiently expressing mRFP-EEA1 were imaged at the middle plane by spinning-disk confocal microscopy. d, Neither Rab5a nor Rab5c in gene-edited cells were recruited to clathrin-coated pits or vesicles; the onset of recruitment followed conclusion of the uncoating stage of endocytic clathrin-coated vesicles. EGFP-Rab5a+/+ and EGFP-Rab5c+/+ cells transiently expressing mCherry-CLTA were imaged by TIRF microscopy. The representative kymograph and fluorescence intensity traces including the number of recruited Rab5a and Rab5c molecules for three endocytic events are shown. e, Rab5c was not recruited to clathrin-coated pits or vesicles in gene-edited SVGA EGFP-Rab5c+/+ cells transiently expressing mCherry-CLTA. The cells were imaged by TIRF microscopy. A representative kymograph and fluorescence intensity traces for one endocytic event (arrow) are shown. f, Transiently expressed EGFP-Rab5a was not recruited to clathrin-coated pits or vesicles in CLTA-TagRFP+/+ SUM159 cells. Cells were imaged by TIRF microscopy. The representative kymograph and fluorescence intensity traces including the number of recruited Rab5a molecules for one endocytic event (arrow) are shown. The EGFP channel in all the kymographs with EGFP and mCherry or TagRFP overlaid was shifted laterally by six pixels. Data are representative of two independent experiments. Scale bars, 5 μm.
Extended Data Figure 10 |. Endocytic clathrin-coated vesicles acquire Rab5 before fusing with endosomes.
a, EGFP-Rab5c+/+ SUM159 cells transiently expressing the Auxl-based PtdIns(3,4)P2 sensor mCherry-2× PH(TAPP1)-Aux1 were imaged in 3D by lattice light-sheet microscopy (time series 300 s in duration, where each time point consisted of a stack of 41 planes spaced approximately 261 nm apart imaged with an approximately 2.5-s interval between stacks). The 3D plot (left) shows the 3D position of every one of the tracked PtdIns(3,4)P2-containing objects colour-coded from red to green (colour bar) as the linear ratio of recruited PtdIns(3,4)P2 sensor with respect to the amount of Rab5c content changed over time. The 3D data are from 1,265 traces detected in 16 cells from 2 independent experiments. The directed movement of the traces starting at (0,0,0) becomes apparent when the capture of Rab5c becomes significant (left; Supplementary Video 7). The panel on the right shows the displacement of PtdIns(3,4)P2-containing objects versus the square root of time traces. The objects tracked at the top and bottom of the cell are shown in light blue and green, and their averages are shown in dark blue and green, respectively. The PtdIns(3,4)P2-containing objects tracked at the top and bottom of the cell (right) display a linear dependence of displacement with the square root of time consistent with non-directional 3D Brownian motion. The individual traces are depicted in light blue and green and the plots include the corresponding average displacements calculated for each time point (dark colour) and their fitted linear regressions (dashed lines with slopes of 0.19 ± 0.02 and 0.16 ± 0.02, respectively). b, Rab5 in endocytic carriers derived from clathrin-coated vesicles does not contain the early endosomal marker EEA1. EGFP-Rab5c+/+ SUM159 cells transiently expressing HaloTag-EEA1 and the PtdIns(3,4)P2 sensor mCherry-2×PH(TAPP1)-Aux1 were briefly incubated with the HaloTag ligand labelled with the Janelia Fluor 646 dye and then imaged at their bottom surface by spinning-disk confocal microscopy. The representative kymograph and fluorescence intensity traces for one endocytic event (arrow) are shown. Data are representative of two independent experiments. Scale bars, 5 μm. c, Depletion efficiency of the Rab5 GEFs hRME-6 or Rabex5 mRNA by siRNA in double gene-edited CLTA-TagRFP+/+ and EGFP-Rab5c+/+ SUM159 cells was determined by realtime quantitative PCR (upper left panel, n = 3 independent experiments, mean ± s.d.). The control or knockdown cells were imaged by TIRF microscopy. Rabex5 or hRME-6 depletion has a minor effect on the lifetime distributions of coated pits as determined from 1,097, 1,793, 1,829 and 1,782 traces (mean ± s.d.) imaged in 8 control, 11 Rabex5-KD, 10 hRME-6-KD and 11 Rabex5-KD + hRME-6-KD cells, respectively (upper right panel; Cohen’s d = 0.01, 0.11 and 0.15 with 95% CI [−0.06, 0.09], [0.03, 0.18] and [0.07, 0.22], respectively). The plots (lower panels) show averaged fluorescence intensity traces (mean ± s.e.m.) of EGFP-Rab5c (green) recruited during the uncoating stage of endocytic clathrin-coated vesicles (red) in control or knockdown cells. The numbers of analysed traces are shown above each cohort.
Supplementary Material
Acknowledgements
We thank D. Alessi, T. Balla, P. De Camilli, O. Gozani, L. Lavis, H. Stenmark, T. Takenawa and Y Takuwa for reagents; J. R. Houser for maintaining the TIRF and spinning-disk microscopes; J. England for advice and support; members of our laboratory for help and encouragement; and in particular S. C. Harrison for discussions and editorial help. R.M. was supported by a National Defense Science and Engineering Graduate (NDSEG) Fellowship from the DoD Air Force Office of Scientific Research and E.S. by the National Natural Science Foundation of China (31770900, 31270884, 30900268), the Beijing Natural Science Foundation (5122026, 5092017) and the Youth Innovation Promotion Association of the Chinese Academy of Sciences (2011087). S.U. is a Fellow at the Image and Data Analysis core at Harvard Medical School and thanks H. Elliott and D. Richmond for discussions, and acknowledges the MATLAB code repository received from the Computational Image Analysis Workshop supported by NIH grant GM103792. T.K. acknowledges support from the Janelia Visitor Program and thanks E. Betzig, E. Marino, T Liu and W. Legant for help and advice in constructing and installing the lattice light-sheet microscope. Construction of the lattice light-sheet microscope was supported by grants from Biogen and Ionis Pharmaceuticals to TK. The research was supported by NIH grant NIH R01 GM075252 to T.K.
Footnotes
Online Content Methods, along with any additional Extended Data display items and Source Data, are available in the online version of the paper; references unique to these sections appear only in the online paper.
Supplementary Information is available in the online version of the paper
The authors declare no competing financial interests.
Publisher's Disclaimer: Readers are welcome to comment on the online version of the paper Publisher’s note: Springer Nature remains neutral with regard to jurisdictional claims in published maps and institutional affiliations.
References
- 1.Vance JE & Steenbergen R Metabolism and functions of phosphatidylserine. Prog. Lipid Res 44, 207–234 (2005). [DOI] [PubMed] [Google Scholar]
- 2.Balla T Phosphoinositides: tiny lipids with giant impact on cell regulation. Physiol. Rev 93, 1019–1137 (2013). [DOI] [PMC free article] [PubMed] [Google Scholar]
- 3.Di Paolo G & De Camilli P Phosphoinositides in cell regulation and membrane dynamics. Nature 443, 651–657 (2006). [DOI] [PubMed] [Google Scholar]
- 4.Massol RH, Boll W, Griffin AM & Kirchhausen T A burst of auxilin recruitment determines the onset of clathrin-coated vesicle uncoating. Proc. Natl Acad. Sci. USA 103, 10265–10270 (2006). [DOI] [PMC free article] [PubMed] [Google Scholar]
- 5.Mills IG et al. EpsinR: an AP1/clathrin interacting protein involved in vesicle trafficking. J. Cell Biol 160, 213–222 (2003). [DOI] [PMC free article] [PubMed] [Google Scholar]
- 6.Messa M et al. Epsin deficiency impairs endocytosis by stalling the actin-dependent invagination of endocytic clathrin-coated pits. eLife 3, e03311 (2014). [DOI] [PMC free article] [PubMed] [Google Scholar]
- 7.Lee DW, Wu X, Eisenberg E & Greene LE Recruitment dynamics of GAK and auxilin to clathrin-coated pits during endocytosis. J. Cell Sci 119, 3502–3512 (2006). [DOI] [PubMed] [Google Scholar]
- 8.Guan R, Dai H, Harrison SC & Kirchhausen T Structure of the PTEN-like region of auxilin, a detector of clathrin-coated vesicle budding. Structure 18, 1191–1198 (2010). [DOI] [PMC free article] [PubMed] [Google Scholar]
- 9.Fotin A et al. Structure of an auxilin-bound clathrin coat and its implications for the mechanism of uncoating. Nature 432, 649–653 (2004). [DOI] [PubMed] [Google Scholar]
- 10.Aguet F, Antonescu CN, Mettlen M, Schmid SL & Danuser G Advances in analysis of low signal-to-noise images link dynamin and AP2 to the functions of an endocytic checkpoint. Dev. Cell 26, 279–291 (2013). [DOI] [PMC free article] [PubMed] [Google Scholar]
- 11.Chen BC et al. Lattice light-sheet microscopy: imaging molecules to embryos at high spatiotemporal resolution. Science 346, 1257998 (2014). [DOI] [PMC free article] [PubMed] [Google Scholar]
- 12.Várnai P & Balla T Visualization of phosphoinositides that bind pleckstrin homology domains: calcium-and agonist-induced dynamic changes and relationship to myo-[3H]inositol-labeled phosphoinositide pools. J. Cell Biol 143, 501–510 (1998). [DOI] [PMC free article] [PubMed] [Google Scholar]
- 13.Temmerman K et al. A direct role for phosphatidylinositol-4,5-bisphosphate in unconventional secretion of fibroblast growth factor 2. Traffic 9, 1204–1217 (2008). [DOI] [PubMed] [Google Scholar]
- 14.Idevall-Hagren O, Dickson EJ, Hille B, Toomre DK & De Camilli P Optogenetic control of phosphoinositide metabolism. Proc. Natl Acad. Sci. USA 109, E2316–E2323 (2012). [DOI] [PMC free article] [PubMed] [Google Scholar]
- 15.Boucrot E, Saffarian S, Massol R, Kirchhausen T & Ehrlich M Role of lipids and actin in the formation of clathrin-coated pits. Exp. Cell Res. 312, 4036–4048 (2006). [DOI] [PMC free article] [PubMed] [Google Scholar]
- 16.Zoncu R et al. Loss of endocytic clathrin-coated pits upon acute depletion of phosphatidylinositol 4,5-bisphosphate. Proc. Natl Acad. Sci. USA 104, 3793–3798 (2007). [DOI] [PMC free article] [PubMed] [Google Scholar]
- 17.Gillooly DJ et al. Localization of phosphatidylinositol 3-phosphate in yeast and mammalian cells. EMBO J. 19, 4577–4588 (2000). [DOI] [PMC free article] [PubMed] [Google Scholar]
- 18.Hammond GR, Machner MP & Balla T A novel probe for phosphatidylinositol 4-phosphate reveals multiple pools beyond the Golgi. J. Cell Biol 205, 113–126 (2014). [DOI] [PMC free article] [PubMed] [Google Scholar]
- 19.Zhu Y et al. Structural mechanism of host Rab1 activation by the bifunctional Legionella type IV effector SidM/DrrA. Proc. Natl Acad. Sci. USA 107, 4699–4704 (2010). [DOI] [PMC free article] [PubMed] [Google Scholar]
- 20.Posor Y et al. Spatiotemporal control of endocytosis by phosphatidylinositol-3,4-bisphosphate. Nature 499, 233–237 (2013). [DOI] [PubMed] [Google Scholar]
- 21.Cocucci E, Gaudin R & Kirchhausen T Dynamin recruitment and membrane scission at the neck of a clathrin-coated pit. Mol. Biol. Cell 25, 3595–3609 (2014). [DOI] [PMC free article] [PubMed] [Google Scholar]
- 22.Schmid SL & Frolov VA Dynamin: functional design of a membrane fission catalyst. Annu. Rev. Cell Dev. Biol 27, 79–105 (2011). [DOI] [PubMed] [Google Scholar]
- 23.Oikawa T, Itoh T & Takenawa T Sequential signals toward podosome formation in NIH-src cells. J. Cell Biol 182, 157–169 (2008). [DOI] [PMC free article] [PubMed] [Google Scholar]
- 24.De Matteis MA, Staiano L, Emma F & Devuyst O The 5-phosphatase OCRL in Lowe syndrome and Dent disease 2. Nat. Rev. Nephrol 13, 455–470 (2017). [DOI] [PubMed] [Google Scholar]
- 25.Cremona O et al. Essential role of phosphoinositide metabolism in synaptic vesicle recycling. Cell 99, 179–188 (1999). [DOI] [PubMed] [Google Scholar]
- 26.Villaseñor R, Kalaidzidis Y & Zerial M Signal processing by the endosomal system. Curr. Opin. Cell Biol 39, 53–60 (2016). [DOI] [PubMed] [Google Scholar]
- 27.Chou YY et al. Identification and characterization of a novel broad-spectrum virus entry inhibitor. J. Virol 90, 4494–4510 (2016). [DOI] [PMC free article] [PubMed] [Google Scholar]
- 28.Bojjireddy N et al. Pharmacological and genetic targeting of the PI4KA enzyme reveals its important role in maintaining plasma membrane phosphatidylinositol 4-phosphate and phosphatidylinositol 4,5-bisphosphate levels. J. Biol. Chem 289, 6120–6132 (2014). [DOI] [PMC free article] [PubMed] [Google Scholar]
- 29.Dowdle WE et al. Selective VPS34 inhibitor blocks autophagy and uncovers a role for NCOA4 in ferritin degradation and iron homeostasis in vivo. Nat. Cell Biol 16, 1069–1079 (2014). [DOI] [PubMed] [Google Scholar]
- 30.Bago R et al. Characterization of VPS34-IN1, a selective inhibitor of Vps34, reveals that the phosphatidylinositol 3-phosphate-binding SGK3 protein kinase is a downstream target of class III phosphoinositide 3-kinase. Biochem. J 463, 413–427 (2014). [DOI] [PMC free article] [PubMed] [Google Scholar]
- 31.Grimm JB et al. A general method to improve fluorophores for live-cell and single-molecule microscopy. Nat. Methods 12, 244–250 (2015). [DOI] [PMC free article] [PubMed] [Google Scholar]
- 32.Gozani O et al. The PHD finger of the chromatin-associated protein ING2 functions as a nuclear phosphoinositide receptor. Cell 114, 99–111 (2003). [DOI] [PubMed] [Google Scholar]
- 33.Várnai P, Rother KI & Balla T Phosphatidylinositol 3-kinase-dependent membrane association of the Bruton’s tyrosine kinase pleckstrin homology domain visualized in single living cells. J. Biol. Chem 274, 10983–10989 (1999). [DOI] [PubMed] [Google Scholar]
- 34.Yoshioka K et al. Endothelial PI3K-C2α, a class II PI3K, has an essential role in angiogenesis and vascular barrier function. Nat. Med 18, 1560–1569 (2012). [DOI] [PubMed] [Google Scholar]
- 35.Cocucci E, Aguet F, Boulant S & Kirchhausen T The first five seconds in the life of a clathrin-coated pit. Cell 150, 495–507 (2012). [DOI] [PMC free article] [PubMed] [Google Scholar]
- 36.Lawe DC, Patki V, Heller-Harrison R, Lambright D & Corvera S The FYVE domain of early endosome antigen 1 is required for both phosphatidylinositol 3-phosphate and Rab5 binding. Critical role of this dual interaction for endosomal localization. J. Biol. Chem 275, 3699–3705 (2000). [DOI] [PubMed] [Google Scholar]
- 37.Forozan F et al. Molecular cytogenetic analysis of 11 new breast cancer cell lines. Br. J. Cancer 81, 1328–1334 (1999). [DOI] [PMC free article] [PubMed] [Google Scholar]
- 38.Nández R et al. A role of OCRL in clathrin-coated pit dynamics and uncoating revealed by studies of Lowe syndrome cells. eLife 3, e02975 (2014). [DOI] [PMC free article] [PubMed] [Google Scholar]
- 39.Suchy SF & Nussbaum RL The deficiency of PIP2 5-phosphatase in Lowe syndrome affects actin polymerization. Am. J. Hum. Genet 71, 1420–1427 (2002). [DOI] [PMC free article] [PubMed] [Google Scholar]
- 40.Ran FA et al. Genome engineering using the CRISPR-Cas9 system. Nat. Protocols 8, 2281–2308 (2013). [DOI] [PMC free article] [PubMed] [Google Scholar]
- 41.Sanjana NE et al. A transcription activator-like effector toolbox for genome engineering. Nat. Protocols 7, 171–192 (2012). [DOI] [PMC free article] [PubMed] [Google Scholar]
- 42.Shalem O et al. Genome-scale CRISPR-Cas9 knockout screening in human cells. Science 343, 84–87 (2014). [DOI] [PMC free article] [PubMed] [Google Scholar]
- 43.Kasai RS et al. Full characterization of GPCR monomer-dimer dynamic equilibrium by single molecule imaging. J. Cell Biol 192, 463–480 (2011). [DOI] [PMC free article] [PubMed] [Google Scholar]
- 44.Zhang K, Chowdary P D. & Cui, B. Visualizing directional Rab7 and TrkA cotrafficking in axons by pTIRF microscopy. Methods Mol. Biol 1298, 319–329 (2015). [DOI] [PMC free article] [PubMed] [Google Scholar]
- 45.Kadlecova Z et al. Regulation of clathrin-mediated endocytosis by hierarchical allosteric activation of AP2. J. Cell Biol 216, 167–179 (2017). [DOI] [PMC free article] [PubMed] [Google Scholar]
- 46.Aguet F et al. Membrane dynamics of dividing cells imaged by lattice light-sheet microscopy. Mol. Biol. Cell 27, 3418–3435 (2016). [DOI] [PMC free article] [PubMed] [Google Scholar]
- 47.Cohen J Statistical Power Analysis for the Behavioral Sciences 2nd edn (L. Erlbaum Associates, 1988). [Google Scholar]
Associated Data
This section collects any data citations, data availability statements, or supplementary materials included in this article.
Supplementary Materials
Data Availability Statement
The data that support the findings of the current study are available from the corresponding author upon reasonable request. The full gel source data have been provided in Supplementary Fig. 1.


