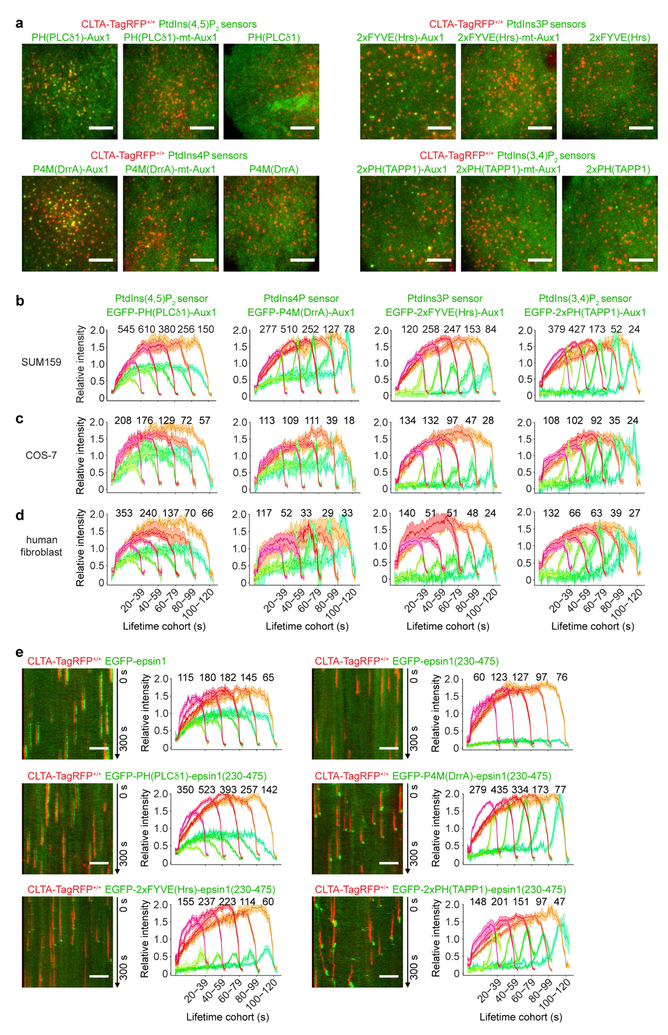
Extended Data Figure 4 |. Expression of the Auxl-based sensors in SUM159 cells, COS-7 cells and human fibroblasts, and expression of the chimaeric sensors containing the epsin1 clathrin-binding domain in SUM159 cells.
a, Bottom surfaces of CLTA-TagRFP+/+ cells transiently expressing EGFP-tagged sensors specific for PtdIns(4,5)P2, PtdIns3P, PtdIns4P and PtdIns(3,4)P2, imaged by TIRF microscopy for 300 s at 1-s intervals. Each set of results shows data obtained from a wild-type Aux1-based sensor specific to the corresponding phosphoinositide (left), an Aux1-based sensor mutated to eliminate phosphoinositide binding (middle) and a general sensor with defined phosphoinositide specificity (right). The representative images correspond to a single time point. b, Gene-edited CLTA-TagRFP+/+ SUM159 cells stably expressing the indicated Auxl-based phosphoinositide sensors were imaged by TIRF microscopy. The plots show average fluorescence intensity traces (mean ± s.e.m.) of TagRFP-CLTA (red) and the phosphoinositide sensors (green) tracked in 17, 10, 12 and 14 cells and then grouped by cohorts according to their lifetimes. The numbers of analysed traces are shown above each cohort. c, COS-7 cells stably expressing TagRFP-CLTA and the indicated Auxl-based phosphoinositide sensors were imaged by TIRF microscopy and the traces from 7, 10, 9 and 18 cells were analysed as described in b. d, Human fibroblasts stably expressing TagRFP-CLTA and transiently expressing the Auxl-based phosphoinositide sensors were imaged by TIRF microscopy and the traces from 14, 11, 23 and 21 cells were analysed as described in b. e, The EGFP-tagged full-length epsin1, its EGFP-tagged clathrin-binding domain (residues 230–475), or EGFP-tagged sensors containing the indicated protein domains specific for defined phosphoinositides fused at their C terminus to the epsin1 clathrin-binding domain were transiently expressed in CLTA-TagRFP+/+ SUM159 cells and imaged by TIRF microscopy. The EGFP channel in the kymographs was shifted laterally by six pixels. The plots show averaged fluorescence intensity traces (mean ± s.e.m.) of CLTA-TagRFP (red) and the epsin1-based sensors (green) identified in 7, 8, 13, 11, 15 and 14 cells and then grouped by cohorts according to lifetimes. The numbers of analysed traces are shown above each cohort. Data are representative of at least two independent experiments. Scale bars, 5 μm.

