

Abstract
In order to generate and maintain a functional T cell receptor diversity, thymocyte development has to be a tightly organized process. Errors can have dramatic consequences, leading to, for instance, autoimmune diseases. Probably for this reason the thymus reacts to stressors like sepsis with involution, i.e. a decrease of thymocytes. Here we show in the cecal ligation and puncture (CLP) mouse model of polymicrobial sepsis that predominantly immature thymocytes are reduced. The number of immature single positive (ISP) thymocytes was mostly diminished (CLP/sham: 14.4 % (24 h), 0.1 % (48 h)), consequently associated with the highest rate of apoptosis (8.4 (CLP) vs. 2.2 % (sham)), followed by the reduction of double positive (DP) thymocytes (CLP/sham: 21.7 % (24 h), 0.1 % (48 h); apoptosis: 2.5 % (CLP) vs. 0.7 % (sham)). Analyzing T cell receptor excision circles (TREC), we found that the egress of mature thymocytes was not inhibited. Real-time qPCR analysis suggested an interference of Notch receptor expression on thymocytes and the respective ligands on thymic stromal cells during CLP-dependent sepsis, which might be responsible for altered thymocyte viability in CLP-dependent sepsis.
Keywords: ISP, DP, thymocyte depletion, CLP, sepsis
INTRODUCTION
During T cell differentiation, thymocytes pass through a series of selection processes to generate a maximum of foreign antigen recognition while simultaneously limiting recognition of self-antigens (1, 2). Therefore, thymocyte development is a strictly controlled process. Crucial for differentiation and survival is an inductive intra-thymic environment, which is mainly delivered by thymic epithelial cells (TEC) and dendritic cells (1–3). Thymocytes can be differentiated by surface expression of the co-receptor molecules CD4 and CD8 (2). When entering the thymus, cells are double negative (DN) for these markers. DN thymocytes can be further subdivided by expression of the cell-cell-adhesion protein CD44 and the alpha chain of the interleukin-2 (IL-2) receptor, CD25, from immature to mature into DN1 – DN4 (1, 2). DN thymocytes initiate T cell receptor (TCR) rearrangement by recombination of the TCR β chain (1, 2). This process ends with β-selection at the DN3 state. Afterwards, thymocytes start a final clonal expansion and the recombination of the TCR α chain. Here, the cells temporarily express either CD4 or CD8 and are therefore termed immature single positive (ISP) thymocytes (2, 4, 5). During their further differentiation, thymocytes express both of the two co-receptor in parallel and are then termed double positive (DP) (2). The expansion is finished with the positive selection of the TCR at the DP state. This is followed by the negative selection of the TCR and the commitment to either the CD4+ or the CD8+ single positive (SP) lineage. Finally, SP thymocytes leave the thymus via corticomedullary blood vessels (6).
Stress, such as sepsis, disrupts the homeostatic balance of the immune system and causes acute thymic involution (7). This is particularly associated with a loss of immature thymocytes (8). Hereby apoptosis plays a central role. Apoptosis can be induced by TNF-α or likewise by other mechanisms as for instance FasL or corticosteroid-mediated (9–11). But also a reduced thymic immigration of progenitor cells form the bone marrow and differentiation of early thymocytes seems to contribute to thymus involution (20). Using the cecal ligation and puncture (CLP) as murine polymicrobial sepsis model we analyzed thymocyte development 24 h and 48 h after sepsis induction by fluorescence activated cell sorting (FACS) (12, 13). Our intention was to understand at which level thymocyte development is influenced during sepsis. We questioned whether cell decline originates from one distinct thymocyte subpopulation, or whether thymic involution is caused by an active inhibition of thymic output during sepsis in order to prevent emigration of nonfunctional thymocytes.
MATERIAL AND METHODS
CLP sepsis
For sufficient analgesia and sedation wild type C57BL/6NHsd mice were treated by ketamine and xylacine (0.15 mg : 0.0075 mg/g body weight). After removing hairs the lower abdomen was opened by median laparotomy of the skin and peritoneum. Cecum then was ligated at the upper third distal of the ileocolic valve and punctured by a 21 g needle. Finally, abdomen was sealed by continuous abdominal stitch and a clip suture. To compensate the loss of fluid 1 ml isotonic saline was applied intraperitoneally. For analgesia animals received s.c. 0.05 µg/g body weight buprenorphine every 8 hours. The outcome was analyzed after 24 h and 48 h.
Isolation of thymocytes, whole blood and spleen cells
Prior to cell isolation animals were sedated by isoflurane. At first, blood was drawn retrobulbar, immediately transferred into an EDTA tube and stored on ice. Hereafter, mice were euthanized by neck fracture. Spleen and thymus were isolated, transferred into phosphate buffered saline and stored on ice. Blood was then treated by 1 µl/100 µl anti CD16/CD32 (Fc block). 100 µl blood was immediately transferred into an ice cooled FACS tube and incubated on ice for at least 20 minutes. The rest of the blood was transferred into a 15 ml tube for TREC analysis. Thymus cells were separated through a 40 μm cell strainer. Remnants, which mainly contain thymic stroma cells, were collected dry into a 1 ml tube and stored at −80 °C till further treatment. Thymic single cell suspension was then centrifuged (5 min, 500 x g, 4 °C) and resuspended in 1 ml MACS buffer (0,5 % BSA, 0,02 % NaN3, 2 mM EDTA in PBS, pH 7,4). Spleen cells were separated through a cell strainer according to thymic cells. After centrifugation (5 min, 500 x g, 4 °C) and removing supernatant, erythrocyte lysis was performed by resuspending cell pellet in 8 ml BD Pharm Lyse™ for 5 minutes at RT. Lysis was stopped by adding the same volume of PBS. Cells were then centrifuged (5 min, 500 x g, 4 °C), washed in 5 ml PBS, resuspended in 2 ml MACS buffer and stored on ice till further treatment.
Flow cytometry and cell sorting
For FACS analysis of blood cells 100 µl of anti CD16/CD32-treated whole blood was stained by commercially available antibodies (Supplementary Table 1). After lysis of erythrocytes with 2 ml BD Pharm Lyse™ solution and washing with 2 ml PBS, we added 300 µl MACS buffer + 50 µl CountBright™ Absolute Counting Beads. Cell suspensions were then stored on ice till FACS analysis. For determination of thymocytes and spleen T cells, single-cell suspensions of about 1 million cells of each organ were first incubated on ice for 20 min with 1 µl/100 µl anti CD16/CD32. Then, cells were stained with fluorochrome-labeled antibodies (Supplementary Table 1) for 20 min. FACS analysis was performed by BD LSRFortessa™, cell sorting by BD FACSAria™ III flow cytometer using BD FACSDiva™ software. Thymocytes and lymphocytes were preselected by size and granularity (Supplementary Fig. 1). Thymocytes selection was then specified by anti-mouse CD90.2 or CD45 staining, (Supplementary Fig. 1A and 2), selection of T cells by CD45, CD3, CD4 and CD8 (Supplementary Fig. 1B). In brief, cell doublets were excluded by preselecting cells by size and granularity (Supplementary Fig. 1). Populations have been further sub divided by specific surface antigens (Supplementary Fig. 1C), which is described in detail in the Results section. For cell sorting thymocytes have been enriched for CD4+, CD8+, CD4+CD8+ (double positive, DP) and CD4−CD8− (double negative, DN) cells. Sorted populations were centrifuged and stored dry at −80° C. Apoptotic cells were detected by staining with annexin V-FITC and counterstained with propidium iodide (PI) to exclude necrotic cells. For absolute quantification, 50 µl CountBright™ Absolute Counting Beads (Life Technologies) were added.
TREC analysis
TREC analysis by real-time qPCR was either performed with whole blood DNA (Supplementary Fig. 3A) or with magnetic enriched T cell DNA (Supplementary Fig. 3B). For this purpose, erythrocytes were lysed at room temperature by 2 ml BD Pharm Lyse™ (Becton Dickinson)/100 µl blood. Following one washing step, cell pellet was resuspended in 100 µl MACS buffer and stored on ice. DNA extraction was either directly performed by QIAamp® DNA Micro Kit (QIAGEN) or T cells were enriched via Pan T Cell Isolation Kit (Miltenyi Biotec) prior to DNA extraction. Quantitative real-time PCR was performed as described in Supplementary Table 2 by CFX96 ™ real-time PCR detection system and iQ™ SYBR® Green Supermix (both Bio-Rad) using specific primers for the δRec Ψ Jα sjTREC sequence and for the Rag2 sequence as a genomic DNA standard. The following primers were used for quantification of TREC: TREC forward primer 5’ ATTGCCTTTGAACCAAGCTGAC 3’, TREC reverse primer 5’ TCCTGAGCATGGCAAGC AG 3’, Rag2 forward primer 5’ AGTCGAGGGAAAAGCATGGG 3’, Rag2 reverse primer 5’ ATGGGGTAGGCAGTCAGCTA 3’. TREC rate was calculated by normalization on a plasmid standard concentration series for both genes (Supplementary Fig. 3). TREC plasmid standard for C57BL/6NHsd mice has been synthesized using the In-Fusion® HD Cloning Kit (Clontech) based on plasmid standard for BALB/c mice by Sempowski et al. (14). With this setup the absolute rate of TREC+ T cells was determined by utilization of FACS data (Supplementary Fig. 3A). Plasmid sequences will be supplied on request. Calculation of TREC+ spleen T cells, which had been enriched like described above, was performed with single cell solution according to Supplementary Fig. 3A.
Quantitative real-time PCR for analysis of RNA expression
For real-time qPCR thymocytes were separated from thymus stroma cells by 40 µm cell strainer (see above). Total RNA from thymocytes or thymus stroma cells was extracted by peqGOLD RNAPureTM (peqlab) and converted to cDNA using Maxima First Strand cDNA Synthesis Kit (Thermo Scientific). As sample size was too low for qPCR analysis of cDNA derived from one mouse, samples of three mice were pooled for qPCR analysis. Quantitative real-time PCR was performed as described in Table 2 by CFX96 ™ real-time PCR detection system and iQ™ SYBR® Green Supermix (both Bio-Rad). Primer sequences are listed in Table 3.
RESULTS
Decrease of thymocyte count during CLP-initiated sepsis
Our first intention was to get a differentiated notion of thymocytes kinetics during CLP sepsis. Therefore we analyzed thymocyte states by FACS analyses after 24 h and 48 h following CLP operation. CLP treatment remarkably declined the thymocyte count (CD90.2+) after 24 h to 42 % (± 15 %) of sham (Fig. 1) and after 48 h to 7 % (± 3 %) of sham (for detailed data see Supplementary Tables 4 – 7). We next asked which thymocyte subpopulations based on surface expression of CD4 and CD8 from an immature to a mature state are affected. Selection was performed for double negative (CD4−CD8−, DN), double positive (CD4+CD8+, DP) and single positive thymocytes (SP, CD4+ or CD8+) (Fig. 2). Within the DN and DP populations we found a cell number reduction already 24 h after CLP (DN: 69 % (± 26 %) of sham; DP: 22 % (± 14 %) of sham). The cell count in these populations further dropped down 48 h after CLP (DN: 6 % (± 3 %) of sham); DP: 0.1 % (± 0.03 %) of sham). In contrast, a significant decrease of cell number within the SP thymocytes was only noticed 48 h after CLP (CD4+: 16 % (± 8 %) of sham; CD8+: 23 % (± 6 %) of sham). For a more detailed characterization of the altered thymocyte subpopulations, we subdivided the DN population by CD25 and CD44 expression (Fig. 3). This revealed a cell loss within the DN3 and DN4 states already 24 h following CLP (DN3: 59 % (± 36 %) of sham and 0.2 % (± 0.1 %) of sham after 48 h; DN4: 63 % (± 25 %) of sham and 4 % (± 2 %) sham after 48 h whereas a significant cell reduction within the DN1 and DN2 was observed only after 48 h (DN1: 19 % (± 7 %) of sham; DN2: 3 % (± 4 %) of sham). Separation of the DP population by its CD3 and CD69 surface expression (Fig. 4) (15–17) revealed predominantly a decrease of the immature DP thymocytes following CLP (CD3−CD69−: 19 % (± 0.01 %) of sham after 24 h and 13 % (± 0.005 %) of sham after 48 h; CD3−CD69+: 39 % (± 31 %) of sham after 24 h and 0.04 % (± 0.04 %) of sham after 48 h whereas the number of the more mature DP thymocytes was not altered significantly. Analyzing CD8+ SP thymocytes a CD45lowCD90high SP population attracted our attention. This population disappeared almost completely after 24 h (Fig. 5). Further characterization by CD3, CD24 and MHC-II expression revealed that these cells are immature single positive thymocytes, which are an intermediate state between DN and DP (Fig. 5B) cells. ISP thymocytes are CD3low and CD24+ (18, 19). As these cells were MHC-II negative we could clearly differentiate these thymocytes from dendritic cells. Already 24 h after CLP-treatment (Fig. 5C) the ISP thymocytes number declined to 14 % (± 9 %) of sham. At the 48 h time point there were less than 0.1 % (± 0.1 %) of sham conditions left.
Fig. 1: Effect of CLP-mediated sepsis on CD90.2+ thymocytes count.
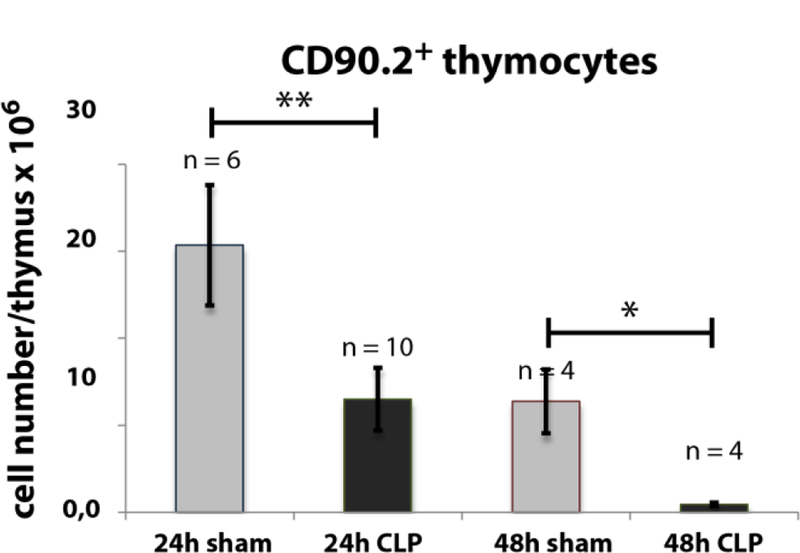
24 h and 48 h following CLP operation, thymi were isolated and single cell suspensions were generated as described in Materials and Methods. Cells were stained for CD90.2 and positive cells were determined by FACS analysis. Thymocytes gating was performed as described in Material and Methods (see also Supplementary Fig. 1A). Data are expressed as mean ± SD. n = number of animals. *, ** = p-value vs the sham group (* < 0.05, ** < 0.01).
Fig. 2: Effect of CLP-mediated sepsis on count of DN, DP and SP thymocytes.

A: 24 h and 48 h following CLP operation, thymi were isolated and single cell suspensions were generated as described in Materials and Methods. Cells were stained for CD90.2, CD4, and CD8. Based on CD90.2 positive thymocytes as described in Fig. 1A count of cells expressing only CD4 or CD8 (SP), expressing CD4 as well as CD8 (DP) or expressing neither CD4 nor CD8 (DN) were determined by FACS analyses. A representative result is shown. B - E: Quantification of FACS analyses as shown in A. Data are expressed as mean ± SD. n = number of animals. *, **, *** = p-value vs the sham group (* < 0.05, ** < 0.01, *** < 0.001).
Fig. 3: Effect of CLP-mediated sepsis on count of DN thymocytes subpopulations.
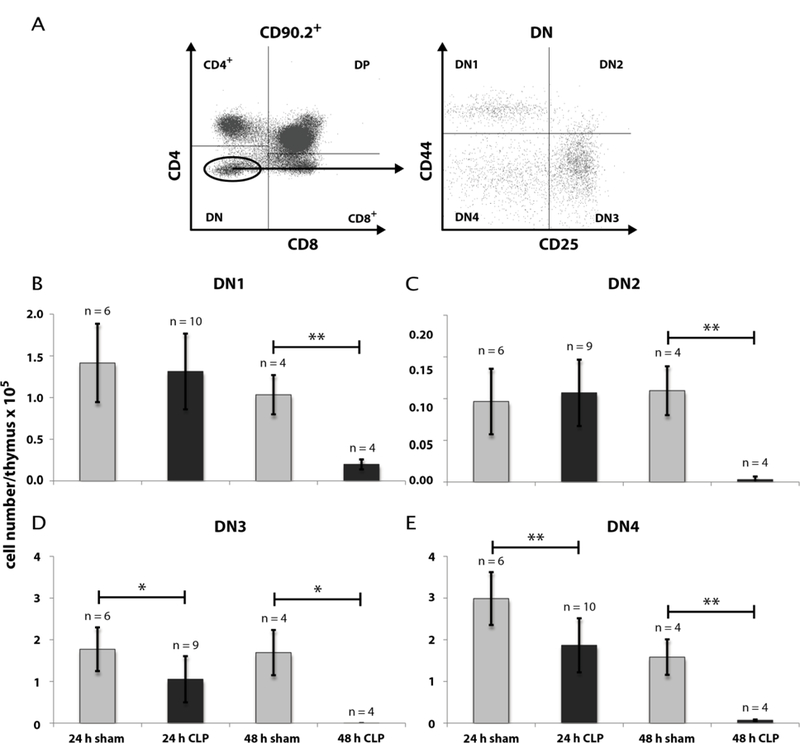
A: Further differentiation of DN thymocytes by CD25- and CD44-staining from immature to mature into DN1 (CD25−CD44+), DN2 (CD25+CD44+), DN3 (CD25+CD44−), DN4 (CD25−CD44−). 24 h and 48 h following CLP operation, thymi were isolated and single cell suspensions were generated as described in Materials and Methods. Gating of thymocytes DN for CD4 and CD8 expression was done as described in Fig. 1A and Fig. 2A. A representative picture is shown. B: Quantification of DN1 – DN4 thymocytes counts 24 h and 48 h after CLP- and sham-operation. Data are expressed as mean ± SD. n = number of animals. *, ** = p-value vs the sham group (* < 0.05, ** < 0.01,).
Fig. 4: Effect of CLP-mediated sepsis on count of DP thymocytes subpopulations.

A: Further differentiation of DP thymocytes was performed by CD3- and CD69-staining. 24 h and 48 h following CLP operation, thymi were isolated and single cell suspensions were generated as described in Materials and Methods. Gating of thymocytes DP for CD4 and CD8 expression was done as described in Fig. 1 and Fig. 2 with the modification that CD45 was taken as thymocyte marker instead of CD90.2 (see also Supplementary Fig. 2). A representative result is shown. B - D: Quantification of DP CD3−CD69−, DP CD3−CD69+ and DP CD3+CD69+ thymocytes as shown in A. Data are expressed as mean ± SD. n = number of animals. *, **= p-value vs the sham group (* < 0.05, ** < 0.01).
Fig. 5: Effect of CLP-mediated sepsis on count of CD8+ immature single positive (ISP) thymocytes.
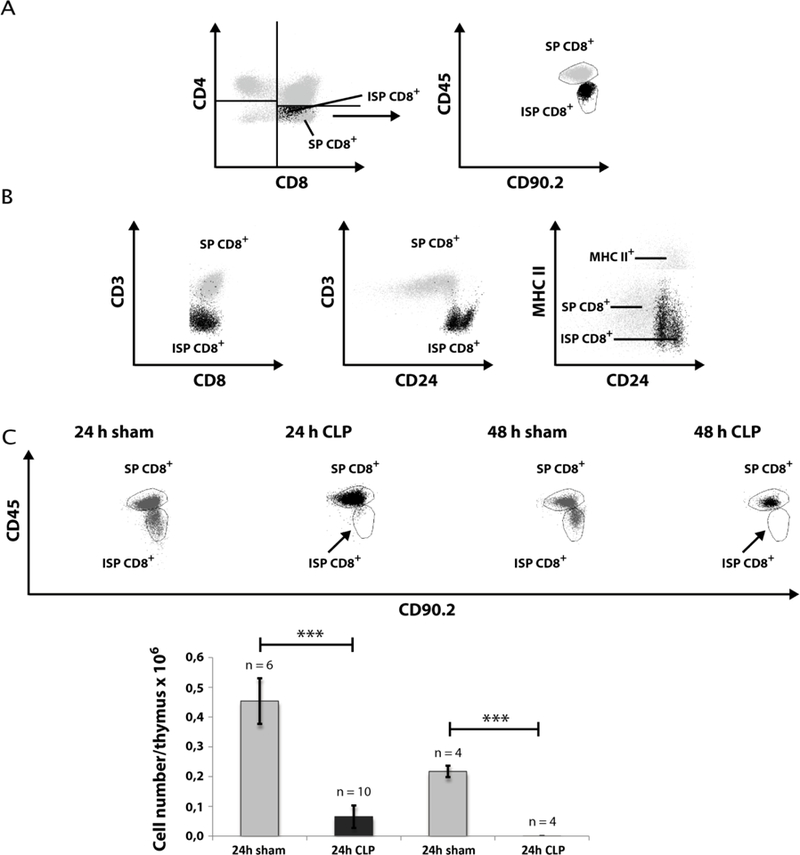
A. Differentiation of CD8+ ISP and CD8+ SP by staining for CD45 and CD90.2 expression. B. CD8+ ISP cells were further characterized by staining for CD3, CD24, and MHC-II expression. C. 24 h and 48 h following CLP operation, thymi were isolated and single cell suspensions were generated as described in Materials and Methods. Cells were stained for expression of CD45 and CD90.2. Thymocyte gating was performed as described in Fig. 1A and then as described in A. A representative dot blot is shown. A quantification of CD8+ ISP count is provided in the lower panel. Data are expressed as mean ± SD. n = number of animals. *** = p-value vs the sham group (*** < 0.001).
Apoptosis causes decline of ISP and DP thymocytes
Programmed cell death might be one explanation for the reduction of thymocyte subpopulations during CLP-mediated sepsis. Therefore, we analyzed apoptosis 24 h after CLP and sham operation. Cells were stained with annexin V-FITC and propidium iodide (PI) (Fig. 6). For analysis we took only regard to annexin V+PI− events as PI+ events could also include necrotic cells and cell fragments which can be false positive for apoptosis markers (Fig. 6A). Within thymocytes apoptosis was mainly observed in ISP and DP cells. Corresponding to the cell decline the highest rate of apoptotic cells was observed in the ISP cells (Fig. 6B). Here, the apoptotic rate of cells of 8.4 % (± 3.5 %) in the CLP group was about four times higher compared to the sham group (2.2 % ± 0.3 %). In the DP thymocytes apoptosis in the CLP group (2.5 % ± 1.2 %) was around 3 times higher as in the sham group (0.7 % ± 0.02 %). A slight significant increase in the number of apoptotic cells was as well observed in the CD4+ population following CLP (0.9 % ± 0.3 % apoptotic cells compared to 0.6 % ± 0.1 % in sham group). Interestingly, in contrast to the cell number the apoptotic rate in the DN population was not altered.
Fig. 6: Effect of CLP-mediated sepsis on thymocyte apoptosis.
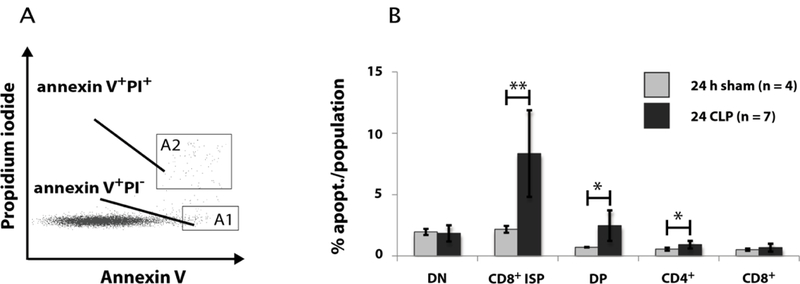
A: Gating of apoptotic thymoctes by propidium iodide (PI) and annexin V staining. For analysis only PI+ events (gate A2) were excluded, because these cells also include necrotic cells and cell fragments. B: Quantification of FACS analyses of apoptotic thymocytes (annexin V+PI−) 24 h and 48 h after CLP- and sham-operation. DN, DP and CD4+ thymocyte subpopulations were differentiated as described in Fig. 2A and then CD8+ ISP and CD8+ SP by CD3 and CD8 as shown in Fig. 5B. Data are expressed as mean ± SD. n = number of animals. *, **= p-value vs the sham group (* < 0.05, ** < 0.01).
No accumulation of mature CD69lowCD62Lhigh SP thymocytes
We further aimed to understand whether mature thymocytes are actively retained in the thymus. If this is the case, we would expect an accumulation of mature thymocytes after CLP-compared to the sham-treatment. SP thymocytes undergo phenotypic changes in their CD62L (L-selectin) and CD69 (activation antigen) surface expression from CD69highCD62Llow to CD69lowCD62Lhigh thymocytes (20). The latter ones represent the thymocytes, which are ready to leave the thymus. However, we did not find an accumulation of the CD69lowCD62Lhigh thymocytes after 24 h and 48 h following CLP-operation (Fig. 7).
Fig. 7: Effect of CLP-mediated sepsis on count of mature SP thymocytes.
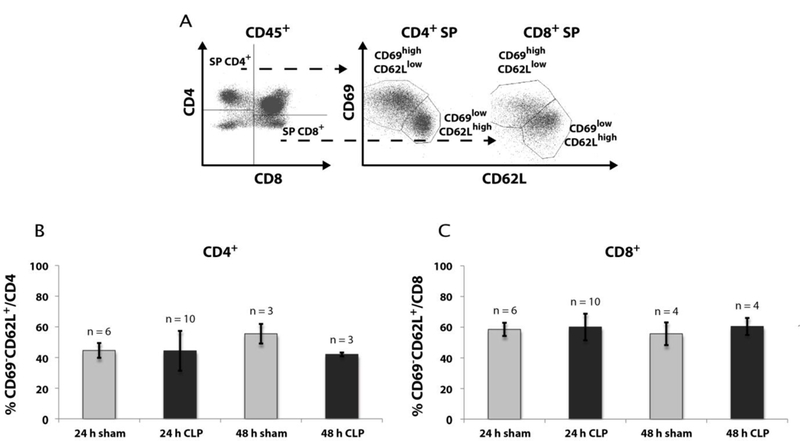
A. Mature SP thymocytes were identified by further staining for CD69 and CD62L expression (CD69lowCD62Lhigh). Gating of thymocytes was previously performed as described in Fig. 4A. B + C: Cell count of CD69lowCD62Lhigh CD4+ (B) and CD69lowCD62Lhigh CD8+ (C) thymocytes 24 h and 48 h after CLP- and sham-operation. Data are provided as mean ± SD. n = number of animals.
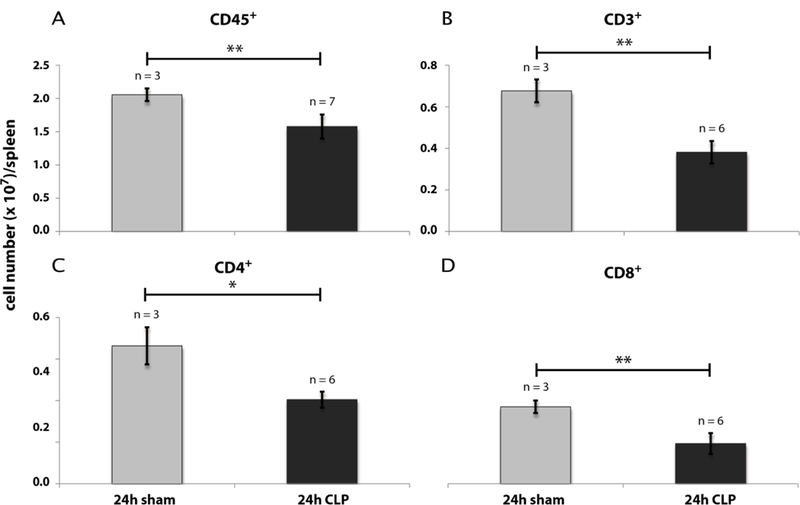
Decline of blood and spleen cells during CLP sepsis
For determination of thymocyte egress by the peripheral TREC+ rate we first quantified the number of leukocytes and lymphocytes in blood (Fig. 8) and spleen (Fig. 9). 24 h following CLP we observed a reduction of the CD45+ blood leukocytes (Fig. 8A) from 4.3 × 10⁶ (± 1.1 × 10⁶)/ml to 8.5 × 10⁵ (± 5.5 × 10⁵)/ml. The absolute leukocyte number in the CLP group remained constant till the 48 h time point. Similar to the count of total leukocytes there was a decrease of the CD3+ blood lymphocyte number from 5.1 × 10⁵ (± 1.9 × 10⁵)/ml to 1.9 × 10⁵ (± 1.1 × 10⁵)/ml blood 24 hours following CLP operation (Fig. 8B). 48 h after CLP the CD3+ number further dropped down to 6.5 × 10⁴ (± 2.1 × 10⁴)/ml blood. Within the CD3+ lymphocytes the ratio of CD4+ vs. CD8+ cells was not significantly altered between sham- and CLP-treated mice. Therefore, cell decrease within these T cell populations was homogeneous to those of CD3+ lymphocytes (Fig. 8C & D). Within spleen the cell loss after CLP was similar to blood T cells (Fig. 9).
Fig. 8: Effect of CLP-mediated sepsis on count of blood cells.

A – D: Cell count of CD45+ leukocytes, CD3+, CD4+, and CD8+ T cells 24 h and 48 h after CLP- and sham-operation. Gating was performed as described in Material and Methods (see also Supplementary Fig. 1B). Data are expressed as mean ± SD. n = number of animals. *, **, *** = p-value vs the sham group (* < 0.05, ** < 0.01, *** < 0.001).
Fig. 9: Effect of CLP-mediated sepsis on count of spleen cells.
A - D: Cell count of CD45+ leukocytes, CD3+, CD4+, and CD8+ lymphocytes 24 h and 48 h after CLP- and sham-operation. Gating was performed as described in Material and Methods (see also Supplementary Fig. 1B). Data are expressed as mean ± SD. n = number of animals. *, ** = p-value vs the sham group (* < 0.05, ** < 0.01).
Analysis of thymocyte egress by TREC+ T cells
A reduced thymocyte egress would affect the number of recent thymic emigrants (RTEs) in the thymic periphery. To validate this possibility, we quantified RTEs in blood and spleen by real-time qPCR for T cell receptor excision circles (TRECs) (Figs. 10 & 11; calculation see also Supplementary Fig. 3). TRECs are extrachromosomal recombination products of TCR recombination which cannot be duplicated and are hence diluted at each cell division. In contrast to peripheral lymphocytes, RTEs have not divided since leaving the thymus and therefore contain a significant higher rate of TRECs. Thus, TRECs can be used as markers for RTEs and consequently are applied to quantify RTEs in blood and tissues (21). In this study the TREC number was determined in blood and spleen following CLP and sham operation. Within the whole blood cells the absolute TREC+ T cell number declined from 1.1 × 10⁴ (± 4.4 × 10³)/ml to 3.2 × 10³ (± 1.8 × 10³)/ml 24 h after CLP. The count in the CLP group further dropped to 2.3 × 10³ (± 2.3 × 10²)/ml after 48 h (Fig. 10A). By contrast to the absolute number of TREC+ T cells the rate of TREC+ T cells per total T cells was higher in the CLP-compared to the sham-group (Fig. 10B). 48 h following CLP-treatment we calculated a TREC+ blood T cell count of 3.9 % (± 1.0 %). We repeated the 24 h experiment with the modification that T cells were enriched by MACS technology in order to directly calculate the rate of TREC+ T cells (Fig. 10C). As previously seen after 48 h we now observed a significant increase of the TREC+ T cells 24 h following CLP-treatment from 0.8 % (± 0.1 %) to 1.6 % (± 0.4 %). In spleen we found a reduction of the absolute TREC+ T cell number 6.0 × 10⁴ (± 1.6 × 10⁴)/ml to 2.7 × 10⁴ (± 3.7 × 10³)/ml, but the TREC+ rate remained unaltered (Fig. 11).
Fig. 10: Effect of CLP-mediated sepsis on TREC+ blood T cells.
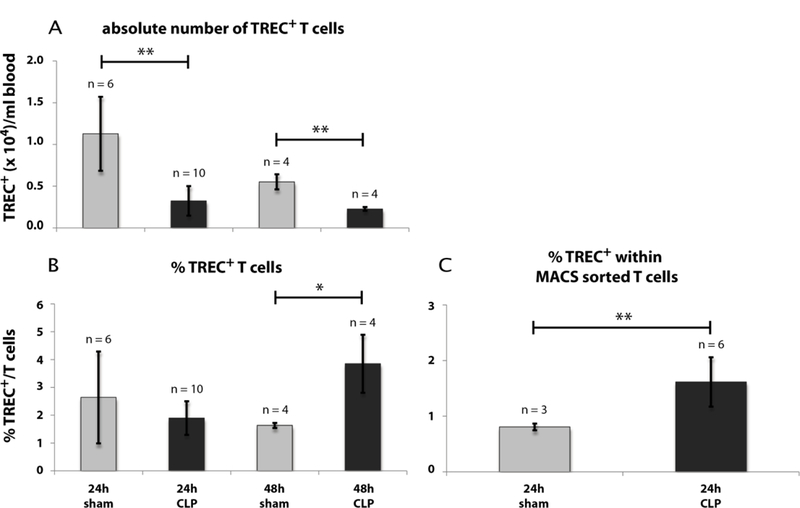
A: Cell count of absolute TREC+ blood T cell number 24 h and 48 h after CLP- and sham-operation. B: TREC+ blood T cell rate per CD3+ T cells 24 h and 48 h after CLP- and sham-operation. C: TREC+ blood T cell rate within MACS enriched blood T cells 24 h after CLP- and sham-operation. Calculation of TREC+ T cells has been performed by real-time qPCR out of whole blood or out of MACS purified T cells as described in Material and Methods (see also Supplementary Fig. 3). FACS gating of T cells for TREC calculation out of whole blood was performed as described in Fig. 8. Data are expressed as mean ± SD. n = number of animals. *, ** = p-value vs the sham group (* < 0.05, ** < 0.01).
Fig. 11: Effect of CLP-mediated sepsis on TREC+ spleen T cells.
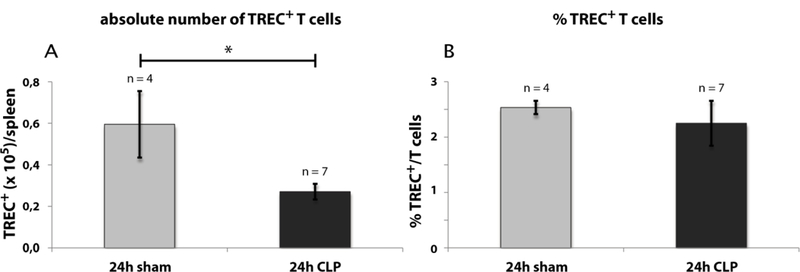
A: Cell count of absolute TREC+ spleen T cell number 24 h after CLP- and sham-operation. B: TREC+ spleen T cell rate 24 h after CLP- and sham-operation. Calculation of TREC+ T cells has been performed by real-time qPCR as described for whole blood (Supplementary Fig 3A) with the modification that TREC rate was related to sum of CD4+ and CD8+ instead of CD3 to eliminate false positive B cells. FACS gating of T cells for TREC calculation was performed as described in Fig. 9. Data are expressed as mean ± SD. n = number of animals. * = p-value vs the sham group (* < 0.05).
Notch signaling during CLP
We have shown that CLP leads particularly to a loss of ISP and DP thymocytes. As Notch signaling is essential for cell survival and differentiation of these early thymocyte states up to the DP state (13), we were interested to determine, if CLP-treatment influences expression of Notch signaling components. On this account mRNA expression of Notch1 and its downstream effectors Hes1 and PTEN in thymocytes as well as its ligands DL1 and DL4 expressed in thymus stroma cells were examined by real-time qPCR (Fig. 12). 24 hours after CLP the expression of both Notch1 ligands, DL1 and DL4, was lower compared to the sham group (DL1: 19 % sham, DL4: 64 % sham). By contrast the expression of Notch1 on thymocytes was higher in the CLP- than in the sham-operated group (1.250 % sham).
Fig. 12: Effect of CLP-mediated sepsis on Notch signaling.
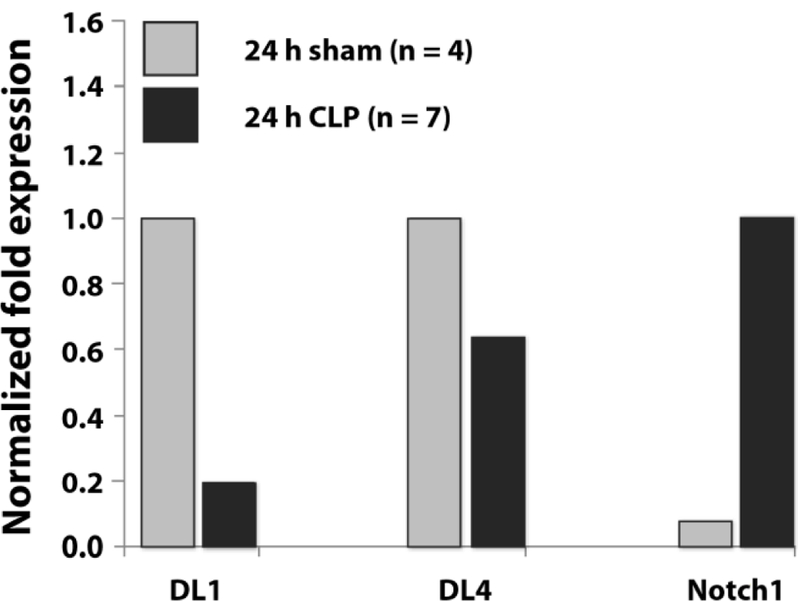
DL1 and DL4: mRNA expression of Notch1 ligands Delta like 1 and 4 on thymic epithelial cells (TEC) 24 hours after CLP-treatment. Notch1: expression of Notch1 on thymocytes 24 hours after CLP-treatment. Bars represent the normalized fold expression (ΔCT value) to 18s rRNA. As sample size was too low for PCR of each single mouse sample, cDNA of all mice was pooled for quantification. Therefore, data are expressed without mean and SD. 24 h sham and CLP: mice 24 h after sham resp. CLP operation. n = number of animals.
DISCUSSION
In this study we used the CLP sepsis model to analyze which thymocyte subsets contribute to thymus involution. Analyzing the two time points 24 h and 48 h, we found that sepsis is characterized by an early decrease (24 h) of thymocyte states between DN3 and the pre-selected DP thymocytes followed by a total thymocyte decrease at 48 h. We identified the ISP thymocytes to be mostly affected by cell loss, followed by DP thymocytes. Further characterization of DP thymocytes by CD3 and CD69 surface expression revealed that the more immature DP thymocyte states were more strikingly decreased. Apoptosis seems to play the major role. Within DN thymocytes the DN3 and DN4 but not the DN1 and DN2 state also showed an early cell count decrease after CLP-treatment. By contrast to ISP and DP thymocytes the reduction of DN thymocytes cannot be explained by programmed cell death. As DN3 and DN4 thymocytes are the most immature thymocytes in the early phase of cell decrease, these two populations might be one origin for the thymocyte reduction following CLP-dependent sepsis. This is in line with a recent manuscript of Kong et al (22). There, it was shown that a reduced homing of progenitor cells from the bone marrow contributes to thymus involution in septic mice what might explain the delayed decrease of DN1 and DN2 thymocytes count which we observed in our study after 48 h. Moreover, our observations confirm data of other sepsis models were also the early thymocytes states were reduced (8, 23). Dulude et al. (24) pointed out that there is a correlation of thymocyte exit to proliferation of DN4 thymocytes but not to other thymocyte states. So far all that data point to an early regulation of thymocyte development. Given the fact that clonal selection is a process which physiologically lasts about three weeks after thymic emigration (25, 26), early termination of thymocyte development might be useful to save resources. Possibly, thymic involution is accompanied by active inhibition of thymic output in order to prevent emigration of nonfunctional thymocytes. Analysis of mature SP thymocytes by CD69 and CD62L did not support this assumption, because there was no accumulation of mature thymocytes after CLP in the thymus. Treatment with FTY720, which inhibits lymphocyte egress from secondary lymphoid tissues and thymus by an agonistic activity towards sphingosine 1-phosphate receptors in contrast increased the rate of CD69lowCD62Lhigh SP thymocytes (see Supplementary data) (27). This observation contradicts an active inhibition of mature thymocyte release. To confirm our assumption, we further analyzed thymocyte egress by determining TREC copies. If active retention during sepsis is occurring, we expect a reduced level of RTEs, concomitantly with less TREC+ T cells in the thymus periphery. After CLP we observed a decline of the absolute leukocyte number and in particular of T cells in blood and spleen. TREC analysis revealed a reduction of the absolute TREC+ T cell number following CLP in blood and spleen, whereas the TREC+ T cell rate was elevated in blood but not in spleen. Presumably, the absolute decline in TREC+ number is due to a globally increased rate of T cell apoptosis (28). The elevated ratio of TREC+ blood T cells after CLP could be a result of persistent thymic output. This is supported by the unaltered count of CD69lowCD62Lhigh SP thymocytes. As RTEs exhibit a more anergic phenotype than mature T cells, it is likely that in these cells apoptosis is reduced, which would consequently raise the TREC+ rate (29, 30). Further on a reduced ability to migrate into secondary lymphatic organs could in turn raise the rate of TREC+ blood T cells and explain the unchanged rate of TREC+ T cells in spleen (31). In conclusion our TREC data contradict an active inhibition of mature thymocyte release. Future studies would be needed to elucidate the apoptosis susceptibility of different thymocyte subsets.
The decrease of DN thymocytes might also be explained by the involvement of Notch-dependent signaling. Recent studies have shown that Notch signaling between thymocytes and thymus epithelial cells is essential for early thymocyte survival and differentiation (19, 32, 33). Herein signals by the Notch1 ligands DL1 and DL4, whereas the last one seems to be the most prominent in thymus, are capable to promote thymocyte differentiation from the DN state to the DP state. Our qPCR data revealed a lower DL1 and DL4 expression on thymus matrix cells after CLP treatment. This could be due to a reduced Notch signaling by these cells. Xiong et al. have shown, that DN and ISP but not DP differentiation and expansion is Notch-dependent (19). Corresponding to our results they have described a differential reaction to Notch signals between DN and ISP thymocytes, as for example a higher rate of apoptotic cells within the ISP thymocytes. In contrast to our expectations we observed an elevated Notch1 mRNA expression in thymocytes after CLP. This might be explained by a compensatory upregulation of Notch1, when ligand signals are absent.
Taken together thymocyte regress during CLP sepsis is characterized by an early cell decline of the thymocyte states between DN3 and the less mature DP thymocytes. Our analysis of mature SP thymocytes and TREC analysis contradict an active inhibition of mature thymocyte emigration. Our data point to an early regulation of thymocyte development and release. Apoptosis seems to play an important role for ISP and DP thymocyte regress whereas the reason for DN thymocyte regress can’t be explained by apoptosis. Kong et al elucidated that other mechanisms like defective homing capacity of progenitor cells and altered linage development in favor myelopoiesis over lymphopoiesis contribute to thymocyte decrease during sepsis mediated thymic involution. As it has been shown that Notch signaling is important for DN/DP transition our qPCR analysis of Notch expression on thymocytes and its ligands on thymic stromal cells might indicate an additional mechanism for thymocyte decrease.
Supplementary Material
Acknowledgments
Support:
This research was supported by grants from the Deutsche Forschungsgemeinschaft (KN493/9–2, /11–1 and SFB815 TP3). The work was supported by the Else Kröner-Fresenius Foundation (EKFS), Research Training Group Translational Research Innovation-Pharma (TRIP) and the Landesoffensive zur Entwicklung wissenschaftlich-ökonomischer Exzellenz (LOEWE), Schwerpunkt Anwendungsorientierte Arzneimittel-forschung.
Footnotes
Disclosure: The authors have no conflicts of interest to disclose.
REFERENCES
- 1.Carpenter AC, Bosselut R: Decision checkpoints in the thymus. Nat Immunol 11(8):666–673, 2010. [DOI] [PMC free article] [PubMed] [Google Scholar]
- 2.Shah DK, Zúñiga-Pflücker JC: An overview of the intrathymic intricacies of T cell development. J Immunol 192(9):4017–4023, 2014. [DOI] [PubMed] [Google Scholar]
- 3.Manley NR: Thymus organogenesis and molecular mechanisms of thymic epithelial cell differentiation. Semin Immunol 12(5):421–428, 2000. [DOI] [PubMed] [Google Scholar]
- 4.Spits H: Development of alphabeta T cells in the human thymus. Nat Rev Immunol 2(10):760–772, 2002. [DOI] [PubMed] [Google Scholar]
- 5.Xiao SY, Li Y, Chen WF: Kinetics of thymocyte developmental process in fetal and neonatal mice. Cell Res 13(4):265–273, 2003. [DOI] [PubMed] [Google Scholar]
- 6.Fink PJ: The Biology of Recent Thymic Emigrants. Ann Rev Immunol 31(1):31–50, 2013. [DOI] [PubMed] [Google Scholar]
- 7.Gruver AL, Sempowski GD: Cytokines, leptin, and stress-induced thymic atrophy. J leukoc Biol 84(4):915–923, 2008. [DOI] [PMC free article] [PubMed] [Google Scholar]
- 8.Wang SD, Huang KJ, Lin YS, Lei HY: Sepsis-induced apoptosis of the thymocytes in mice. J Immunol 152(10):5014–5021, 1994. [PubMed] [Google Scholar]
- 9.Ayala A, Herdon CD, Lehman DL, DeMaso CM, Ayala CA, Chaudry IH: The induction of accelerated thymic programmed cell death during polymicrobial sepsis: control by corticosteroids but not tumor necrosis factor. Shock 3(4):259–267, 1995. [DOI] [PubMed] [Google Scholar]
- 10.Ayala A, Lomas JL, Grutkoski PS, Chung S: Fas-ligand mediated apoptosis in severe sepsis and shock. Scand J Infect Dis 35(9):593–600, 2003. [DOI] [PubMed] [Google Scholar]
- 11.Hiramatsu M, Hotchkiss RS, Karl IE, Buchman TG: Cecal ligation and puncture (CLP) induces apoptosis in thymus, spleen, lung, and gut by an endotoxin and TNF-independent pathway. Shock 7(4):247–253, 1997. [DOI] [PubMed] [Google Scholar]
- 12.Ozment TR, Ha T, Breuel KF, Ford TR, Ferguson DA, Kalbfleisch J, Schweitzer JB, Kelley JL, Li C, Williams DL: Scavenger receptor class a plays a central role in mediating mortality and the development of the pro-inflammatory phenotype in polymicrobial sepsis. PLoS Path 8(10):e1002967, 2012. [DOI] [PMC free article] [PubMed] [Google Scholar]
- 13.Wichterman KA, Baue AE, Chaudry IH: Sepsis and septic shock--a review of laboratory models and a proposal. J Surg Res 29(2):189–201, 1980. [DOI] [PubMed] [Google Scholar]
- 14.Sempowski GD, Gooding ME, Liao HX, Le PT, Haynes BF: T cell receptor excision circle assessment of thymopoiesis in aging mice. MolImmunol 38(11):841–848, 2002. [DOI] [PubMed] [Google Scholar]
- 15.Jung LK, Haynes BF, Nakamura S, Pahwa S, Fu SM: Expression of early activation antigen (CD69) during human thymic development. Clin Exp Immunol 81(3):466–474, 1990. [DOI] [PMC free article] [PubMed] [Google Scholar]
- 16.Testi R, Phillips JH, Lanier LL: Constitutive expression of a phosphorylated activation antigen (Leu 23) by CD3bright human thymocytes. J Immunol 141(8):2557–2563, 1988. [PubMed] [Google Scholar]
- 17.Vanhecke D, Leclercq G, Plum J, Vandekerckhove B: Characterization of distinct stages during the differentiation of human CD69+CD3+ thymocytes and identification of thymic emigrants. J Immunol 155(4):1862–1872, 1995. [PubMed] [Google Scholar]
- 18.Shortman K, Wilson A, Egerton M, Pearse M, Scollay R: Immature CD4- CD8+ murine thymocytes. Cell Immunol 113(2):462–479, 1988. [DOI] [PubMed] [Google Scholar]
- 19.Xiong J, Armato MA, Yankee TM: Immature single-positive CD8+ thymocytes represent the transition from Notch-dependent to Notch-independent T-cell development. Int Immunol 23(1):55–64, 2011. [DOI] [PMC free article] [PubMed] [Google Scholar]
- 20.Rosen H, Alfonso C, Surh CD, McHeyzer-Williams MG: Rapid induction of medullary thymocyte phenotypic maturation and egress inhibition by nanomolar sphingosine 1-phosphate receptor agonist. Proc Natl Acad Sci U S A 100(19):10907–10912, 2003. [DOI] [PMC free article] [PubMed] [Google Scholar]
- 21.Hazenberg MD, Verschuren MC, Hamann D, Miedema F, van Dongen JJ: T cell receptor excision circles as markers for recent thymic emigrants: basic aspects, technical approach, and guidelines for interpretation. J Mol Med 79(11):631–640, 2001. [DOI] [PubMed] [Google Scholar]
- 22.Kong Y, Li Y, Zhang W, Yuan S, Winkler R, Krohnert U, Han J, Lin T, Zhou Y, Miao P, Wang B, Zhang J, Yu Z, Zhang Y, Kosan C, Zeng H: Sepsis-Induced Thymic Atrophy is Associated with Defects in Early Lymphopoiesis. Stem Cells, 2016. July 16 10.1002/stem.2464. [DOI] [PubMed]
- 23.Billard MJ, Gruver AL, Sempowski GD: Acute endotoxin-induced thymic atrophy is characterized by intrathymic inflammatory and wound healing responses. PloS One 6(3):e17940, 2011. [DOI] [PMC free article] [PubMed] [Google Scholar]
- 24.Dulude G, Cheynier R, Gauchat D, Abdallah A, Kettaf N, Sékaly R-P, Gratton S: The magnitude of thymic output is genetically determined through controlled intrathymic precursor T cell proliferation. J Immunol 181(11):7818–7824, 2008. [DOI] [PubMed] [Google Scholar]
- 25.Berzins SP, Boyd RL, Miller JF: The role of the thymus and recent thymic migrants in the maintenance of the adult peripheral lymphocyte pool. The Journal of experimental medicine 187(11):1839–1848, 1998. [DOI] [PMC free article] [PubMed] [Google Scholar]
- 26.Berzins SP, Godfrey DI, Miller JF, Boyd RL: A central role for thymic emigrants in peripheral T cell homeostasis. Proc Natl Acad Sci U S A 96(17):9787–9791, 1999. [DOI] [PMC free article] [PubMed] [Google Scholar]
- 27.Chiba K: FTY720, a new class of immunomodulator, inhibits lymphocyte egress from secondary lymphoid tissues and thymus by agonistic activity at sphingosine 1-phosphate receptors. Pharmacol Ther 108(3):308–319, 2005. [DOI] [PubMed] [Google Scholar]
- 28.Hotchkiss RS, Tinsley KW, Swanson PE, Schmieg RE, Hui JJ, Chang KC, Osborne DF, Freeman BD, Cobb JP, Buchman TG, Karl IE: Sepsis-induced apoptosis causes progressive profound depletion of B and CD4+ T lymphocytes in humans. J Immunol 166(11):6952–6963, 2001. [DOI] [PubMed] [Google Scholar]
- 29.Lee CK, Kim K, Welniak LA, Murphy WJ, Muegge K, Durum SK: Thymic emigrants isolated by a new method possess unique phenotypic and functional properties. Blood 97(5):1360–1369, 2001. [DOI] [PubMed] [Google Scholar]
- 30.Piguet PF, Irle C, Kollatte E, Vassalli P: Post-thymic T lymphocyte maturation during ontogenesis. J Exp Med 154(3):581–593, 1981. [DOI] [PMC free article] [PubMed] [Google Scholar]
- 31.Houston EG, Higdon LE, Fink PJ: Recent thymic emigrants are preferentially incorporated only into the depleted T-cell pool. Proc Natl Acad Sci u S A 108(13):5366–5371, 2011. [DOI] [PMC free article] [PubMed] [Google Scholar]
- 32.Wong GW, Knowles GC, Mak TW, Ferrando AA, Zúñiga-Pflücker JC: HES1 opposes a PTEN-dependent check on survival, differentiation, and proliferation of TCRβ-selected mouse thymocytes. Blood 120(7):1439–1448, 2012. [DOI] [PMC free article] [PubMed] [Google Scholar]
- 33.Wong WF, Nakazato M, Watanabe T, Kohu K, Ogata T, Yoshida N, Sotomaru Y, Ito M, Araki K, Telfer J, Fukumoto M, Suzuki D, Sato T, Hozumi K, Habu S, Satake M: Over-expression of Runx1 transcription factor impairs the development of thymocytes from the double-negative to double-positive stages. Immunol 130(2):243–253, 2010. [DOI] [PMC free article] [PubMed] [Google Scholar]
Associated Data
This section collects any data citations, data availability statements, or supplementary materials included in this article.