Abstract
The ability to regenerate missing body parts exists throughout the animal kingdom. Positional information is critical for regeneration, but how it is harbored and utilized by differentiated tissues is poorly understood. In planarians, positional information has been identified through RNA interference (RNAi) phenotypes in which the wrong tissues are regenerated. For example, Wnt pathway inhibition leads to regeneration of heads in place of tails1–3. Characterization of such striking adult phenotypes led to identification of genes expressed in a constitutive and regional manner, associated with patterning, called position control genes (PCGs). Most PCGs are expressed within the planarian muscle4. Despite this major positional information role for muscle in planarians, how muscle is specified and how different muscle subsets impact regeneration is unknown. Here we found distinct regulatory roles for different planarian muscle fibers during regeneration. myoD was required for formation of a specific muscle cell subset: the longitudinal fibers, oriented along the anterior-posterior (AP) axis. Loss of longitudinal fibers led to a complete regeneration failure because of defects in regeneration initiation. A different transcription factor (TF)-encoding gene, nkx1-1, was required for formation of circular fibers, oriented along the medial-lateral (ML) axis. Loss of circular fibers led to a bifurcated AP axis with fused heads forming in single anterior blastemas. Our results demonstrate distinct roles for muscle fiber types in orchestrating planarian regeneration. Whereas muscle is often viewed as a strictly contractile tissue, these findings reveal specific regulatory roles for distinct muscle classes in wound signaling and patterning to enable regeneration.
Body wall muscle (BWM) in the planarian Schmidtea mediterranea consists of multiple fibers with different orientations (Fig. 1a; SI video 1). The outermost circular BWM layer runs along the ML axis, underneath the subepidermal membrane. Below, there is a diagonal and thin longitudinal muscle fiber network, and an innermost layer comprised of thick longitudinal fibers running along the AP axis (SI video 1; 5,6).
Fig. 1. myoD specifies longitudinal muscle fibers.
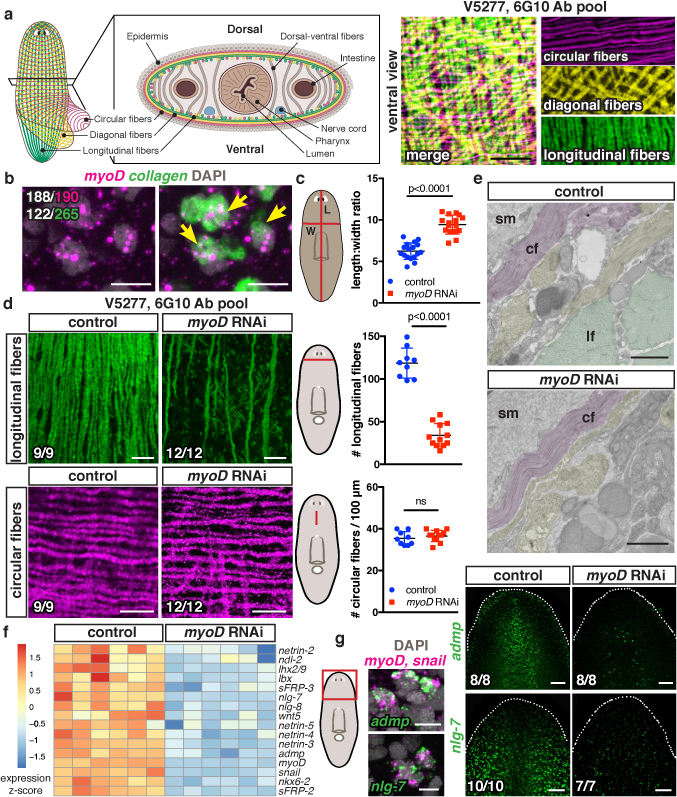
a, Cartoon and IF: BWM layers (5 animals, 2 experiments). b, myoD and BWM collagen+ cells (5 animals, 2 experiments). White, double-positive cells from one animal. c, Length-to-width ratio (17 control, 16 myoD(RNAi) animals, 3 experiments). d, Longitudinal-fiber loss in myoD(RNAi) by IF (3 experiments). e, Longitudinal-fiber reduction in myoD(RNAi) by TEM (3 animals). Pseudocolored circular (cf), longitudinal (lf), or other fibers (yellow); sm, subepidermal membrane. f, Heatmap: TF and PCG expression after myoD RNAi (6 replicates, 1 animal/replicate). g, myoD/snail and PCG co-expression and PCG expression loss following myoD RNAi (2 experiments). Cartoon line, measurement site. Animals uninjured, 10 dsRNA feedings. Two-tailed Student-t test, mean ± SD, ns: not significant (c,d). Bottom left number: animals with phenotype/total tested. Bars: 10μm (a,b,d,g left); 1μm (e); 100μm (g right).
MyoD, a basic helix-loop-helix TF, has conserved roles in myogenesis7, acting in vertebrates with Myf5 and Mrf4 to generate skeletal muscle8. In C. elegans, the myoD homolog, hlh-1, synergizes with unc-120 and hnd-1 to orchestrate body wall myogenesis9. In Drosophila, by contrast, the myoD homolog nautilus is required for differentiation of a limited number of muscles10. Using fluorescent in situ hybridization (FISH), we found that planarian myoD was primarily expressed in collagen+ BWM cells (Fig. 1b); a minor myoD+ cell fraction co-expressed the neoblast (proliferating cell) marker smedwi-1 (Extended Data Fig. 1a). Interestingly, only 46% of BWM expressed myoD, raising the possibilities that myoD expression is specific to a muscle cell subset or to a transient differentiation stage.
myoD RNAi caused animals to become longer and thinner (Fig. 1c; Extended Data Fig. 1b). BWM cells (collagen+) were substantially decreased in uninjured myoD(RNAi) animals, whereas intestinal muscle was unperturbed (Extended Data Fig. 1c). Immunostainings of myoD(RNAi) animals revealed a dramatic loss of only a subset of BWM: longitudinal fibers (Fig. 1d; SI video 2). Circular and diagonal fibers remained normal, whereas thin and thick longitudinal fibers were reduced (Fig. 1d; Extended Data Fig. 1d). Electron microscopy confirmed this longitudinal fiber-specific phenotype (Fig. 1e).
RNA-sequencing in uninjured myoD(RNAi) animals showed muscle-specific gene expression reduction (Extended Data Fig. 1e,f; SI Table 1). Other conserved TF-encoding genes, snail, ladybird (lbx), nkx6–2, and lhx2/9, also displayed decreased expression (Fig. 1f; Extended Data Fig. 1g; SI Table 1). These genes were expressed in BWM, and at least partially, with myoD (Extended Data Fig. 2a–e). snail, lbx, and nkx6–2 RNAi did not cause major muscle phenotypes (Extended Data Fig. 2f), but these TFs might still regulate longitudinal fiber biology. A subset of PCGs were co-expressed with myoD+ and significantly reduced in myoD(RNAi) animals (Fig. 1f,g; Extended Data Fig. 3 and Table 1; SI Table 1), indicating that some patterning genes are predominantly expressed in longitudinal muscle fibers.
We utilized myoD RNAi to examine the role of longitudinal fibers in regeneration. Previous studies showed a range of regeneration defects in myoD(RNAi) animals, such as pointed blastemas (regenerative outgrowths) for unknown reasons11,12. We optimized a myoD RNAi protocol that resulted in an essentially complete block of regeneration following amputation (Fig. 2a). Animals contracted wounds (Extended Data Fig. 4a) but failed to regenerate anterior (notum+) or posterior (wnt1+) poles (Extended Data Fig. 4b,c), which are essential for blastema patterning13–15.
Fig. 2. myoD is required for regeneration initiation.
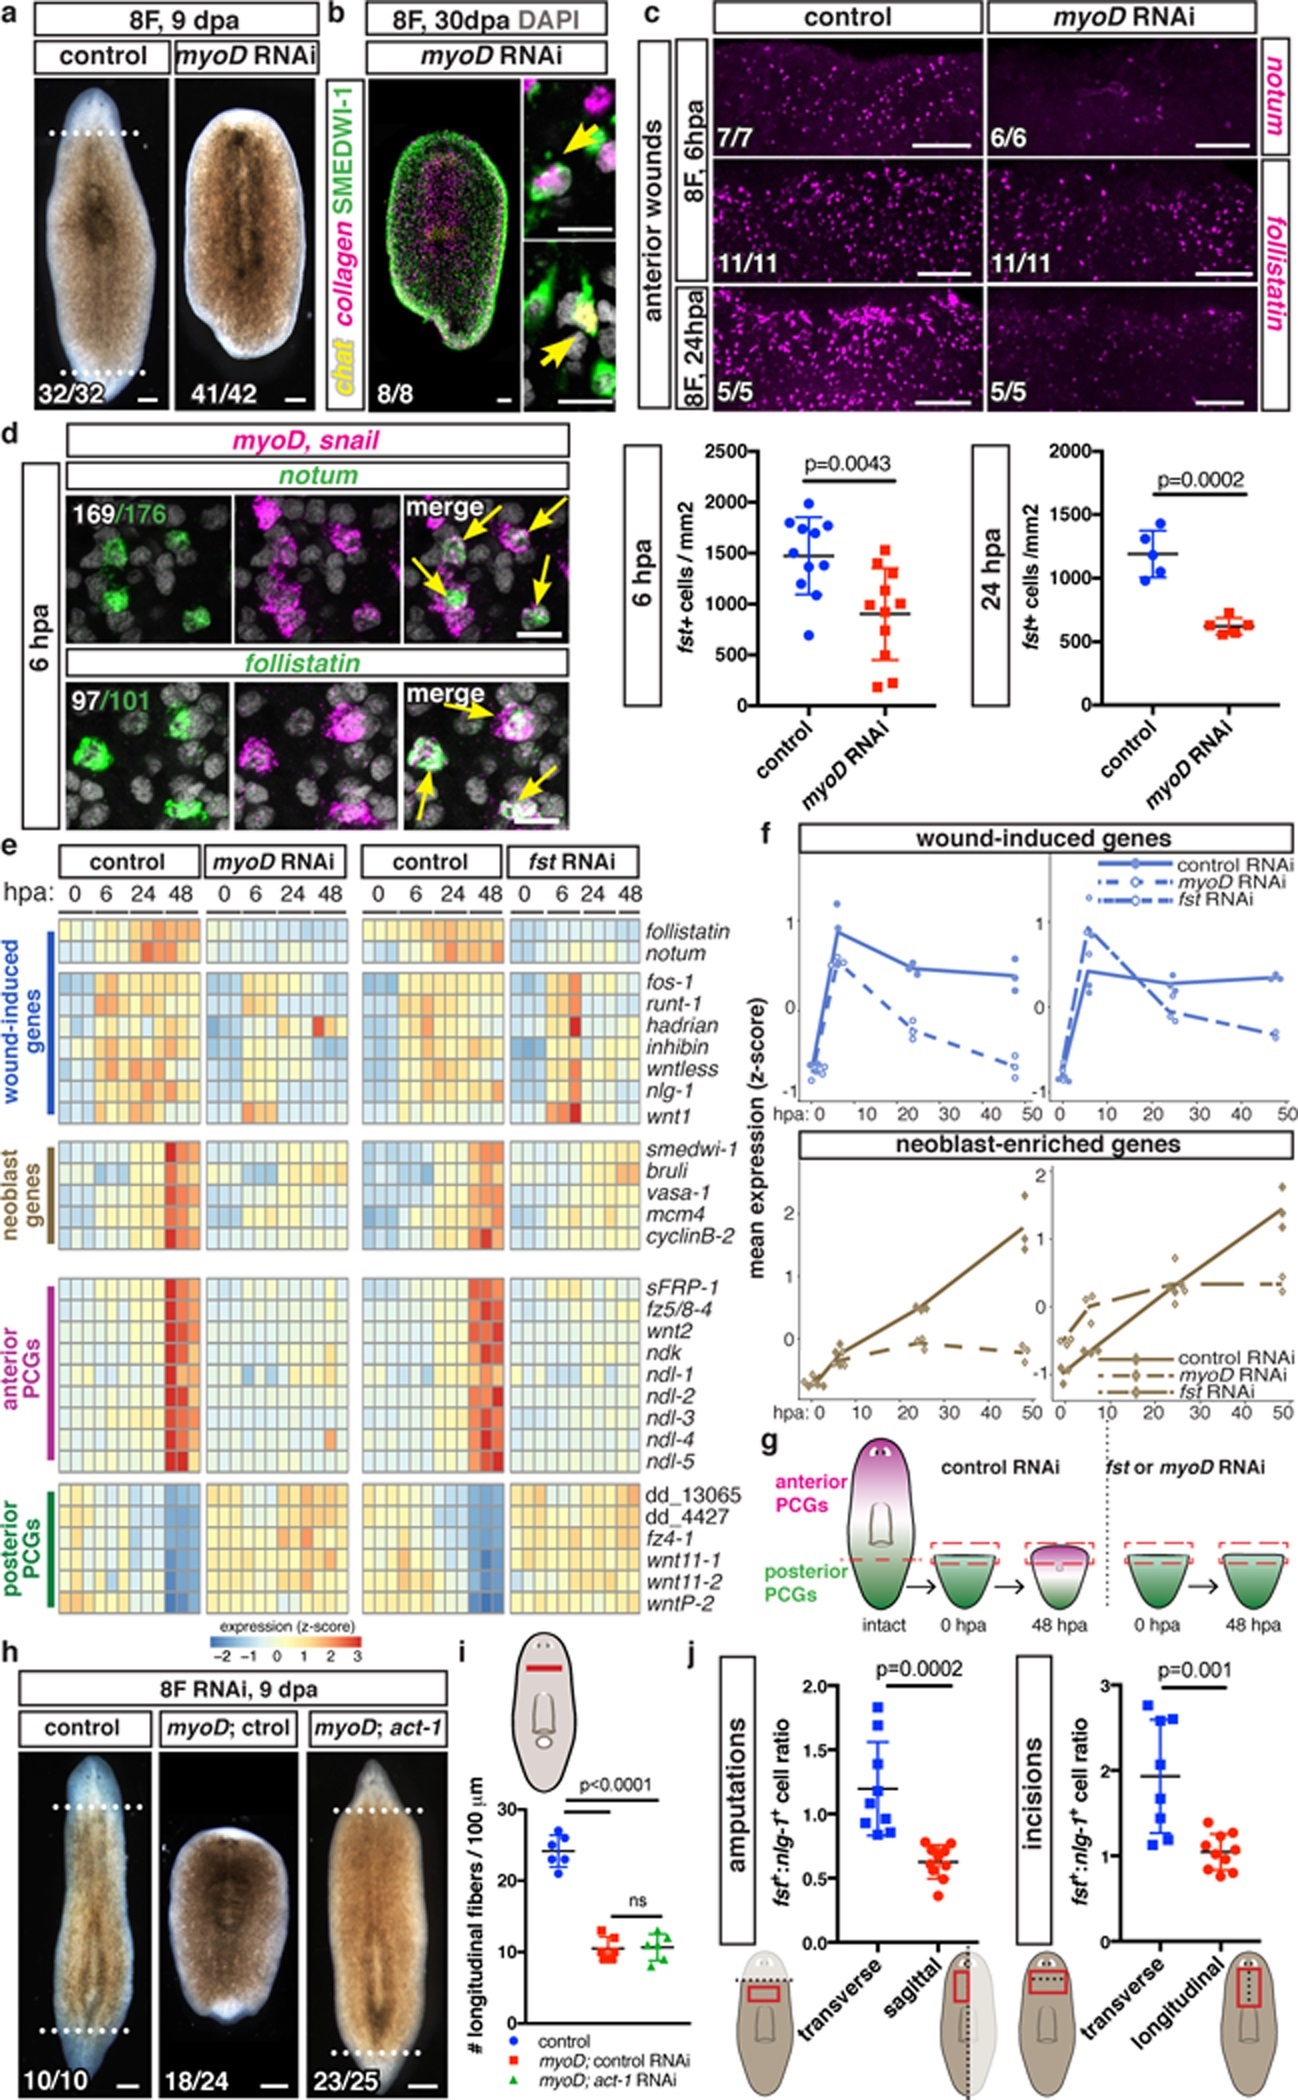
a, No regeneration after myoD RNAi (4 experiments). b, New neurons (ChAT+) and muscle (collagen+) in non-regenerative myoD(RNAi) fragments (2 experiments). c, Reduced notum and follistatin expression in myoD(RNAi) animals (2 experiments). d, myoD/snail+ and notum+ or follistatin+ (fst) cells at anterior-facing wounds (5 animals/FISH, 2 experiments, white: double-positive cells from one animal). e, mRNA-seq data heatmap (3 replicates/timepoint, 5 animal-wounds/replicate). f, Mean expression z-score from e of all wound-induced and neoblast genes17. g, Cartoon: positional information regeneration. h, activin-1 inhibition suppressed myoD(RNAi) regeneration failure (3 experiments). i, Longitudinal-fiber quantification, (6 animals/group, 2 experiments). One-way ANOVA, post Dunnett’s test. j, Higher follistatin+ to nlg-1+ cell ratio in transverse (n=9 and 8) versus sagittal (n=10) amputations and incisions at 6hpa. Dotted line, injury/amputation site; red outline, measurement site. Two-tailed Student-t test (c,j), all mean ± SD. Bottom left number: animals with phenotype/total tested. Bars: 100μm (a,b left,c,h); 10μm (b right,d).
Planarian regeneration and tissue turnover require neoblasts, a proliferating cell population containing pluripotent stem cells. Accordingly, numerous regeneration-abnormal phenotypes are explained by neoblast defects. Regeneration failure in myoD(RNAi) animals, however, was not caused by general neoblast dysfunction. Neoblasts differentiated into neurons (ChAT+) and muscle (collagen+) in myoD(RNAi) fragments that failed to regenerate 30 days post-head and tail amputation (Fig. 2b); however, neoblasts in these headless fragments did not generate eye progenitors (Extended Data Fig. 4d). Moreover, myoD(RNAi) animals regenerated eyes following eye resection (Extended Data Fig. 4e), a small injury that does not elicit sustained neoblast proliferation or require restoration of missing positional information for repair, but still requires neoblast differentiation16. In conclusion, myoD(RNAi) animals are fully capable of generating new tissues during tissue turnover and small injury repair, but completely fail to regenerate missing tissues following amputation.
Regeneration in planarians follows several phases. There is an initial “wound response”, occurring at essentially all injuries, associated with rapid wound-induced gene expression (3–12h post-wounding)17,18. Subsequently, and only with injuries removing substantial tissue, additional events occur that collectively comprise the “regenerative response” (~24–48h post-amputation, hpa). These events include persistent wound-induced gene expression, patterning gene expression domain regeneration in muscle, sustained neoblast proliferation and accumulation at wounds, and body-wide elevated apoptosis17–20. Soon after these changes, new differentiated cell types emerge (~72hpa) and blastema growth and patterning ensues. Because of the striking regeneration failure in myoD(RNAi) animals, we reasoned some aspect of these early regeneration steps likely requires myoD and/or longitudinal muscle fibers.
Many planarian wound-induced genes are expressed in the epidermis, neoblasts, or muscle17,18. myoD was not required for epidermis, neoblast, or most muscle wound-induced (6hpa) gene expression (wntless, inhibin, wnt1, and nlg-1) (Extended Data Fig. 4f). However, a marked reduction in muscle wound-induced expression of notum and follistatin was observed in myoD(RNAi) animals at multiple timepoints post-amputation and concomitantly with longitudinal-fiber loss (Fig. 2c; Extended Data Fig. 4g). Furthermore, wound-induced follistatin and notum expression was greatly enriched in myoD+ cells (Fig. 2d) compared to other muscle wound-induced genes (Extended Data Fig. 5a). These data indicate that notum and follistatin are unique among wound-induced genes in that they are restricted to longitudinal fibers.
The effect of myoD RNAi on follistatin and notum was particularly revealing, because these genes have critical regeneration roles. notum encodes a Wnt-inhibitory deacylase21,22 and controls the planarian head-versus-tail decision following amputation. notum is preferentially expressed at anterior over posterior-facing wounds17,23. follistatin encodes a TGF-beta inhibitor required for sustained wound-induced gene expression and elevated neoblast proliferation during the regenerative response24. follistatin RNAi24,25, like myoD RNAi, resulted in regeneration failure but allowed tissue turnover.
To further assess similarities between the myoD and follistatin RNAi phenotypes, we performed RNA-sequencing on anterior-facing wounds during the wound and regenerative regeneration responses (SI Table 1). Although most wound-induced genes were expressed normally following myoD and follistatin RNAi at 6hpa, most showed a significant drop in expression in both conditions at later timepoints (24–48hpa, regenerative response) (Fig. 2e,f; Extended Data Fig. 5b). Sustained neoblast proliferation and accumulation at wounds (~48hpa), detected as increased neoblast signature transcripts at wounds, was lacking in both myoD and follistatin RNAi animals (Fig. 2e,f; Extended Data Fig. 5c).
We next assessed positional information regeneration in myoD(RNAi) animals. Initially following amputation, tail fragments only express posterior PCGs. By 48hpa, posterior PCG expression restricts posteriorly and anterior PCG expression initiates, to reconstitute normal PCG expression domains. PCG expression domain regeneration in muscle did not occur in myoD and follistatin RNAi animals (Fig. 2e–g; Extended Data Fig. 6a; 26). Taken together, we conclude that myoD and longitudinal muscle fibers are required for the regenerative response.
Follistatin negatively regulates Activins (TGF-beta signaling ligands) and activin inhibition suppressed the follistatin(RNAi) regeneration defect24,25. To test whether failed follistatin expression is responsible for regeneration failure in myoD(RNAi) animals, we inhibited both myoD and activin-1. After short-term RNAi of both myoD and activin-1, animals regenerated (23/25, with 9/23 being cyclopic, versus 6/24 for myoD; control animals, Fig. 2h). Regeneration included PCG expression re-scaling and anterior pole generation (Extended Data Fig. 6b). Reduced longitudinal fiber numbers and snail expression (a myoD target) were comparable in double myoD; activin-1(RNAi) and myoD; control(RNAi) animals (Fig. 2i; Extended Data Fig. 6c). Following long-term myoD RNAi, activin-1 inhibition did not rescue regeneration (Extended Data Fig. 6d), suggesting some longitudinal muscle fibers are required for blastema formation. β-catenin-1 RNAi causes ectopic head regeneration at wounds, but did not restore head regeneration following myoD RNAi (Extended Data Fig. 6e). The activin-1 suppression data demonstrate that failed regeneration in myoD(RNAi) animals is not simply explained by muscle contractility dysfunction, but instead by a regulatory role of longitudinal muscle fibers at wounds.
Because follistatin wound-induced expression was longitudinal fiber-specific, transverse wounds might elicit more follistatin expression than sagittal wounds. Indeed, this occurred for follistatin, but not for other non-longitudinal fiber-specific wound-induced genes (Fig. 2j; Extended Data Fig. 7a,b). Moreover, sagittally amputated myoD(RNAi) animals showed variable regeneration defects (Extended Data Fig. 7c).
The results described above demonstrate an essential and specific regeneration role for a particular muscle fiber class. This raises the question of how other muscle fibers are specified, and whether they have other regeneration roles. Mining previously reported single-muscle-cell RNA-seq data27, we identified a muscle-expressed gene encoding an NK1 homeodomain TF (nkx1-1) homologous to Drosophila Slouch (Extended Data Fig. 1g). Like nautilus, slouch is required for the formation of another subset of Drosophila muscles28. Like myoD, nkx1-1 was predominantly expressed in collagen+ BWM cells, with a minor fraction expressed in neoblasts (Fig. 3a; Extended Data Fig. 8a,b). nkx1-1 was expressed in a subset of BWM cells (43%), distinct from myoD+ cells (Fig. 3a; Extended Data Fig. 2e), suggesting roles for these genes in different muscle cell subsets.
Fig. 3. nkx1-1 specifies circular muscle fibers and is required for medial-lateral patterning.
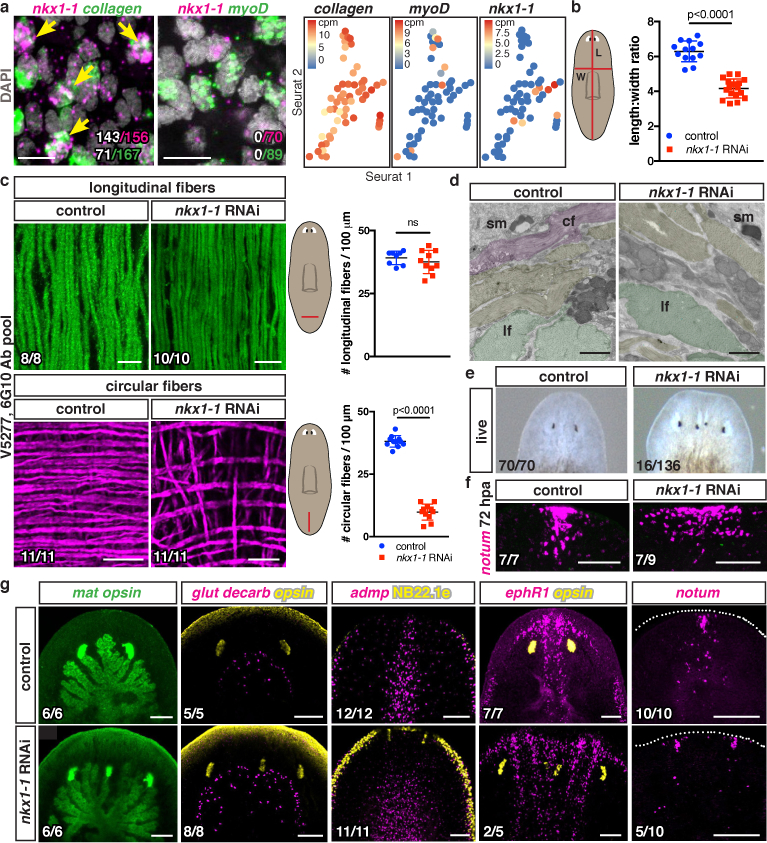
a, nkx1-1+ and BWM collagen+ cells (white, double-positive cells from one animal) and nkx1-1 and myoD mutually exclusive expression by FISH (4 animals, 2 experiments) and single-cell (each dot) RNA-seq17. b, Length-to-width ratio (13 control, 17 nkx1-1(RNAi) animals, 3 experiments). Circular-fiber loss after nkx1-1 RNAi by c, IF (3 experiments) and d, TEM (3 animals). Pseudocolored circular (cf), longitudinal (lf), and other fibers (yellow); sm, subepidermal membrane. e, ML-patterning defects after nkx1-1 RNAi (4 experiments). f, Wider anterior poles (2 experiments). g, Ectopic eyes (opsin+), supernumerary gut branches (mat+), wider cephalic-ganglia arc (glutamate decarboxylase+), wider midline (admp+), duplicated midline (ephR1+), and anterior poles (notum+) in 9dpa nkx1-1(RNAi) animals (3 experiments). Cartoon line, measurement site. Animals had 12 dsRNA feedings. Two-tailed Student-t test, mean ± SD, ns: not significant (b,c). Bottom left number: animals with phenotype/total tested. Bars: 10μm (a,c); 1μm (d); 100μm (f,g).
Whereas myoD inhibition resulted in thinner animals, nkx1-1 RNAi resulted in wider animals (Fig. 3b; Extended Data Fig. 8c). nkx1-1(RNAi) animals displayed a severe decrease of circular fibers, whereas longitudinal and diagonal fibers remained essentially unaffected (Fig. 3c; Extended Data Fig. 8d,e; SI video 3). Electron microscopy confirmed this circular fiber-specific phenotype (Fig. 3d). RNA-seq analysis of nkx1-1(RNAi) animals detected, like following myoD RNAi, general muscle-specific gene expression reduction (Extended Data Fig. 8f). Most PCGs were unaffected (SI Table 1) and single-muscle-cell RNA-seq showed that they were not exclusively expressed in nkx1-1+ muscle cells (Extended Data Fig. 2e). Extensive FISH analysis (Extended Data Table 1), however, revealed that wnt11-1 was predominantly expressed in nkx1-1+ cells and that wnt11-1 and activin-2 were reduced in nkx1-1(RNAi) animals (Extended Data Fig. 8g).
To determine the regeneration role of nkx1-1 and circular muscle fibers, RNAi animals were subjected to head and tail amputation. nkx1-1(RNAi) trunk fragments normally contracted wounds and regenerated heads with widely spaced eyes and indented tails (Extended Data Fig. 9a,b). Surprisingly, some nkx1-1(RNAi) animals regenerated a bifurcated AP axis with two merged heads within a single blastema (Fig. 3e). Head blastemas had numerous abnormalities (Fig. 3f,g), including ectopic eyes, supernumerary ectopic gut branches, and wider cephalic ganglia (Fig. 3g; Extended Data Fig. 9c). An ectopic brain lobe occasionally formed (SI videos 4 and 5). In addition, animals displayed broader midline gene expression domains and, in extreme cases, midline duplication with duplicated anterior poles (Fig. 3g).
At 72hpa, all nkx1-1(RNAi) animals had dramatically wider regenerating anterior poles (Fig. 3f), suggesting that wider regenerating poles coalesced into two independent anterior poles. These 72h blastemas showed aberrant muscle fiber organization, with reduced circular fibers and lacking constricted muscle fibers towards the pole (Extended Data Fig. 9d). Because the pole acts as an organizer promoting midline regeneration, a plane around which bilateral symmetry is established13, we suggest that split anterior poles organize formation of two midlines, explaining duplicated heads in nkx1-1(RNAi) animals. nkx1-1(RNAi) animals regenerated following sagittal amputations with a similar abnormal phenotype (Extended Data Fig. 9e).
Because planarian muscle provides positional information required for patterning, muscle fiber loss might result in aberrant patterning during tissue turnover. Double myoD; nkx1-1 RNAi animals had dramatically reduced BWM fibers but not other muscle types (Fig. 4a; Extended Data Fig. 10a–d; SI video 6). These animals displayed ectopic posterior eyes (Fig. 4a), indicating that exclusive BWM disruption is sufficient to affect normal patterning. Expression of several PCGs was defective in myoD; nkx1-1 RNAi animals (Fig. 4b; Extended Data Fig. 10e), including ndk, fz5/8–4, and ndl genes, which are required for eye patterning. Double myoD; nkx1-1 RNAi animals eventually lysed by 12–20 weeks of RNAi (Extended Data Fig. 10f,g), indicating disruption of body integrity with BWM loss.
Fig. 4. myoD and nkx1-1 double RNAi animals have patterning defects.
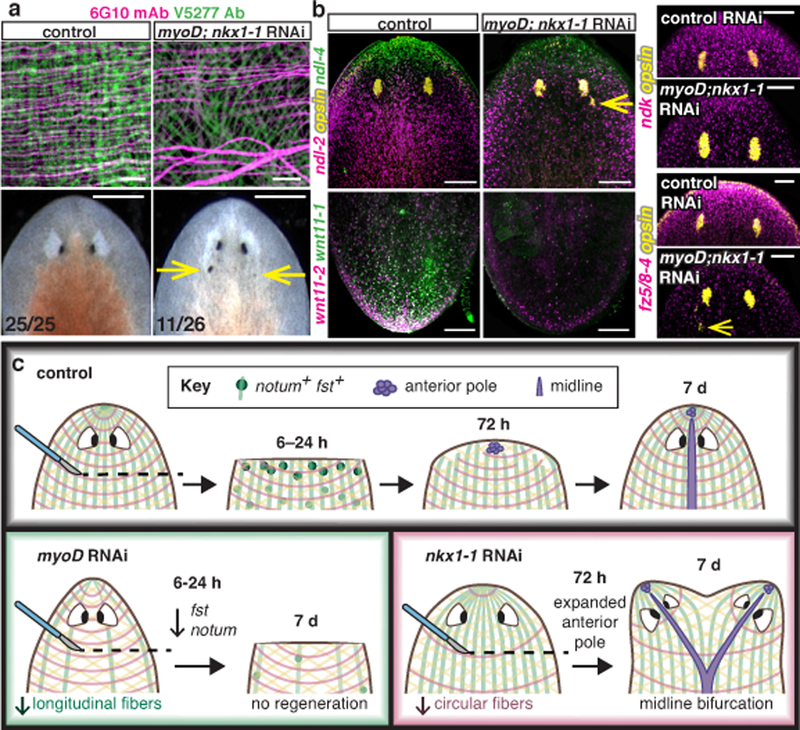
a, BWM loss (10 animals/group) and patterning defects (arrows, ectopic eyes) in myoD; nkx1-1 RNAi animals (3 experiments). b, Reduced PCG expression in myoD; nkx1-1 RNAi animals (4 animals/FISH, 2 experiments). Bottom left number: animals with phenotype/total tested. Bars: 10μm (a top); 500μm (a bottom); 100μm (b). c, Model: different muscle fiber subsets have distinct roles during regeneration: longitudinal fibers are required to initiate regenerative response and circular fibers are essential for normal ML patterning.
In conclusion, we found distinct regeneration regulatory roles for different planarian muscle fibers. myoD, a well-characterized vertebrate myogenic factor, does not have a general planarian myogenesis role. Instead, myoD specifies a BWM cell subset: the longitudinal fibers (Fig. 4c). A second TF-encoding gene, nkx1-1, specified another planarian BWM subset: the circular fibers. Our results suggest that in planarians, similarly to Drosophila, different TFs specify distinct muscle subsets. Importantly, these genes provided tools to reveal distinct roles for longitudinal and circular muscle fibers. Circular fibers were required for proper ML regeneration, with two heads emerging instead of one following circular fiber reduction. Longitudinal fibers were required to initiate the regeneration program. Animals lacking longitudinal fibers could not reestablish positional information in muscle and lacked stem cell responses to injury, despite being fully capable of tissue turnover. Simultaneous loss of both fiber classes led to homeostatic patterning defects. We conclude that, in addition to contraction, different muscle fibers have specific regulatory roles in orchestrating the process of regeneration in planarians.
Methods
Animals
Asexual Schmidtea mediterranea strain (CIW4) animals starved 7–14 days prior experiments were used.
mRNA-seq experiments
Total RNA was isolated using Trizol (Life Technologies) from single animals (uninjured myoD and nkx1-1 RNAi animals) or 5 pooled anterior wound sites from tail fragments (myoD and follistatin timecourse). Libraries were prepared using the Kapa Stranded mRNA-Seq Kit Illumina Platform (KapaBiosystems). Libraries were sequenced on an Illumina Hi-Seq. fst_00_48_wiF_1 library was removed from further analysis because of high human sequence contamination. Libraries were mapped to the dd_Smed_v4 transcriptome (http://planmine.mpi-cbg.de; 29) using bowtie 130 with -best alignment parameter. Reads from the same isotig were summed to generate raw read counts for each transcript. Pair-wise differential expression analysis was performed using DESeq291. Expression values from DESeq normalization were scaled to generate z-scores for heatmaps and these z-scores were averaged for sets of genes (17; AUC > 0.80) for summary figures. Pheatmap was used to generate scaled heatmaps.
Gene cloning and whole-mount in situ hybridizations
nkx1-1 was amplified using the following primers: fwd 5’ ATTCCAAGTCAAACGATAAGCCT; rv 5’ TTCCGTTGGTATTTCTTTAACGG and myoD was amplified using the following primers: fwd 5’ TCAACAATACCGATCCAGCCC; rv 5’ TCGGGCTTAGCGTCCATTG. Both constructs were cloned from cDNA into the pGEM vector (Promega). These constructs have been used to synthesized RNA probes and dsRNA for RNAi experiments. RNA probes were synthesized and whole-mount fluorescence in situ hybridizations (FISH) were performed as described27. Light images were taken with a Zeiss Discovery Microscope. Fluorescent images were taken with a Zeiss LSM700 Confocal Microscope using ZEN software. Co-localization analyses of FISH signals were performed using Fiji/ImageJ. For each channel, histograms of fluorescence intensity were used to determine the cut-off between signal and background. All FISH images shown are maximal intensity projections and representative of all images taken in each condition.
RNAi
dsRNA was prepared from in vitro transcription reactions (Promega) using PCR-generated templates with flanking T7 promoters, followed by ethanol precipitation, and annealed after resuspension in water. Concentration of dsRNA varied in each prep between 4 and 7 μg/ml. dsRNA was then mixed with planarian food (liver)32 and 2 μl of this mixture per animal (liver containing dsRNA) was used in feedings. For homeostasis experiments the following feeding protocol was used: animals were fed six times in three weeks, and then fed four to ten times once a week. Animals were then fixed seven days after the last feeding. For regeneration experiments animals were fed twice a week with a total number of RNAi feedings variable depending on the experiment (indicated in the Figures) and then amputated into three pieces (head, trunk and tail pieces) a week after the last RNAi feeding. Seven or nine days following amputation, trunk pieces were scored, and fixed for further analysis. For sagittal amputations, regenerating animals were scored 11 days post amputation. For all RNAi conditions tested, the total amount of dsRNA per feeding per animal was kept constant as described before27. For RNA-seq experiments in intact animals, control, myoD, and nkx1-1 RNAi animals were fed 10 times; for wound-induced RNA-seq experiments: control and myoD RNAi animals were fed eight times in four weeks, control and follistatin RNAi animals were fed six times in three weeks. For the β-catenin-1 suppression experiment, myoD RNAi animals were fed six times in three weeks and one extra feeding of either control or β-catenin-1 dsRNA was performed in the third week. Animals were then amputated the same day of the last feeding and scored at different timepoints as indicated in the Figure.
Immunostainings
Animals were fixed as for in situ hybridizations and then treated as described27. An anti-muscle mouse monoclonal antibody 6G1033 was used in a 1:1000 dilution, an anti-muscle rabbit polyclonal antibody V5277 (identified from reactivity of serum to muscle from an animal injected with an unrelated protein, Cintillo) was used in a 1:500 dilution, and an anti-mouse or rabbit Alexa conjugated antibody (Life Tech) was used in a 1:500 dilution.
Phylogenetic analysis
NKX and Netrin trees show 105 Homeobox and 20 Netrin family proteins, respectively, from diverse organisms. Trees were based on previous reports34,35. Protein sequences were aligned using MUSCLE with default settings and trimmed with Gblocks. Maximum likelihood analyses were run using PhyML with 100 or 1000 bootstrap replicates, the WAG model of amino acid substitution, four substitution rate categories and the proportion of invariable sites estimated from the dataset. Trees were visualized in FigTree. Accession numbers of proteins used to generate the phylogenetic trees can be found in SI Table 2.
Transmission electron microscopy
Animals were kept on ice for 10 min before fixation with cold 2.5% glutaraldehyde, 3% paraformaldehyde with 5% sucrose in 0.1 M sodium cacodylate buffer (pH 7.4) overnight, then post-fixed in 1% OsO4 in veronal-acetate buffer. Animals were stained overnight with 0.5% uranyl acetate in veronal-acetate buffer (pH 6.0), dehydrated, and embedded in Spurr’s resin. Transverse sections were cut on a Reichert Ultracut E microtome with a Diatome diamond knife at a thickness setting of 50 nm then stained with 2% uranyl acetate and lead citrate. The sections were examined using a FEI Tecnai spirit at 80 KV and photographed with an AMT CCD camera. All images were taken on the ventral BWM at 6800X. Muscle fibers were traced by hand and pseudocolored by the fiber orientation, size, and distance from the subepidermal membrane. Circular fibers were defined as the outermost layer adjacent to the subepidermal membrane with myosin fibers running sagittal to the plane of section, and pseudocolor in magenta. Longitudinal fibers on the ventral side were thick, and myosin fibers were transversal to the plane of section and pseudocolored in green. All other identifiable muscle fibers were pseudocolored in yellow. For visualization ease, images were blurred with ImageJ’s smooth function.
Quantifications and statistical analysis
Numbers of fibers, follistatin+, and notum+ cells were counted per animal within the regions indicated in the cartoons next to the graphs. Ratios (length to width, distance between the eyes to total length or wound-induced follistatin+ to nlg-1+ or inhibin+ cells) were calculated per animal as indicated in their respective graphs. Numbers of follistatin+, nlg-1+, or inhibin+ cells at incisions were counted and normalized by mm of wound length using DAPI signal. Unpaired two-tailed Student-t- test was used to determine significant differences between two different conditions, and one-way ANOVA test followed by Dunnett’s multiple comparison test, when analyzing more than two conditions. Mean ± SD is shown in all graphs. A linear regression using all values generated from different RNAi feedings (2, 4, 8, and 11) of control and myoD RNAi animals was calculated in Extended Data Fig. 4g. ns, not significant.
Data Availability
mRNA-seq data have been deposited in GEO with the GSE99067 accession number. Gene sequences have been deposited in GenBank, accession numbers MF070478–80. Accession numbers of reported data used in this study are: PRJNA276084 and GSE74360. Accession numbers used in phylogenetic analysis are listed in SI Table 2.
Extended Data
Extended data includes Methods, Extended data Figures 1–11, and can be found with this article online.
Extended data Figure 1. myoD is a myogenic gene in planarians specific for longitudinal muscle fibers.
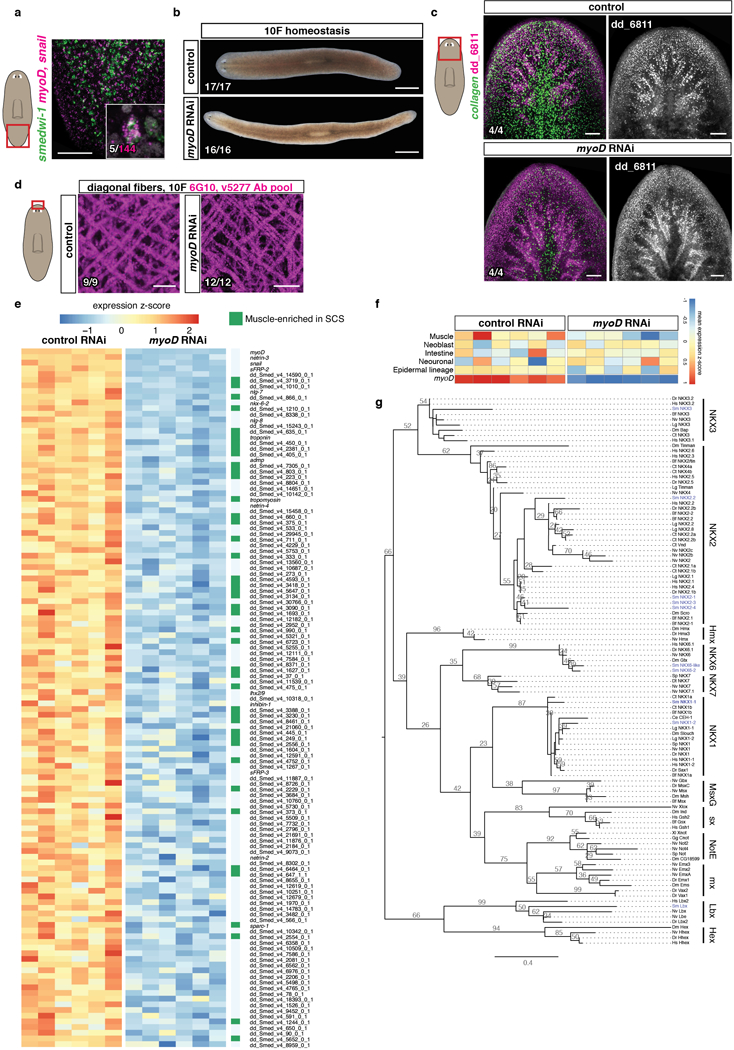
a, Co-expression of myoD (myoD and snail probes pooled) and the neoblast marker smedwi-1 (5 animals, 2 experiments. In white, double positive cells). b, Reduced expression of BWM (collagen+) but not intestinal muscle (dd_6811+17) in an uninjured myoD(RNAi) animal after 10 RNAi feedings. c, Comparable diagonal fiber numbers in myoD and control RNAi animals. Scale bars, 10 μm. d, Heatmap shows genes downregulated (log2 fold-change<0, padj-value<0.001) in uninjured myoD(RNAi) animals. In green, muscle-enriched genes from single cell RNA-seq data17 (AUC>0.8) (43/123 genes). Each column is a replicate. e, Heatmap shows other tissue-enriched gene expression is not affected in myoD(RNAi) animals. Mean of tissue-enriched genes (AUC>0.817) is used. Each column is a replicate. f, Phylogenetic analysis of homeodomain transcription factors. Accession numbers are in SI Table 2. lhx2/9 tree previously reported36. Tree shows 105 proteins from diverse organisms. Maximum likelihood analyses were run using PhyML with 100 bootstrap replicates. All ML bootstrap values >20 are shown. Bf:Branchiostoma floridae; Ce:Caenorhabditis elegans; Ct:Capitella teleta; Dm:Drosophila melanogaster; Dr:Danio rerio; Dt:Discocelis tigrina; Gg:Gallus gallus; Hs:Homo sapiens; Lg:Lottia gigantea; Nv:Nematostella vectensis; Od:Oikopleura dioica; Sm:Schmidtea mediterranea; Sp:Strongylocentrotus purpuratus; Xl:Xenopus laevis. All FISH panels are representative images of 2 independent experiments. Bottom left number: animals with phenotype out of total tested. Anterior, up. Scale bars, 100 μm unless indicated.
Extended data Figure 2. A subset of transcription factors is expressed in longitudinal muscle fibers.
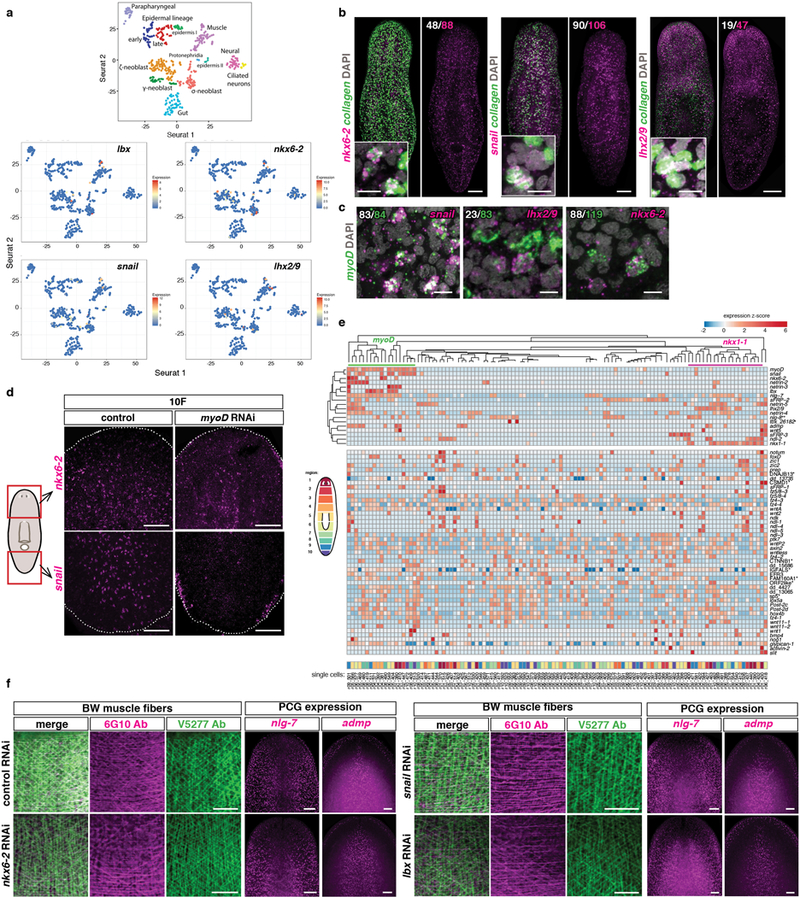
a, Seurat maps show expression of transcription factors down-regulated in myoD(RNAi) animals within a reported17 single-cell RNA-seq experiment. Each dot represents a cell. b, Co-expression of those transcription factors with the BWM marker collagen in uninjured animals. Scale bars, 100 μm; insets, 10 μm. Number of cells expressing both genes (white) within the total number of cells expressing the transcription factor (magenta) is shown (5 animals, 2 experiments). c, Co-expression of myoD and the different transcription factors (white) within the total myoD+ cells (green) in uninjured animals (5 animals, 2 experiments). Scale bars, 10 μm. d, Reduced expression of transcription factors in uninjured myoD(RNAi) animals (5 animals, 2 experiments). e, Heatmap shows two clusters of muscle cells (myoD+ and nkx1-1+) and co-expression with other muscle transcription factors, PCGs and muscle regional expressed genes. Most PCG expression is widely distributed across all muscle cells. Each column is a single cell. Analyses using previously reported single cell muscle data27. Cartoon shows in different colors the regions from where single muscle cell data have been collected27. f, No major differences in BWM structure and expression of longitudinal fiber-enriched PCGs in the different RNAi conditions tested (10 RNAi feedings, uninjured animals, 5 animals/group, 2 experiments). Scale bars, 50 μm. Anterior, up.
Extended data Figure 3. A subset of PCGs is enriched in longitudinal muscle fibers.
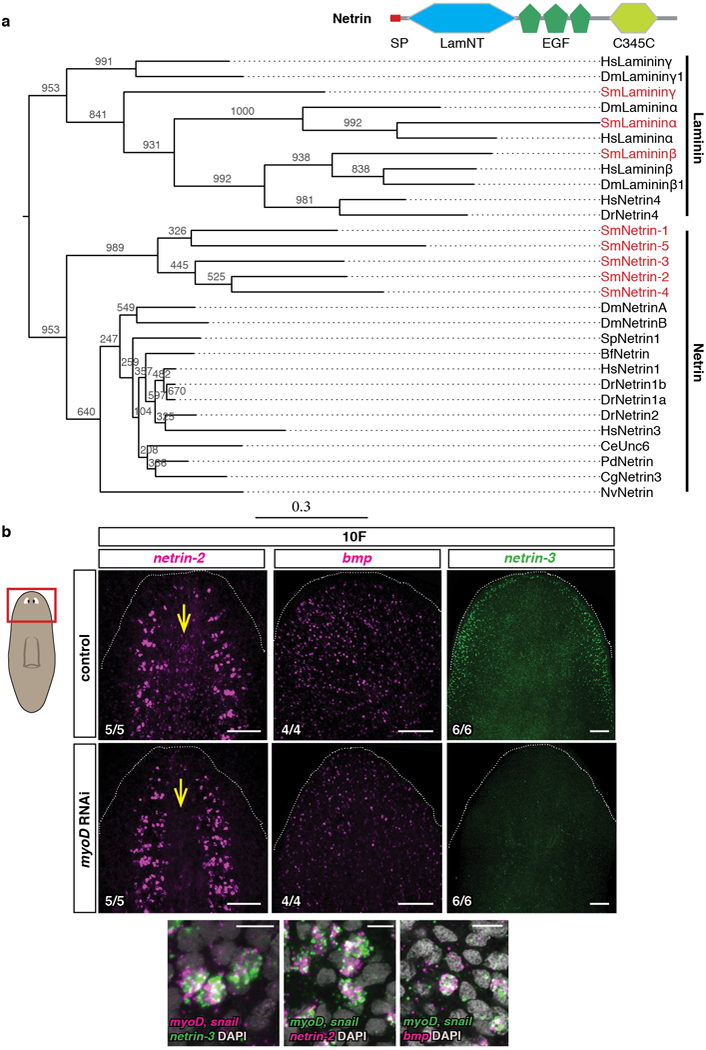
a, Phylogenetic analysis of all planarian Netrins. Accession numbers used for the tree are in SI Table 2. Tree shows 20 Netrin proteins from diverse organisms, which were aligned using MUSCLE with default settings and trimmed with Gblocks. Maximum likelihood analyses were run using PhyML with 1000 bootstrap replicates. All ML bootstrap values are shown above or below respective branch. Dm, Drosophila melanogaster; Sp, Strongylocentrotus purpuratus; Bf, Branchiostoma floridae; Hs, Homo sapiens; Dr, Danio rerio; Ce, Caenorhabditis elegans; Pd, Platynereis dumerilii ; Cg, Crassostrea gigas; Sm, Schmidtea mediterranea; Nv, Nematostella vectensis. Cartoon shows protein domain structure. b, Reduced expression of PCGs following myoD RNAi and co-expression of pooled myoD and snail with those PCGs in uninjured animals. Scale bars top panels, 100 μm; bottom panels, 10 μm. Red box in left cartoon depicts location of image shown. FISH images are representative of 2 independent experiments. Bottom left number: animals with phenotype out of total tested. Anterior, up.
Extended data Figure 4. myoD is required for regeneration.
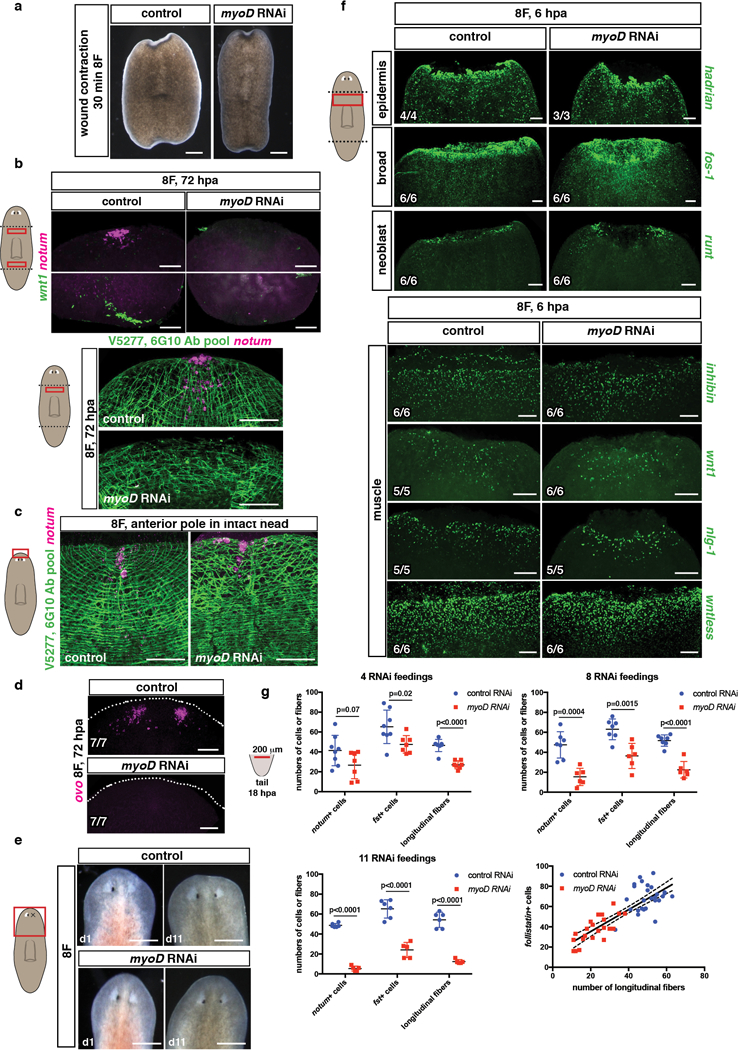
a, Normal wound contraction in myoD(RNAi) animals, trunk fragments are shown 30 minutes after amputation (15 animals, 3 experiments). b, Lack of anterior (notum+) and posterior (wnt1+) pole cells (top) and BWM structure (bottom) at 72hpa during regeneration in myoD(RNAi) animals, or c, in an uninjured animals (10 animals/group, 3 experiments). Scale bars, 50 μm. d, Neoblasts did not specify into eye progenitors (ovo+) in myoD(RNAi) animals at 72hpa (1 experiment). e, Homeostatic eye replacement at 11 days following eye resection in myoD(RNAi) animals (10 animals/group, 1 experiment). Scale bars, 500 μm. f, Normal epidermis, neoblast and muscle expression of wound-induced genes in myoD(RNAi) animals 6hpa. g, Graphs show reduced numbers of notum+ and follistatin+ cells in myoD(RNAi) animals at 18hpa, and longitudinal fibers after different numbers of RNAi feedings. Cartoon shows the region counted. Linear correlation between follistatin+ cells and longitudinal fibers. Regression coeficient, R2= 0.6928. Two-tailed Student-t test was performed. p-values are shown in graphs. Mean ±SD are shown in all graphs. Bottom left number: animals with phenotype out of total tested. Anterior, up. Scale bars, 100 μm unless indicated.
Extended data Figure 5. myoD is required for the regenerative wound-response.
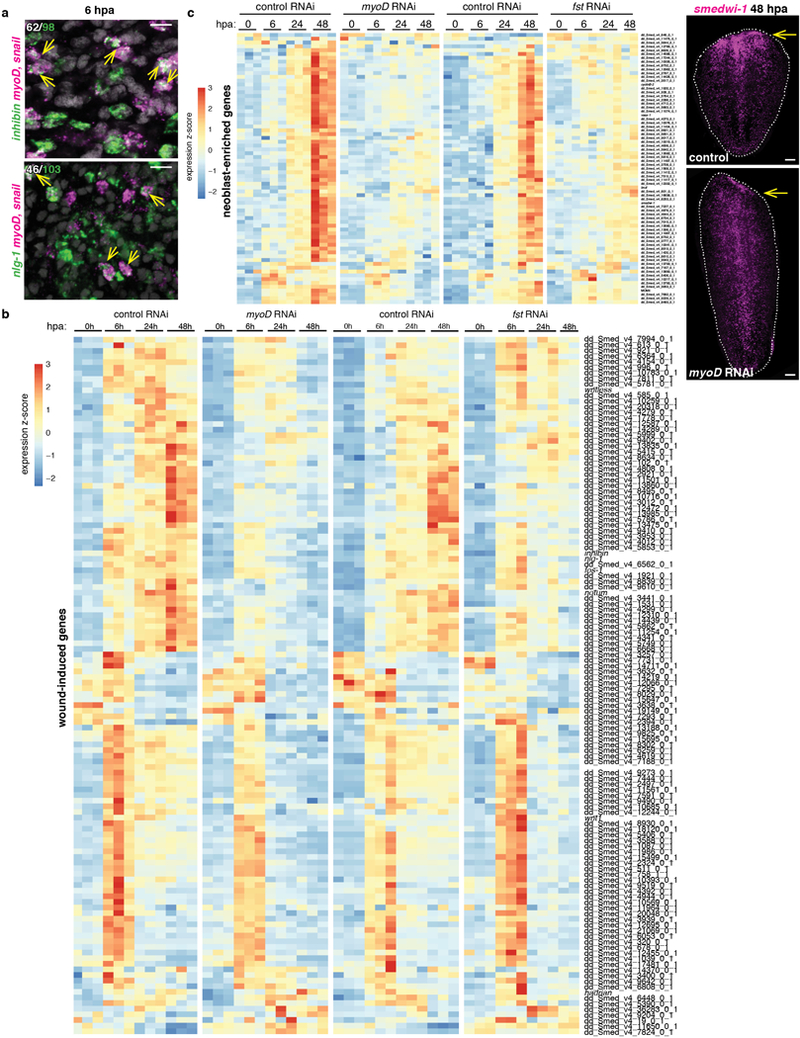
a, Partial co-expression of myoD (myoD and snail probes pooled) and muscle-wound induced genes inhibin and nlg-1 at 6hpa (4 animals, 1 experiment). Number in white indicates co-expression within total number of counted cells expressing the wound-induced gene (green). Scale bars, 10 μm. b, Heatmap shows expression of all 128 wound-induced genes12 from anterior-facing wounds of regenerating tail fragments of control, myoD, and follistatin (fst) RNAi animals at different timepoints following amputation. Each column is a replicate. c, Heatmap shows expression of neoblast genes from17 (with AUC>0.8) in anterior-facing wounds of regenerating tail fragments of control, myoD, and follistatin (fst) RNAi animals at different timepoints following amputation. Each column is a replicate. Right, no neoblast (smedwi-1+) accumulation at wounds (yellow arrow) 48hpa in myoD(RNAi) tail fragments after 8 RNAi feedings (6 animals, 1 experiment).
Extended data Figure 6. The regenerative wound-response in myoD(RNAi) animals is suppressed by activin-1 inhibition .
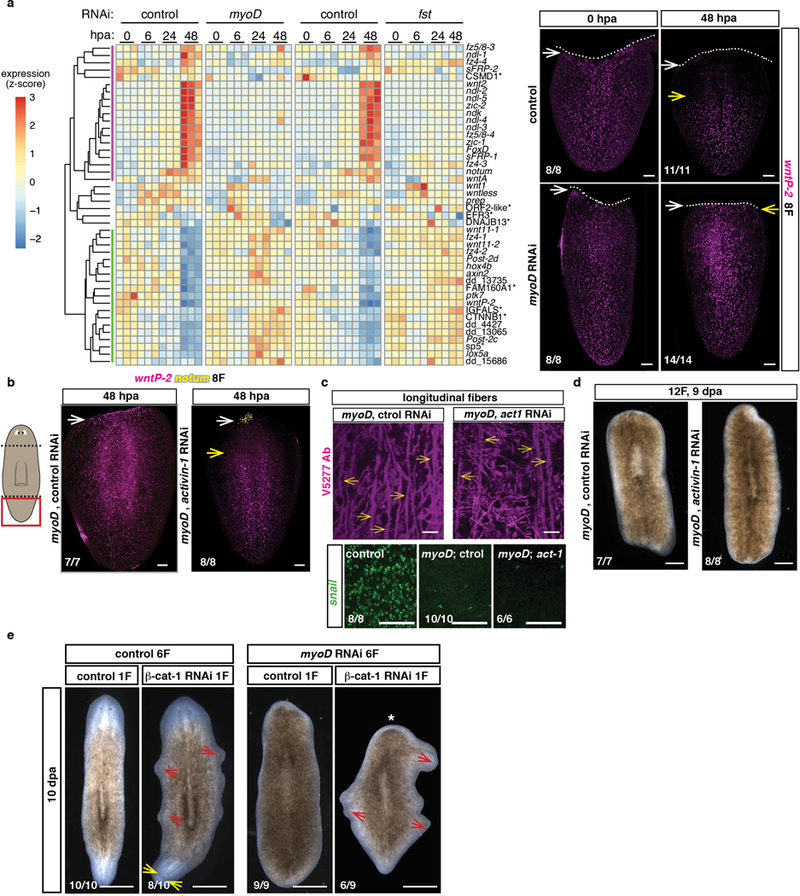
a, Heatmap shows failure to re-scale posterior or initiate expression of anterior regionally expressed muscle genes in tail fragments of myoD and follistatin RNAi animals. Each column represents a replicate. Right, failure to re-scale wntP-2 in tail fragments of myoD(RNAi) animals at 48hpa (8 animals for control, 10 animals for myoD(RNAi), 3 experiments). White arrows point to wound site, yellow arrows point to wntP-2 expression. Dotted line indicates wound site. b, Re-scaling of wntP-2 and expression of anterior pole cells (notum+) in tail fragments of double myoD; activin-1(RNAi) animals at 48hpa (2 experiments). White arrows point to wound site, yellow arrows point to wntP-2 expression. c, Comparable loss of longitudinal fibers (yellow arrows) in both myoD; control and myoD; activin-1 RNAi groups (quantification in Fig. 2i). Loss of snail expression in both myoD; control and myoD; activin-1 RNAi animals (2 experiments). d, Long-term double myoD; control and myoD; activin-1 RNAi animals failed to regenerate (2 experiments). e, β-catenin-1 inhibition did not suppress the regeneration defect of myoD(RNAi) animals (1 experiment). However, homeostatic ectopic stretching head-like outgrowths (red arrows) formed around the periphery of animals treated with β-catenin-1 dsRNA. (* denotes absence of anterior blastema, yellow arrows point to ectopic eyes). Bottom left number: animals with phenotype out of total tested. Anterior, up. Scale bars, 100 μm.
Extended data Figure 7. Transverse injuries trigger more follistatin expression than longitudinal injuries.
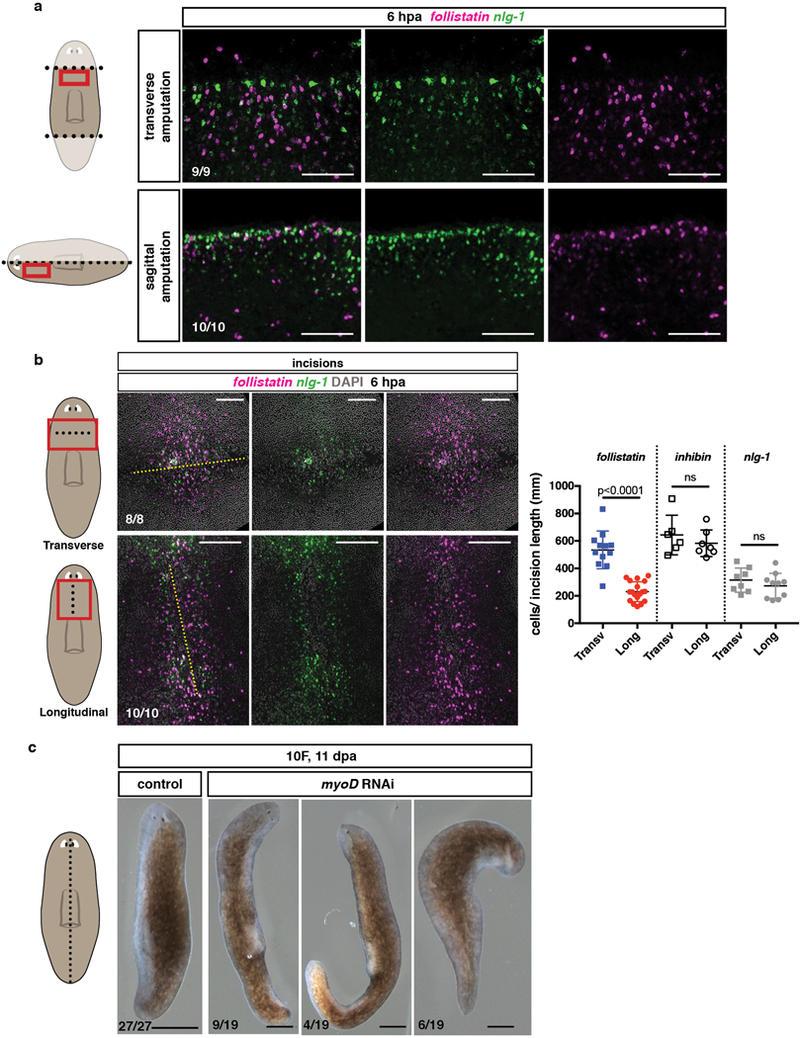
a, Higher numbers of follistatin+ relative to nlg-1+ cells in transverse versus sagittal amputations at 6hpa. b, Higher numbers of wound-induced follistatin expressing cells relative to nlg-1+ cells at transverse versus longitudinal incisions at 6hpa. Yellow dotted lines show site of incision. Right graph shows total numbers of follistatin+, inhibin+, and nlg-1+ cells per length of wound at 6hpa. Two-tailed Student-t test was performed. Mean ±SD are shown. p-values are shown in graph. Red box in cartoon depicts location of image shown; dotted line, plane of injury performed. c, Live images show myoD(RNAi) animals regenerated small blastemas following sagittal amputations (3 experiments). Scale bars, 500 μm. All FISH and live images shown are anterior, up. Bottom left number: animals with phenotype out of total tested. Scale bars, 100 μm unless indicated.
Extended data Figure 8. nkx1-1 specifies circular muscle fibers.
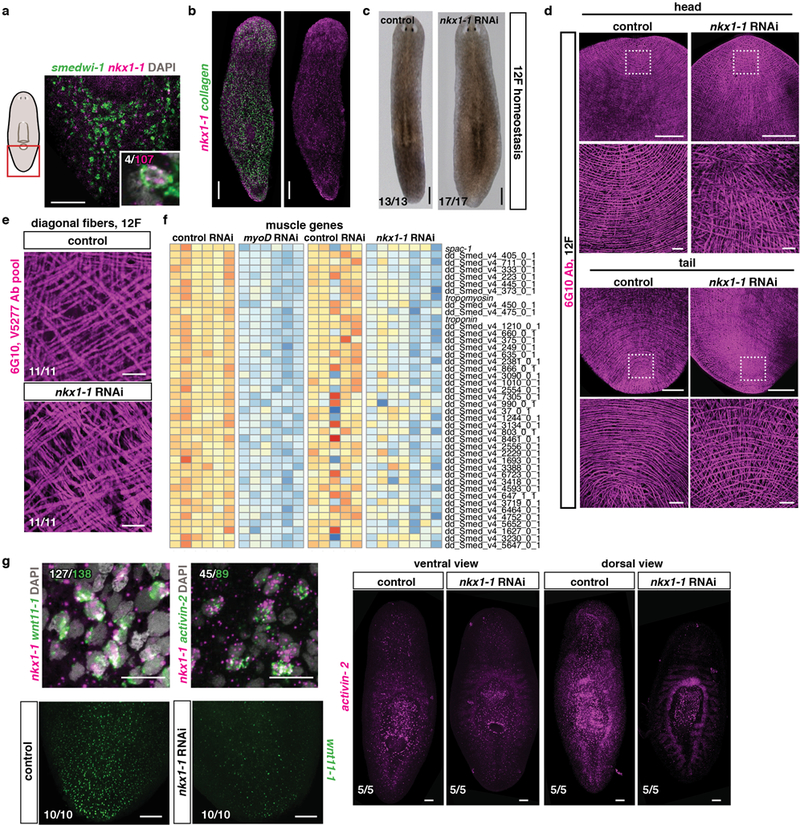
a, A minor fraction of nkx1-1+ cells co-express the neoblast marker smedwi-1 and b, expression of nkx1-1 within the collagen+ BWM in an uninjured animal (5 animals, 2 experiments). c, Animals become wider after nkx1-1 RNAi. (quantification is in Fig. 3b, 13 control and 17 nkx1-1(RNAi) animals, 3 experiments). d, Loss of circular fibers in nkx1-1(RNAi) animals (quantification in Fig. 3c). Scale bars zoom-ins, 10 μm. d, Comparable numbers of diagonal fibers in nkx1-1 and control RNAi animals (3 experiments). Scale bars, 10 μm. e, Heatmap shows 43 muscle-enriched genes downregulated (log2 fold-change <0, padj-value<0.001) in uninjured myoD RNAi and nkx1-1 RNAi animals. Each column represents a replicate. f, Co-expression of nkx1-1 and PCGs (top) and reduced PCG expression in uninjured nkx1-1(RNAi) animals after 12 RNAi feedings. Numbers in white indicate double positive cells within the total number of counted cells expressing the PCG (green). (3 experiments). Red box on cartoons depicts location of image shown. Bottom left number: animals with phenotype out of total tested. Anterior, up. Scale bars, 100 μm unless indicated.
Extended data Figure 9. nkx1-1 is required for normal medial-lateral patterning during regeneration.
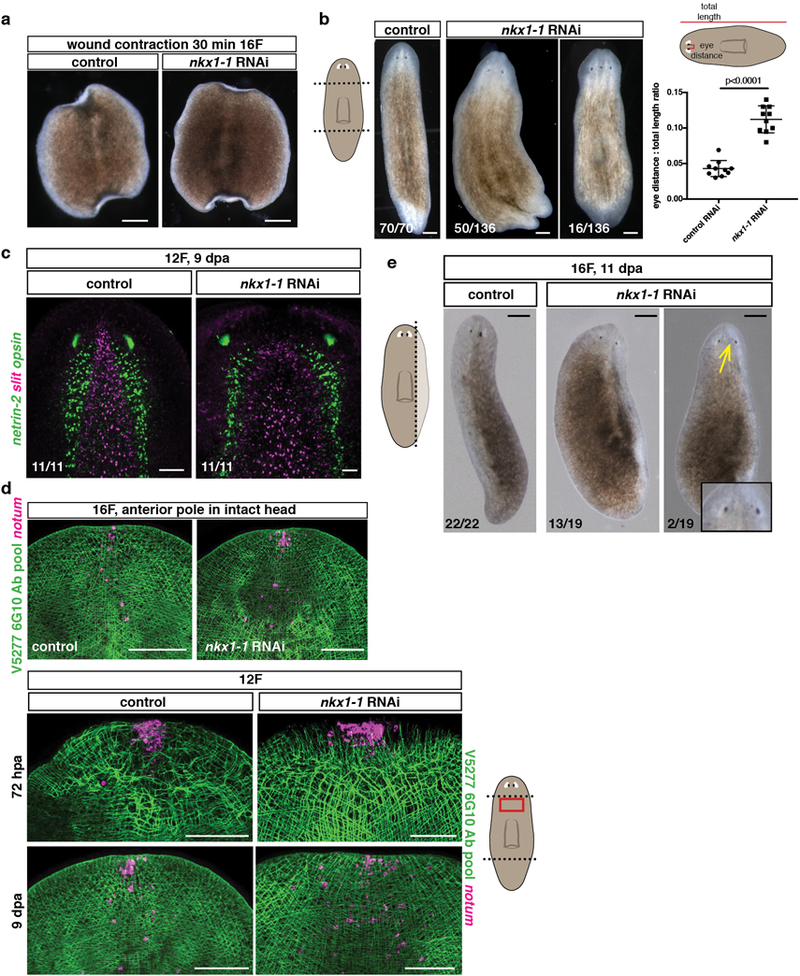
a, Normal wound contraction in nkx1-1(RNAi) animals, trunk fragments are shown 30 minutes after amputation (15 animals, 3 experiments). b, Live images of regenerating (9–14 dpa) nkx1-1(RNAi) animals after 12 RNAi feedings following a transverse amputation (5 experiments). Scale bars, 500 μm. Graph shows quantification of eye distance relative to total animal length, (10 animals/group, 2 experiments). Two-tailed Student-t test was performed. Mean ± SD are shown. Lines in cartoon on top depicts where the measurements were taken. c, Wider midline (slit) and brain lobes (netrin-2) in nkx1-1(RNAi) animals (3 experiments). d, Anterior pole (notum+) and BWM fibers in intact (top panels) and regenerating (bottom panels, 72hpa and 9dpa) nkx1-1(RNAi) animals (12 animals/group, 2 experiments). e, Live images of regenerating nkx1-1(RNAi) animals following a sagittal amputation (3 experiments). Yellow arrow points to ectopic eye. Scale bars, 200 μm. Dotted lines in cartoons show amputation sites. Red box in cartoons depicts location of image shown. All FISH and live images shown are anterior, up. Bottom left number: animals with phenotype out of total tested. Scale bars, 100 μm, unless indicated.
Extended data Figure 10. Longitudinal and circular muscle fibers are required for normal patterning during homeostatic tissue turnover.
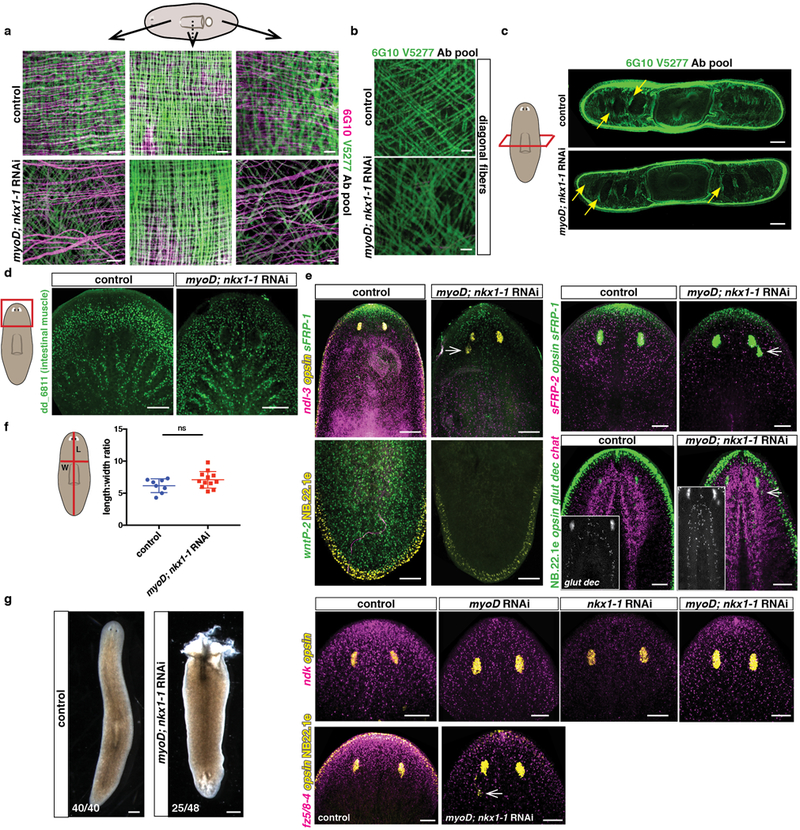
a, Reduced numbers of longitudinal and circular muscle fibers but comparable numbers of pharynx muscle fibers. Dotted line in cartoon indicates that pharynx muscle is more internal than the BWM fibers (10 animals/group, 3 experiments). Scale bars, 10 μm. b, Comparable numbers of diagonal fibers in control and myoD; nkx1-1(RNAi) animals (10 animals/group, 3 experiments). Scale bars, 10 μm. c, Cross sections showing comparable dorsal-ventral fibers (yellow arrows) in control and myoD; nkx1-1(RNAi) animals (8 animals/group, 2 experiments). d, Intestinal muscle (dd_6811) is not affected in double myoD; nkx1-1 RNAi animals (6 animals/group, 2 experiments). e, Ectopic posterior eyes (opsin+, white arrows) and reduced expression of PCGs (anterior: sFRP-1, ndk, fz5/8–4, midbody: ndl-3 and sFRP-2; and posterior: wntP-2) in double myoD; nkx1-1(RNAi) animals compared to controls (4 animals/FISH panel, 2 experiments). Elongated brain lobes were also observed in double myoD; nkx1-1(RNAi) animals compared to controls (ChAT+ and glutamic decarboxylase+ cells). NB22.1e marks epidermal cells at the boundary of the animals (5 animals/group, 2 experiments). f, Graph shows similar length to width ratios in double myoD; nkx1-1 and control RNAi animals (8 for control, 12 for double RNAi animals, 2 experiments). Two-tailed Student-t test was performed. Mean ± SD are shown. Red lines in cartoon indicate where measurements were taken. g, Live image of a dying double myoD; nkx1-1(RNAi) animal, lysis occurs after 12–20 weeks of first RNAi feeding. Scale bars, 500 μm. Red box in cartoons depicts location of image shown. All FISH and live images shown are anterior, up. Bottom left number: animals with phenotype out of total tested. Scale bars, 100 μm unless indicated.
Extended data Table 1. Patterning gene expression in different body wall muscle fibers by FISH.
Summary of gene patterning expression in different muscle fiber types by in situ hybridization.
| Name | Contig | Co- expression in myoD+ fibers |
Co- Expression in nkx1–1+ fibers |
Markedly reduced in myoD(RNAi) animals |
Markedly reduced in nkx1–1(RNAi) animals |
Markedly reduced in myoD, nkx1- 1(RNA1)animals |
|---|---|---|---|---|---|---|
| Smed-ndl-2 | dd_Smed_v4_8340_0_1 | Some | Some | no | no | yes |
| Smed-nld-3 | dd_Smed_v4_6604_0_1 | na | na | no | na | yes |
| Smed-sFRP-1 | dd_Smed_v4_13985_0_1 | na | na | no | no | no |
| Smed wnt11–2 | dd_Smed_v4_16209_0_1 | na | na | na | na | yes |
| Smed-wnt11–1 | dd_Smed_v4_14391_0_1 | None | High | no | yes | yes |
| Smed-wntP-2 | dd_Smed_v4_7326_0_1 | Some | Some | no | na | yes |
| Smed-netrin-2 | dd_Smed_v4_14852_0_1 | High | nd | yes | no | na |
| Smed-nlg-7 | dd_Smed_v4_10469_0_1 | High | Low | yes | no | na |
| Smed-bmp | dd_Smed_v4_17402_0_1 | Some | Some | some reduction | no | yes |
| Smed-netrin-1 | dd_Smed_v4_9795_0_1 | Low | Some | no | no | na |
| Smed-wnt2 | dd_Smed_v4_13487_0_1 | na | na | na | no | na |
| Smed-activin-2 | dd_Smed_v4_3324_0_1 | na | High | na | yes | na |
| Smed-nlg-8 | dd_Smed_v4_8738_0_1 | Some | Some | na | no | na |
| Smed-SFRP-2 | dd_Smed_v4_8832_0_1 | na | na | na | no | yes |
| Smed-netrin-3 | dd_Smed_v4_18181_0_1 | High | nd | yes | no | na |
| Smed-slit | dd_Smed_v4_12111_0_1 | Some | nd | yes | no | na |
| Smed-admp | dd_Smed_v4_12939_2_1 | High | Low | yes | no | na |
| Smed-netrin-5 | dd_Smed_v4_9737_0_1 | Low | Some | no | no | na |
| Smed-inhibin | dd_Smed_v4_7607_0_1 | Some (wi) | Some (wi) | no | no | na |
| Smed-nlg-1 | dd_Smed_v4_14068_0_1 | Some (wi) | Some (wi) | no | no | na |
| Smed-notum | dd_Smed_v4_24180_0_1 | High (wi) | nd | yes | na | na |
| Smed-follistatin | dd_Smed_v4_9584_0_1 | High (wi) | nd | yes | na | na |
| Smed-wntless | dd_Smed_v4_11629_0_1 | Some (wi) | Some (wi) | no | na | na |
nd: not determined
na: not assayed
wi: wound-induced
Supplementary Material
Acknowledgments
We thank Nicki Watson (Whitehead W. M. Keck Microscopy Facility) and Anthony Mahowald for TEM imaging, Sam LoCascio for eye resections, Chun-Chieh Chen for V5277, Meredith Fedorovsky for illustrations. We acknowledge support by NIH R01GM080639. We thank the Eleanor Schwartz Charitable Foundation for support. PWR is an Investigator of HHMI and an associate member of the Broad Institute of Harvard and MIT.
Footnotes
Authors have no competing financial interests.
References
- 1.Petersen CP & Reddien PW Smed-βcatenin-1 is required for anteroposterior blastema polarity in planarian regeneration. Science 319, 327–330, (2008). [DOI] [PubMed] [Google Scholar]
- 2.Gurley KA, Rink JC & Sánchez Alvarado A βcatenin defines head versus tail identity during planarian regeneration and homeostasis. Science 319, 323–327, (2008). [DOI] [PMC free article] [PubMed] [Google Scholar]
- 3.Iglesias M, Gomez-Skarmeta JL, Saló E & Adell T Silencing of Smed-β catenin1 generates radial-like hypercephalized planarians. Development 135, 1215–1221, (2008). [DOI] [PubMed] [Google Scholar]
- 4.Witchley JN, Mayer M, Wagner DE, Owen JH & Reddien PW Muscle cells provide instructions for planarian regeneration. Cell Reports 4, 633–641, (2013). [DOI] [PMC free article] [PubMed] [Google Scholar]
- 5.Cebrià F, Vispo M, Newmark P, Bueno D & Romero R Myocyte differentiation and body wall muscle regeneration in the planarian Girardia tigrina. Dev Genes Evol 207, 306–316, (1997). [DOI] [PubMed] [Google Scholar]
- 6.Cebrià F Planarian Body-Wall Muscle: Regeneration and function beyond a simple skeletal support. Front Cell Dev Biol 4, 8, (2016). [DOI] [PMC free article] [PubMed] [Google Scholar]
- 7.Buckingham M & Rigby PW Gene regulatory networks and transcriptional mechanisms that control myogenesis. Dev Cell 28, 225–238, (2014). [DOI] [PubMed] [Google Scholar]
- 8.Kassar-Duchossoy L et al. Mrf4 determines skeletal muscle identity in Myf5:Myod double-mutant mice. Nature 431, 466–471, (2004). [DOI] [PubMed] [Google Scholar]
- 9.Baugh LR & Hunter CP MyoD, modularity, and myogenesis: conservation of regulators and redundancy in C. elegans. Genes Dev 20, 3342–3346, (2006). [DOI] [PubMed] [Google Scholar]
- 10.Balagopalan L, Keller CA & Abmayr SM Loss-of-function mutations reveal that the Drosophila nautilus gene is not essential for embryonic myogenesis or viability. Dev Biol 231, 374–382, (2001). [DOI] [PubMed] [Google Scholar]
- 11.Reddien PW, Bermange AL, Murfitt KJ, Jennings JR & Sánchez Alvarado A Identification of genes needed for regeneration, stem cell function, and tissue homeostasis by systematic gene perturbation in planaria. Dev Cell 8, 635–649, (2005). [DOI] [PMC free article] [PubMed] [Google Scholar]
- 12.Cowles MW et al. Genome-wide analysis of the bHLH gene family in planarians identifies factors required for adult neurogenesis and neuronal regeneration. Development 140, 4691–4702, (2013). [DOI] [PubMed] [Google Scholar]
- 13.Scimone ML, Lapan SW & Reddien PW A forkhead transcription factor is wound-induced at the planarian midline and required for anterior pole regeneration. PLoS Genet 10, e1003999, (2014). [DOI] [PMC free article] [PubMed] [Google Scholar]
- 14.Vogg MC et al. Stem cell-dependent formation of a functional anterior regeneration pole in planarians requires Zic and Forkhead transcription factors. Dev Biol 390, 136–148, (2014). [DOI] [PubMed] [Google Scholar]
- 15.Vásquez-Doorman C & Petersen CP zic-1 Expression in Planarian neoblasts after injury controls anterior pole regeneration. PLoS Genet 10, e1004452, (2014). [DOI] [PMC free article] [PubMed] [Google Scholar]
- 16.LoCascio SA, Lapan SW & Reddien PW Eye absence does not regulate planarian stem cells during eye regeneration. Dev Cell 40, 381–391, (2017). [DOI] [PMC free article] [PubMed] [Google Scholar]
- 17.Wurtzel O et al. A generic and cell-type-specific wound response precedes regeneration in planarians. Dev Cell 35, 632–645, (2015). [DOI] [PMC free article] [PubMed] [Google Scholar]
- 18.Wenemoser D, Lapan SW, Wilkinson AW, Bell GW & Reddien PW A molecular wound response program associated with regeneration initiation in planarians. Genes Dev 26, 988–1002, (2012). [DOI] [PMC free article] [PubMed] [Google Scholar]
- 19.Wenemoser D & Reddien PW Planarian regeneration involves distinct stem cell responses to wounds and tissue absence. Dev Biol 344, 979–991, (2010). [DOI] [PMC free article] [PubMed] [Google Scholar]
- 20.Pellettieri J et al. Cell death and tissue remodeling in planarian regeneration. Dev Biol 338, 76–85, (2010). [DOI] [PMC free article] [PubMed] [Google Scholar]
- 21.Kakugawa S et al. Notum deacylates Wnt proteins to suppress signalling activity. Nature 519, 187–192, (2015). [DOI] [PMC free article] [PubMed] [Google Scholar]
- 22.Zhang X et al. Notum is required for neural and head induction via Wnt deacylation, oxidation, and inactivation. Dev Cell 32, 719–730, (2015). [DOI] [PMC free article] [PubMed] [Google Scholar]
- 23.Petersen CP & Reddien PW Polarized notum activation at wounds inhibits Wnt function to promote planarian head regeneration. Science 332, 852–855, (2011). [DOI] [PMC free article] [PubMed] [Google Scholar]
- 24.Gaviño MA, Wenemoser D, Wang IE & Reddien PW Tissue absence initiates regeneration through Follistatin-mediated inhibition of Activin signaling. eLife 2, (2013). [DOI] [PMC free article] [PubMed] [Google Scholar]
- 25.Roberts-Galbraith RH & Newmark PA Follistatin antagonizes activin signaling and acts with notum to direct planarian head regeneration. Proc Natl Acad Sci U S A 110, 1363–1368, (2013). [DOI] [PMC free article] [PubMed] [Google Scholar]
- 26.Adler CE & Sánchez Alvarado A PHRED-1 is a divergent neurexin-1 homolog that organizes muscle fibers and patterns organs during regeneration. Dev Biol 427, 165–175, (2017). [DOI] [PMC free article] [PubMed] [Google Scholar]
- 27.Scimone ML, Cote LE, Rogers T & Reddien PW Two FGFRL-Wnt circuits organize the planarian anteroposterior axis. eLife 5, (2016). [DOI] [PMC free article] [PubMed] [Google Scholar]
- 28.Knirr S, Azpiazu N & Frasch M The role of the NK-homeobox gene slouch (S59) in somatic muscle patterning. Development 126, 4525–4535 (1999). [DOI] [PubMed] [Google Scholar]
- 29.Liu SY et al. Reactivating head regrowth in a regeneration-deficient planarian species. Nature 500, 81–84, (2013). [DOI] [PubMed] [Google Scholar]
- 30.Langmead B, Trapnell C, Pop M & Salzberg SL Ultrafast and memory-efficient alignment of short DNA sequences to the human genome. Genome Biol 10, (2009). [DOI] [PMC free article] [PubMed] [Google Scholar]
- 31.Anders S & Huber W Differential expression analysis for sequence count data. Genome Biol 11, (2010). [DOI] [PMC free article] [PubMed] [Google Scholar]
- 32.Rouhana L et al. RNA interference by feeding in vitro-synthesized double-stranded RNA to planarians: methodology and dynamics. Developmental dynamics 242, 718–730, (2013). [DOI] [PMC free article] [PubMed] [Google Scholar]
- 33.Ross KG et al. Novel monoclonal antibodies to study tissue regeneration in planarians. BMC Dev Biol 15, 2, (2015). [DOI] [PMC free article] [PubMed] [Google Scholar]
- 34.Schierwater B et al. The early ANTP gene repertoire: Insights from the placozoan genome. PLoS ONE, 3, e2457, doi:10.1371/journal.pone.0002457 (2008). [DOI] [PMC free article] [PubMed] [Google Scholar]
- 35.Fahey B and Degnan BM Origin and evolution of laminin gene family diversity. MBE, 29, 1823–1836, (2012), doi.org/10.1093/molbev/mss060. [DOI] [PubMed] [Google Scholar]
- 36.Scimone ML, Kravarik KM, Lapan S and Reddien PW Neoblast specialization in regeneration of the planarian Schmidtea mediterranea. Stem Cell Reports, 3, 359–52, (2014). [DOI] [PMC free article] [PubMed] [Google Scholar]
- 37.Baguñà J & Romero R Quantitative analysis of cell types during growth, degrowth and regeneration in the planarians Dugesia mediterranea and Dugesia tigrina. Hydrobiologia 84, 181–194, (1981). [Google Scholar]
Associated Data
This section collects any data citations, data availability statements, or supplementary materials included in this article.
Supplementary Materials
Data Availability Statement
mRNA-seq data have been deposited in GEO with the GSE99067 accession number. Gene sequences have been deposited in GenBank, accession numbers MF070478–80. Accession numbers of reported data used in this study are: PRJNA276084 and GSE74360. Accession numbers used in phylogenetic analysis are listed in SI Table 2.


