A novel quantitative index to represent the heterogenetic characteristics of metastatic disease is proposed, and the value of heterogeneity among metastatic lesions on pretreatment PET/CT in predicting treatment outcome of patients with mTNBC is evaluated.
Keywords: 18F‐fluorodeoxyglucose positron emission tomography/computed tomography, Triple‐negative breast neoplasms , Metastatic breast cancer, Genetic heterogeneity, Prognosis
Abstract
Background.
Intratumoral heterogeneity of 18F‐fluorodeoxyglucose (18F‐FDG) uptake in primary tumor has proven to be a surrogate marker for predicting treatment outcome in various tumors. However, the value of intraindividual heterogeneity in metastatic diseases remains unknown. The aim of this study was to evaluate pretreatment positron emission tomography/computed tomography (PET/CT) 18F‐FDG‐based heterogeneity for the prediction of first‐line treatment outcome in metastatic triple‐negative breast cancer (mTNBC).
Materials and Methods.
mTNBC patients from three clinical trials (NCT00601159, NCT01287624, and NCT02341911) with whole‐body 18F‐FDG PET/CT scan before first‐line gemcitabine/platinum were included. Heterogeneity index (HI) and the maximum of FDG uptake (MAX) across total metastatic lesions (‐T) on baseline PET/CT scans were assessed. HI was measured by MAX divided by the minimum FDG uptake across metastatic lesions. Optimal cutoffs were determined by time‐dependent receiver operator characteristics (ROC) analysis. Progression‐free survival (PFS) and overall survival (OS) were estimated by Kaplan‐Meier method and compared by log‐rank test.
Results.
A total of 42 mTNBC patients were included in this study. The median PFS of patients with high HI‐T (>1.9) and high MAX‐T (>10.5) was significantly shorter than patients with low HI‐T (<1.9; p = .049) and low MAX‐T (<10.5; p = .001). In terms of OS, only high MAX‐T was significant for poorer outcome (p = .013). ROC curve analysis confirmed the predictive value of MAX and HI in mTNBC patients. Area under the ROC curve for MAX‐T and HI‐T was 0.75 and 0.65, indicating a higher predictive accuracy than conventional clinical risk factors.
Conclusion.
HI and MAX measured among metastatic lesions on pretreatment 18F‐FDG PET/CT scans could be potential predicators for first‐line treatment outcome in patients with mTNBC.
Implications for Practice.
Intratumoral heterogeneity of 18F‐fluorodeoxyglucose (FDG) uptake in primary tumor has proven to be a robust surrogate predictive marker. A novel positron emission tomography/computed tomography (PET/CT) parameter‐heterogeneity index (HI) to quantify the heterogeneous characteristics of metastatic disease is proposed. Triple‐negative breast cancer (TNBC) is a highly heterogeneous disease and remains a clinical challenge. The predictive performance of HI, along with the maximum FDG uptake (MAX), measured on pretreatment PET/CT scans in patients with metastatic TNBC was evaluated. Results indicate that HI and MAX may serve as applicable imaging predicators for treatment outcome of metastatic TNBC in clinical practice.
摘要
背景。已有研究证实,原发肿瘤中18F‐氟脱氧葡萄糖(18F‐FDG)摄取的瘤内异质性是预测对各种肿瘤疗效的替代指标。但是,个体内异质性对转移性疾病的价值仍然处于未知状态。本研究旨在评估治疗前基于18F‐FDG异质性的正电子发射断层扫描/计算机断层扫描(PET/CT)预测转移性三阴性乳腺癌(mTNBC)的一线治疗效果。
材料和方法。在接受一线吉西他滨/铂类之前,我们对参与三项临床试验(NCT00601159、NCT01287624和NCT02341911)的mTNBC患者进行了全身18F‐FDG PET/CT扫描。评估了基线PET/CT扫描中总转移性病灶(‐T)的异质性指数(HI)和FDG的最大摄取量(MAX)。用MAX除以转移性病灶的最小FDG摄取量以测量HI。通过时间受试者工作曲线(ROC)分析确定最佳截止值。用Kaplan‐Meier法估算无进展生存期(PFS)和总生存期(OS),并通过对数秩检验将两者进行比较。
结果。共有42名mTNBC患者参与本研究。高HI‐T(>1.9) 和高MAX‐T(>10.5)患者的中位PFS明显低于 低HI‐T(<1.9;p = 0.049)和低MAX‐T(<10.5;p =0.001)的患者。在OS方面,只有高MAX‐T显著性预后较差(p = 0.013)。ROC曲线分析证实了对mTNBC患者MAX和HI的预测价值。MAX‐T和HI‐T的ROC曲线下面积分别为0.75和0.65,表明比传统临床危险因素具有更高的预测准确性。
结论。通过治疗前18F‐FDG PET/CT扫描测量转移灶中的HI和MAX,可能是mTNBC患者一线治疗效果的潜在预测因子。
实践意义
已有研究证实,原发肿瘤中18F‐氟脱氧葡萄糖(FDG)摄取的瘤内异质性是可靠的替代预测指标。我们提出了一种新型的正电子发射断层扫描/计算机断层扫描 (PET/CT) 参数‐异质性指数 (HI),用于量化转移性疾病的异质性特征。三阴性乳腺癌(TNBC)是一种高度异质性疾病,仍是临床难题。我们在转移性TNBC患者的治疗前PET/CT扫描中评估了HI以及FDG 的最大摄取量(MAX)的预测性。结果表明,在临床实践中,可将HI和MAX作为转移性TNBC 治疗效果的适用的影像预测因子。
Introduction
Triple‐negative breast cancer (TNBC) is defined as estrogen receptor (ER) negative, progesterone receptor negative, and human epidermal growth factor receptor 2 negative disease, which accounts for 15%–20% of breast cancer [1]. Compared with other subtypes, TNBC is associated with higher rate of recurrence, shorter disease‐free survival, and poorer prognosis [2], [3], [4], remaining a clinical challenge for oncologists. The median survival for metastatic triple‐negative breast cancer (mTNBC) is only 1 year [5]. Platinum‐based chemotherapy has demonstrated promising efficacy in the treatment of mTNBC [6], [7], [8], [9]. However, TNBC is a highly heterogeneous disease, which has been classified into six intrinsic molecular subtypes by gene expression profiling [10], [11]. Predictive markers to identify mTNBC patients who could benefit more from platinum‐based treatment are highly demanded.
Intratumor heterogeneity has been demonstrated to have profound implications on malignant behaviors and treatment responses [12], [13], [14], [15]. Functional molecular imaging offers an important noninvasive approach to biologically characterize tumor heterogeneity and predict treatment outcome. Several studies have proven the predictive value of intratumor heterogeneity of baseline 18F‐fluorodeoxyglucose (18F‐FDG)‐positron emission tomography (PET) in various primary tumors, including esophageal cancer [16], lung cancer [17], cervical cancer [18], and early breast cancer [19], [20]. Common methods include textural analysis [21], [22], the coefficient of variance [23], cumulative standard uptake value (SUV)‐volume histograms (CSH) [24], the area under the CSH [23], [25], and fractal analysis [26].
Previous texture analysis had found that TNBC exhibited more tumor heterogeneity than non‐TNBC [27]. Therefore, we hypothesized that heterogeneity might also be a potential predictive and prognostic biomarker in patients with TNBC.
Despite the growing attention attached in primary tumors, limited evidence exists regarding the predictive value of 18F‐FDG heterogeneity in metastatic disease. Metastatic lesions could behave completely differently in terms of tumor biology and metabolism either compared with primary lesions or between each other [28], [29]. Findings in primary tumors might not be applicable in metastatic disease. Besides, PET/computed tomography (CT) metrics mentioned above are too complicated to be applied in metastatic settings during clinical practice with regard to the existence of multiple metastatic lesions. Thus, a feasible parameter that could reflect the intraindividual heterogeneity across various metastatic lesions is in demand.
Herein, we proposed a novel quantitative index to represent the heterogenetic characteristics of metastatic disease. The purpose of this study was to evaluate the value of heterogeneity among metastatic lesions on pretreatment PET/CT in predicting treatment outcome of patients with mTNBC.
Materials and Methods
Patient Cohort and Treatment
Three prospective clinical trials have been conducted in Fudan University Shanghai Cancer Center (FUSCC) to investigate the efficacy of gemcitabine plus platinum (GP) as the first‐line treatment for mTNBC: a phase II study (NCT00601159), a multicenter phase III study (GP arm, NCT01287624), and an ongoing clinical phase II trial (GP arm, NCT02341911). Patients enrolled in these trials who had received whole‐body 18F‐FDG PET/CT scan within a month before initiating GP treatment were included in this observational study. All patients who met this criterion were included in subsequent analysis. Imaging data, complete medical history, tumor evaluation, and follow‐ups were retrieved from a medical electronic database system.
All patients received GP regimen as their first‐line treatment for mTNBC and were treated, evaluated, and followed up strictly as clinical trials' protocol suggested. No effort was made to influence the standard care of patients included in this observational study. Tumor response was assessed every two cycles until disease progression. After disease progression, information about survival status was obtained every 3 months.
The study has been approved by the institutional review board, and the need for written informed consent was waived as it's a retrospective study.
PET/CT Imaging
18F‐FDG was generated automatically by the cyclotron (CTI RDS Eclipse ST, Siemens, Knoxville, TN). The radiochemical purity of 18F‐FDG was over 95%.
All patients fasted for at least 6 hours before the 18 F‐FDG PET/CT, and the blood glucose levels were under 10 mmol/L. The PET/CT image acquisitions were initiated on a Siemens biograph 16HR PET/CT scanner approximately 1 hour after the intravenous injection of 7.4 MBq/kg of 18F‐FDG. Before and after the injection, the patients were kept lying comfortably in a quiet, dimly lit room.
The PET/CT acquisition parameters were as follows: CT scanning was first performed, from the proximal thighs to head, milliseconds with 120 kV, 80–250 mA, pitch 3.6 mm, tube rotation time 0.5 milliseconds. Immediately after CT scanning, a PET emission scan that covered the identical transverse field of view was obtained. Acquisition time was 2–3 minutes per table position. PET image data sets were reconstructed iteratively by applying the CT data for attenuation correction, and coregistered images were displayed on a workstation. PET images were filtered with a Gaussian filter (Full width at half maximum, FWHM: 5.1 mm) so that small variations can be regarded as representing heterogeneity rather than noise [30].
Imaging Interpretation
A multimodality computer platform (Syngo; Siemens) was used for image review and manipulation. Two board‐certified experienced nuclear medicine physicians evaluated the images independently. The reviewers reached a consensus in cases of discrepancy. Quantification of glucose metabolic activity was obtained using the SUV normalized to body weight.
The maximum SUV (SUVmax) for metastatic lesions were evaluated by manually placing an individual region of interest on coregistered and fused transaxial PET/CT images. The boundaries were drawn large enough to include the visceral metastasis and nonvisceral metastasis in the axial, coronal, and sagittal PET images. A connecting outline of the volume of interest was set using a cutoff value of 40% SUVmax, and the contour around the target lesion inside the boundaries was automatically produced. Considering partial volume effect and repeatability, lesions less than 10 mm in diameter were not included in further analysis. Bone lesions were only included when confirmed by CT or MRI. MAX and MIN stood for the maximum and minimum FDG uptake across all metastatic lesions. A quantitative measure of intraindividual heterogeneity in patients with metastatic disease, heterogeneity index (HI), was measured by MAX divided by MIN. MAX and HI were assessed for total metastatic lesions (‐T), visceral metastatic lesions (‐V), and nonvisceral metastatic lesions (‐N).
Statistical Analysis
Quantitative data are presented as median (range) or number of patients (percentage). Treatment outcome was assessed by progression‐free survival (PFS) and overall survival (OS). PFS was measured from the date of GP initiation to the first documented disease progression or death. OS was defined as the time between date of GP initiation and date of death or last follow‐up. Disease progression was determined by RECIST version 1.1.
The optimal cutoff values for PET/CT parameters were determined by time‐dependent survival receiver operating characteristic (ROC) analysis (survival ROC library in R), which took into account the duration of time until censoring or progression [31]. The optimal cutoff points were used to discriminate high‐ and low‐value groups, as well as for plotting. The survival analyses were then estimated by Kaplan‐Meier method and compared by log‐rank test. All statistical analyses were conducted using SPSS version 22 (IBM, Armonk, NY). All p values were two‐sided, and the significance level of statistical tests was set at p < .05.
Results
Patient and Tumor Characteristics
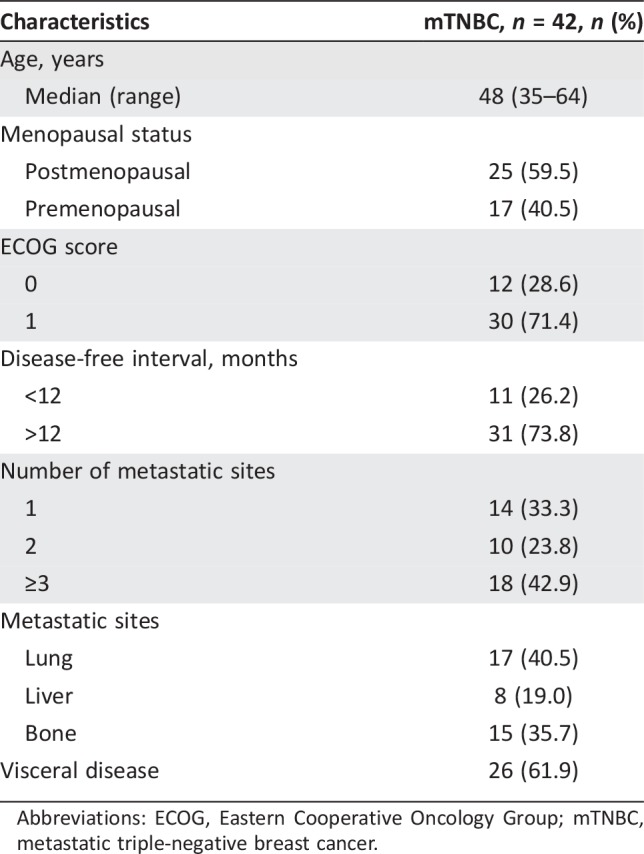
A total of 42 patients with mTNBC had underwent whole‐body 18F‐FDG PET/CT scan in FUSCC within a month before initiating first‐line GP treatment and were included in the analysis. The demographics and clinical characteristics of these patients are summarized in Table 1.
Table 1. Patients and tumor characteristics.
Abbreviations: ECOG, Eastern Cooperative Oncology Group; mTNBC, metastatic triple‐negative breast cancer.
Median age was 48 years (range 35–64). A total of 42.9% of the patients had ≥3 metastatic sites. Common sites of metastases included lung (40.5%), bone (35.7%), and liver (19.0%). More than half of the patients had visceral involvement (61.9%). A total of 328 metastatic lesions were measured and analyzed.
Predictive Value of Treatment Outcome
At the time of analysis, 81.0% of the patients had documented disease progression (n = 34) and 50.0% of the patients had died (n = 21). The median PFS was 8.6 months (95% confidence interval [CI]: 7.1–10.1), and the median OS was 19.9 months (95% CI: 17.1–22.8).
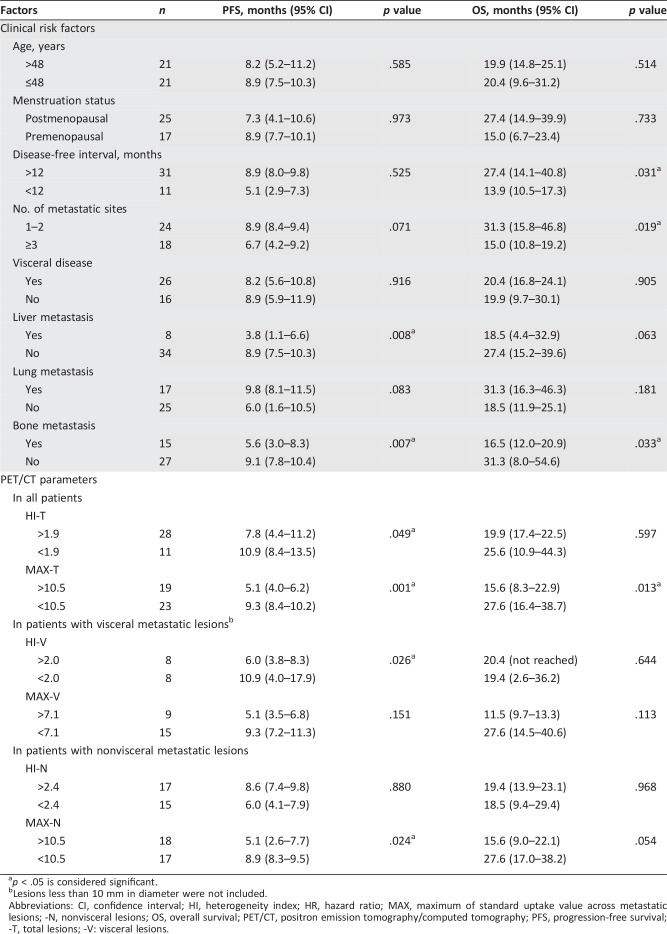
We first examined the significance of conventional clinical risk factors. The results showed that the existence of liver metastasis (p = .008) and bone metastasis (p = .007) were significantly associated with shorter PFS. In terms of OS, patients with disease‐free interval (DFI) over 12 months (p = .031), patients with fewer than three metastatic sites (p = .019) and patients without bone metastasis (p = .033) had significantly better outcome. The analysis of prognostic factors for PFS and OS are summarized in Table 2.
Table 2. Analysis of risk factors associated with PFS and OS.
p < .05 is considered significant.
Lesions less than 10 mm in diameter were not included.
Abbreviations: CI, confidence interval; HI, heterogeneity index; HR, hazard ratio; MAX, maximum of standard uptake value across metastatic lesions; ‐N, nonvisceral lesions; OS, overall survival; PET/CT, positron emission tomography/computed tomography; PFS, progression‐free survival; ‐T, total lesions; ‐V: visceral lesions.
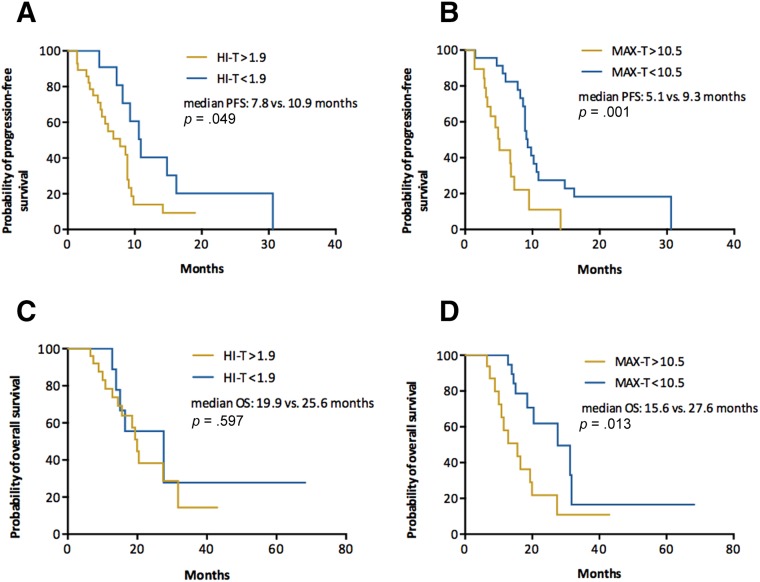
Univariate analyses were then performed to investigate the predictive and prognostic value of PET parameters. The optimal cutoff value for PFS was determined by time‐dependent ROC analysis. The median PFS of patients with high HI‐T (>1.9) was 7.8 months, significantly shorter than 10.9 months in patients with low HI‐T (<1.9, p = .049; Fig. 1A). The median PFS of patients with high MAX‐T (>10.5) was also significantly shorter than patients with low MAX‐T (<10.5; 5.1 vs. 9.3 months, p = .001; Fig. 1B). In terms of OS, high MAX‐T (>10.5) was significant for poorer outcome (15.6 vs. 27.6 months, p = .013; Fig. 1D). The median OS was also numerically shorter in patients with high HI‐T, although not significantly (19.9 vs. 25.6 months, p = .597; Fig. 1C). These results demonstrated that both MAX‐T and HI‐T were significant predictive factors for PFS, whereas OS was only associated with MAX‐T (Fig. 1).
Figure 1.
All patients. Kaplan‐Meier curves of PFS (A, B) and OS (C, D) stratified by HI‐T (A, C) and MAX‐T (B, D).
Abbreviations: HI, heterogeneity index; MAX, maximum of standard uptake value across metastatic lesions; OS, overall survival; PFS, progression‐free survival; ‐T, total lesions.
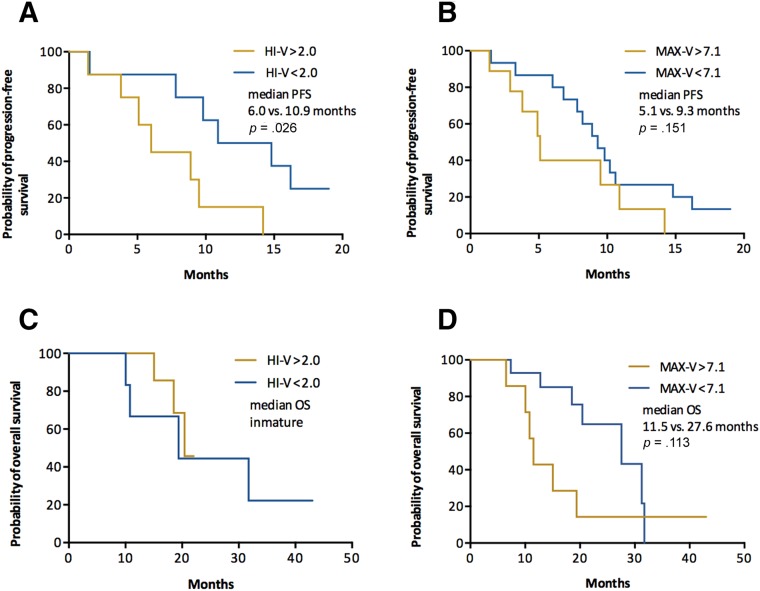
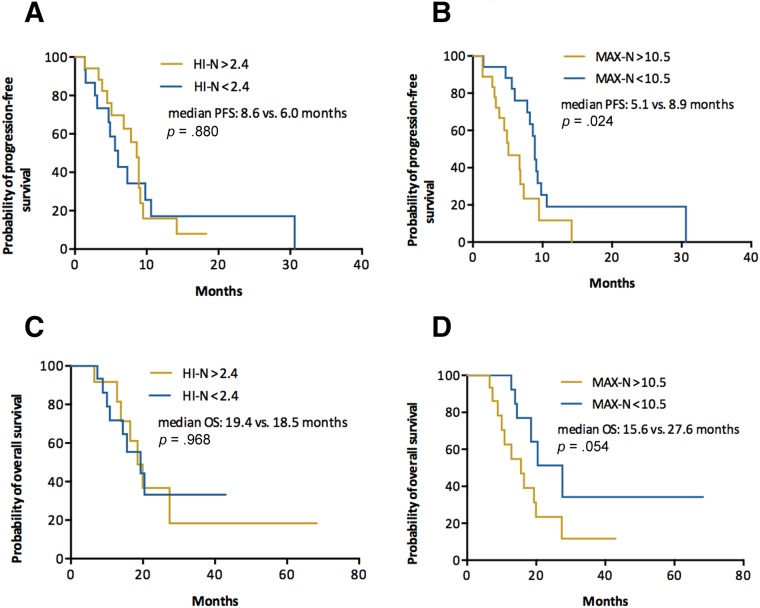
Exploratory analysis was also performed to investigate the predictive value of HI and MAX measured in visceral and nonvisceral metastatic lesions. In patients with visceral metastasis, only HI‐V was a significant predictive factor for PFS, whereas MAX‐V was not significant for either PFS or OS (Fig. 2). In patients with nonvisceral metastasis, however, only MAX‐N had significant predictive and borderline prognostic value (Fig. 3).
Figure 2.
Patients with visceral metastasis. Kaplan‐Meier curves of PFS (A, B) and OS (C, D) stratified by HI‐V (A, C) and MAX‐V (B, D).
Abbreviations: HI, heterogeneity index; MAX, maximum of standard uptake value across metastatic lesions; OS, overall survival; PFS, progression‐free survival; ‐V, visceral lesions.
Figure 3.
Patients with nonvisceral metastasis. Kaplan‐Meier curves of PFS (A, B) and OS (C, D) stratified by HI‐N (A, C) and MAX‐N (B, D).
Abbreviations: HI, heterogeneity index; MAX, maximum of standard uptake value across metastatic lesions; ‐N, nonvisceral lesions; OS, overall survival; PFS, progression‐free survival.
Time‐Dependent ROC Analysis
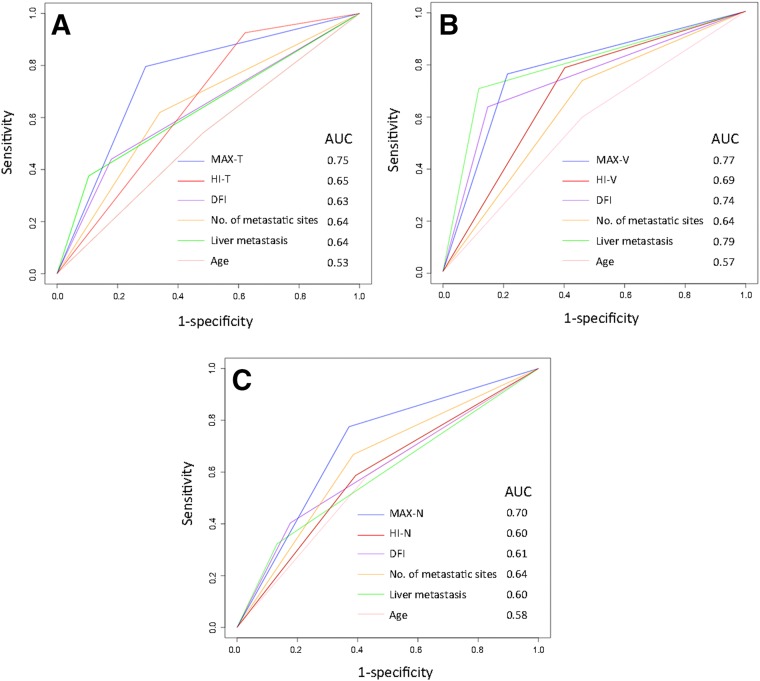
To further assess and compare the predictive performance of PET/CT parameters, time‐dependent ROC curves for censored and survival data and areas under the ROC curve (AUC) were investigated (Fig. 4).
Figure 4.
Time‐dependent receiver operator characteristics curves for MAX, HI, and clinical predictive factors. (A): All patients. (B): Patients with visceral metastasis. (C): Patients with nonvisceral metastasis.
Abbreviations: AUC, area under the receiver operator characteristic curve; DFI, disease‐free interval; HI, heterogeneity index; MAX, maximum of standard uptake value across metastatic lesions; ‐N, nonvisceral lesions; ‐T, total lesions; ‐V: visceral lesions.
MAX‐T and HI‐T showed an AUC of 0.75 and 0.65 in all patients, indicating higher predictive accuracy than clinical risk factor, including age, DFI, number of metastatic sites, and liver metastasis. Besides, MAX and HI have both demonstrated greater potential in predicting PFS when measured in visceral lesions with an AUC of 0.77 and 0.69, compared with 0.70 and 0.60 when measured in nonvisceral lesions. MAX has shown steadily higher predictive value in all patient cohort (AUC 0.75), visceral metastasis cohort (AUC 0.77), and nonvisceral metastasis cohort (AUC 0.70) compared with conventional clinical factors. The performance of HI, however, was inferior to clinical factors in patients with nonvisceral metastasis.
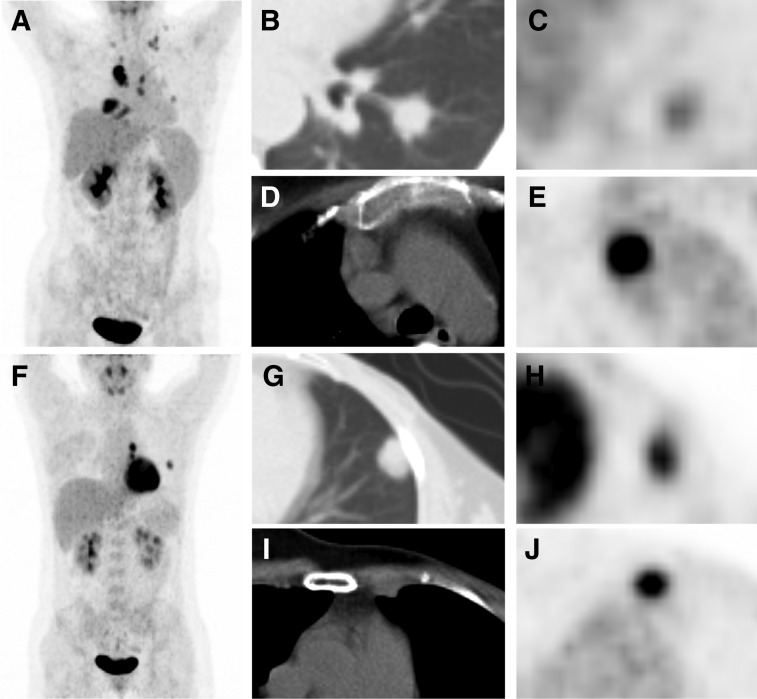
Collectively, our results demonstrated that both MAX and HI, measured in metastatic lesions, were promising predictive indicators of treatment outcome and could provide additional information to conventional clinical risk factors. Images of representative tumors are shown in Figure 5.
Figure 5.
Representative images. (A–E): A 45‐year‐old female patient with metastatic triple‐negative breast cancer (mTNBC) underwent 18F‐fluorodeoxyglucose (18F‐FDG) positron emission tomography (PET)/computed tomography (CT) scan (A, maximum intensity projection [MIP] image). We detected that the left lung lesion had the lowest 18F‐FDG uptake in all metastatic lesions (B, CT image; C, PET image, minimum FDG uptake across all lesions [MIN]: maximum standard uptake value [SUVmax] = 2.0), whereas the mediastinal lymph node lesion had the highest uptake (D, CT image; E, PET image, maximum FDG uptake across all lesions [MAX]: SUVmax = 15.3). Therefore, heterogeneity index (HI)‐total lesions (‐T) of this patient was 7.7, and she had a progression‐free survival (PFS) of 3.3 months and an overall survival (OS) of 7.4 months. (F–J): A 35‐year‐old female patient with mTNBC underwent 18F‐FDG PET/CT scan (F, MIP image). We detected that the left lung lesion had the lowest 18F‐FDG uptake in all metastatic lesions (G, CT image; H, PET image, MIN: SUVmax = 5.9), whereas the left internal mammary lymph node lesion had the highest uptake (I, CT image; J, PET, MAX: SUVmax = 8.8); Therefore, HI‐T of this patient was 1.5, and she had a PFS of 10.6 months and an OS of 15.0 months.
Discussion
We proposed a novel quantitative index‐HI, to represent the heterogenetic characteristics of metastatic disease. Our study indicated that baseline HI‐T detected by 18F‐FDG PET/CT can predict treatment efficacy for patients with mTNBC. Heterogeneity of FDG uptake among metastatic lesions could be affected by many factors, such as cellular hypoxia, necrosis, vascularization, and proliferation [32]. These factors are also closely related to the physiologic mechanism of chemotherapy resistance. Thus, patients with a high extent of FDG uptake heterogeneity are likely to be less responsive to platinum‐based chemotherapy and may benefit more from clinical trials of novel agents. No significant association was observed between intraindividual heterogeneity and OS, which was partially due to different treatment strategies patients received afterwards.
Although SUVmax has been widely used as a prognostic biomarker in various primary tumors [21], [33], [34], [35], [36], its role in metastatic breast cancer (MBC) has not been fully understood. Zhang et al. [37] and Cokmert et al. [38] have proven the prognostic value of SUVmax in patients with ER‐positive and unselected MBC. The only study conducted in mTNBC cohort, however, showed that SUVmax was not significantly correlated with OS [39]. As admitted by the author, confounding factors existing in this study, such as different PET machines and treatment regimens, could have biased the results [39]. In order to minimize the influence of previous treatment on tumor heterogeneity and patient outcome, our study was conducted in a cohort of treatment‐naive mTNBC patients with baseline PET/CT undertook in our hospital before being treated with the same regimen. Our results demonstrated that baseline MAX‐T was effective for the prediction of both PFS and OS in mTNBC, which was consistent with previous findings in early TNBC [40]. Thus, conventional SUVmax could also serve as a potential surrogate marker of treatment outcome and survival in patients with mTNBC.
The ROC curve analysis confirmed that both MAX‐T and HI‐T can successfully identify platinum‐sensitive patients from unselected mTNBC patients, with an AUC of 0.75 and 0.65, respectively, indicating higher predictive accuracy than conventional clinical risk factors, including age, DFI, number of metastatic sites, and liver metastasis. Although the predictive performance of HI alone was moderate, these novel parameters detected in baseline PET/CT could offer additional information for patients selecting other than clinical risk factors.
Considering that the metabolic processes may differ greatly between viscera and nonviscera, we further explored the predictive value of MAX and HI measured in visceral and nonvisceral lesions respectively. Our data showed that both MAX and HI measured in visceral metastases has demonstrated greater potential in predicting PFS than these parameters measured in nonvisceral lesions. Visceral involvement has been proved to be an independent indicator of worse prognosis in patients with MBC by various studies [41], [42], [43]. So, it is possible that PET parameters measured in visceral lesions are of higher value in predicting treatment outcome, for the fact that visceral involvement has a greater impact on pharmacodynamics as well as patients' survival. However, validation from prospective studies with larger patient cohorts and predefined stratification are needed to verify this speculation. Besides, the performance of MAX was steadier across all cohorts, whereas the predictive value of HI measured in nonvisceral lesions was not satisfactory.
The underlying biological mechanisms behind these findings are still under investigation. The relation between microenvironment heterogeneity and multidrug resistance has been widely studied recently and hopefully could shed a light on this field.
We establish a novel parameter to represent the intraindividual heterogeneity among metastatic lesions, and it has proven to be applicable and effective as a predictive marker in clinical practice. To the best of our knowledge, we were also the first to investigate the predictive value of 18F‐FDG PET/CT heterogeneity in patients with mTNBC. Heterogeneity and MAX measurement on pretreatment PET/CT could help oncologists to identify patients that would benefit more from platinum‐based chemotherapy so as to select the optimal treatment strategy for individual mTNBC patients.
There were several limitations in the present study. First of all, it should be acknowledged that this study was based on a small cohort of Asian patients, so that optimal cutoff values shown in this study might not be applicable to all patients. Validation from prospective studies with larger patient cohorts are necessary to confirm our findings. Moreover, we didn't correct the partial volume effect. But we studied lesions that were over 10 mm in diameter, so the partial volume effect might not significantly affect the results. In addition, heterogeneity measured by 18F‐FDG distribution could only reflect tumor heterogeneity in terms of glucose metabolism. However, the heterogeneity of a malignant tumor also manifests as its complex biological mechanism, such as oxygen consumption, cell proliferation, and apoptosis. More studies are needed to explore the application of various bioparameters to provide a multidimensional vision of intratumoral heterogeneity. Finally, the underlying biological mechanisms of interlesional heterogeneity in mTNBC need to be further investigated by translational studies.
Conclusion
This pilot study highlights the value of HI, as well as MAX, measured among metastatic lesions on pretreatment 18F‐FDG PET/CT scans in predicting first‐line treatment outcome of mTNBC. The results of this study indicate that 18F‐FDG‐based heterogeneity among metastatic disease, especially in visceral lesions, could help identify mTNBC patients who could benefit from platinum‐based chemotherapy.
Acknowledgments
We thank all the physicians, nurses, and technicians who participated in this study. Additionally, we'd like to thank all the patients for their support of our study. This study was funded by the Shanghai Committee of Science and Technology Fund (15ZR1407600), National Natural Science Foundation of China (Grant No. 81302300), and Shanghai Natural Science Foundation of China (Grant No. 12ZR1406300). All procedures performed in studies involving human participants were in accordance with the ethical standards of the institutional research committee and with the 1964 Helsinki declaration and its later amendments or comparable ethical standards.
Contributed equally
Contributor Information
Zhongyi Yang, Email: yangzhongyi21@163.com.
Biyun Wang, Email: pro_wangbiyun@163.com.
Author Contributions
Conception/design: Chengcheng Gong, Zhongyi Yang, Biyun Wang
Provision of study material or patients: Xichun Hu, Yingjian Zhang, Zhonghua Wang, Jian Zhang, Biyun Wang, Yannan Zhao, Yi Li, Yizhao Xie
Collection and/or assembly of data: Chengcheng Gong, Guang Ma
Data analysis and interpretation: Chengcheng Gong, Guang Ma
Manuscript writing: Chengcheng Gong, Guang Ma
Final approval of manuscript: Zhongyi Yang, Biyun Wang
Disclosures
The authors indicated no financial relationships.
References
- 1.Foulkes WD, Smith IE, Reis‐Filho JS. Triple‐negative breast cancer. N Engl J Med 2010;363:1938–1948. [DOI] [PubMed] [Google Scholar]
- 2.Schneider BP, Winer EP, Foulkes WD et al. Triple‐negative breast cancer: Risk factors to potential targets. Clin Cancer Res 2008;14:8010–8018. [DOI] [PubMed] [Google Scholar]
- 3.Reis‐Filho JS, Tutt AN. Triple negative tumours: A critical review. Histopathology 2008;52:108–118. [DOI] [PubMed] [Google Scholar]
- 4.Dent R, Hanna WM, Trudeau M et al. Pattern of metastatic spread in triple‐negative breast cancer. Breast Cancer Res Treat 2009;115:423–428. [DOI] [PubMed] [Google Scholar]
- 5.Kassam F, Enright K, Dent R et al. Survival outcomes for patients with metastatic triple‐negative breast cancer: Implications for clinical practice and trial design. Clin Breast Cancer 2009;9:29–33. [DOI] [PubMed] [Google Scholar]
- 6.Staudacher L, Cottu PH, Dieras V et al. Platinum‐based chemotherapy in metastatic triple‐negative breast cancer: The Institut Curie experience. Ann Oncol 2011;22:848‐856. [DOI] [PubMed] [Google Scholar]
- 7.Bhattacharyya A, Ear US, Koller BH et al. The breast cancer susceptibility gene BRCA1 is required for subnuclear assembly of Rad51 and survival following treatment with the DNA cross‐linking agent cisplatin. J Biol Chem 2000;275:23899–23903. [DOI] [PubMed] [Google Scholar]
- 8.Hu XC, Zhang J, Xu BH et al. Cisplatin plus gemcitabine versus paclitaxel plus gemcitabine as first‐line therapy for metastatic triple‐negative breast cancer (CBCSG006): A randomised, open‐label, multicentre, phase 3 trial. Lancet Oncol 2015;16:436–446. [DOI] [PubMed] [Google Scholar]
- 9.Zhang J, Wang Z, Hu X et al. Cisplatin and gemcitabine as the first line therapy in metastatic triple negative breast cancer. Int J Cancer 2015;136:204–211. [DOI] [PubMed] [Google Scholar]
- 10.Metzger‐Filho O, Tutt A, de Azambuja E et al. Dissecting the heterogeneity of triple‐negative breast cancer. J Clin Oncol 2012;30:1879–1887. [DOI] [PubMed] [Google Scholar]
- 11.Lehmann BD, Bauer JA, Chen X et al. Identification of human triple‐negative breast cancer subtypes and preclinical models for selection of targeted therapies. J Clin Invest 2011;121:2750–2767. [DOI] [PMC free article] [PubMed] [Google Scholar]
- 12.Shipitsin M, Campbell LL, Argani P et al. Molecular definition of breast tumor heterogeneity. Cancer Cell 2007;11:259–273. [DOI] [PubMed] [Google Scholar]
- 13.Junttila MR, de Sauvage FJ. Influence of tumour micro‐environment heterogeneity on therapeutic response. Nature 2013;501:346–354. [DOI] [PubMed] [Google Scholar]
- 14.Rottenberg S, Vollebergh MA, de Hoon B et al. Impact of intertumoral heterogeneity on predicting chemotherapy response of BRCA1‐deficient mammary tumors. Cancer Res 2012;72:2350–2361. [DOI] [PMC free article] [PubMed] [Google Scholar]
- 15.Asselin MC, O'Connor JP, Boellaard R et al. Quantifying heterogeneity in human tumours using MRI and PET. Eur J Cancer 2012;48:447–455. [DOI] [PubMed] [Google Scholar]
- 16.Tixier F, Le Rest CC, Hatt M et al. Intratumor heterogeneity characterized by textural features on baseline 18F‐FDG PET images predicts response to concomitant radiochemotherapy in esophageal cancer. J Nucl Med 2011;52:369–378. [DOI] [PMC free article] [PubMed] [Google Scholar]
- 17.Kang SR, Song HC, Byun BH et al. Intratumoral metabolic heterogeneity for prediction of disease progression after concurrent chemoradiotherapy in patients with inoperable stage III non‐small‐cell lung cancer. Nucl Med Mol Imaging 2014;48:16–25. [DOI] [PMC free article] [PubMed] [Google Scholar]
- 18.Kidd EA, Grigsby PW. Intratumoral metabolic heterogeneity of cervical cancer. Clin Cancer Res 2008;14:5236–5241. [DOI] [PubMed] [Google Scholar]
- 19.Ha S, Park S, Bang JI et al. Metabolic radiomics for pretreatment 18F‐FDG PET/CT to characterize locally advanced breast cancer: Histopathologic characteristics, response to neoadjuvant chemotherapy, and prognosis. Sci Rep 2017;7:1556. [DOI] [PMC free article] [PubMed] [Google Scholar]
- 20.Son SH, Kim DH, Hong CM et al. Prognostic implication of intratumoral metabolic heterogeneity in invasive ductal carcinoma of the breast. BMC Cancer 2014;14:585. [DOI] [PMC free article] [PubMed] [Google Scholar]
- 21.Cook GJ, Yip C, Siddique M et al. Are pretreatment 18F‐FDG PET tumor textural features in non‐small cell lung cancer associated with response and survival after chemoradiotherapy? J Nucl Med 2013;54:19–26. [DOI] [PubMed] [Google Scholar]
- 22.Vaidya M, Creach KM, Frye J et al. Combined PET/CT image characteristics for radiotherapy tumor response in lung cancer. Radiother Oncol 2012;102:239–245. [DOI] [PubMed] [Google Scholar]
- 23.Watabe T, Tatsumi M, Watabe H et al. Intratumoral heterogeneity of F‐18 FDG uptake differentiates between gastrointestinal stromal tumors and abdominal malignant lymphomas on PET/CT. Ann Nucl Med 2012;26:222–227. [DOI] [PubMed] [Google Scholar]
- 24.El Naqa I, Grigsby P, Apte A et al. Exploring feature‐based approaches in PET images for predicting cancer treatment outcomes. Pattern Recognit 2009;42:1162–1171. [DOI] [PMC free article] [PubMed] [Google Scholar]
- 25.van Velden FH, Cheebsumon P, Yaqub M et al. Evaluation of a cumulative SUV‐volume histogram method for parameterizing heterogeneous intratumoural FDG uptake in non‐small cell lung cancer PET studies. Eur J Nucl Med Mol Imaging 2011;38:1636–1647. [DOI] [PMC free article] [PubMed] [Google Scholar]
- 26.Miwa K, Inubushi M, Wagatsuma K et al. FDG uptake heterogeneity evaluated by fractal analysis improves the differential diagnosis of pulmonary nodules. Eur J Radiol 2014;83:715–719. [DOI] [PubMed] [Google Scholar]
- 27.Soussan M, Orlhac F, Boubaya M et al. Relationship between tumor heterogeneity measured on FDG‐PET/CT and pathological prognostic factors in invasive breast cancer. PLoS One 2014;9:e94017. [DOI] [PMC free article] [PubMed] [Google Scholar]
- 28.Huyge V, Garcia C, Alexiou J et al. Heterogeneity of metabolic response to systemic therapy in metastatic breast cancer patients. Clin Oncol (R Coll Radiol) 2010;22:818–827. [DOI] [PubMed] [Google Scholar]
- 29.Bural G, Torigian DA, Houseni M et al. Tumor metabolism measured by partial volume corrected standardized uptake value varies considerably in primary and metastatic sites in patients with lung cancer. A new observation. Hell J Nucl Med 2009;12:218–222. [PubMed] [Google Scholar]
- 30.Orlhac F, Soussan M, Maisonobe JA et al. Tumor texture analysis in 18F‐FDG PET: Relationships between texture parameters, histogram indices, standardized uptake values, metabolic volumes, and total lesion glycolysis. J Nucl Med 2014;55:414–422. [DOI] [PubMed] [Google Scholar]
- 31.Adams H, Tzankov A, Lugli A et al. New time‐dependent approach to analyse the prognostic significance of immunohistochemical biomarkers in colon cancer and diffuse large B‐cell lymphoma. J Clin Pathol 2009;62:986–997. [DOI] [PubMed] [Google Scholar]
- 32.van Velden FH, Cheebsumon P, Yaqub M et al. Evaluation of a cumulative SUV‐volume histogram method for parameterizing heterogeneous intratumoural FDG uptake in non‐small cell lung cancer PET studies. Eur J Nucl Med Mol Imaging 2011;38:1636–1647. [DOI] [PMC free article] [PubMed] [Google Scholar]
- 33.Cacicedo J, Fernandez I, Del Hoyo O et al. Prognostic value of maximum standardized uptake value measured by pretreatment 18F‐FDG PET/CT in locally advanced head and neck squamous cell carcinoma. Clin Transl Oncol 2017;19:1337–1349. [DOI] [PubMed] [Google Scholar]
- 34.Lee SW, Nam SY, Im KC et al. Prediction of prognosis using standardized uptake value of 2‐[(18)F] fluoro‐2‐deoxy‐d‐glucose positron emission tomography for nasopharyngeal carcinomas. Radiother Oncol 2008;87:211–216. [DOI] [PubMed] [Google Scholar]
- 35.Zhang S, Li S, Pei Y et al. Impact of maximum standardized uptake value of non‐small cell lung cancer on detecting lymph node involvement in potential stereotactic body radiotherapy candidates. J Thorac Dis 2017;9:1023–1031. [DOI] [PMC free article] [PubMed] [Google Scholar]
- 36.Aogi K, Kadoya T, Sugawara Y et al. Utility of (18)F FDG‐PET/CT for predicting prognosis of luminal‐type breast cancer. Breast Cancer Res Treat 2015;150:209–217. [DOI] [PMC free article] [PubMed] [Google Scholar]
- 37.Zhang J, Jia Z, Ragaz J et al. The maximum standardized uptake value of 18 F‐FDG PET scan to determine prognosis of hormone‐receptor positive metastatic breast cancer. BMC Cancer 2013;13:42. [DOI] [PMC free article] [PubMed] [Google Scholar]
- 38.Cokmert S, Tanriverdi O, Karapolat I et al. The maximum standardized uptake value of metastatic site in 18 F‐FDG PET/CT predicts molecular subtypes and survival in metastatic breast cancer: An Izmir Oncology Group study. J BUON 2016;21:1410–1418. [PubMed] [Google Scholar]
- 39.Marinelli B, Espinet‐Col C, Ulaner G et al. Prognostic value of FDG PET/CT‐based metabolic tumor volumes in metastatic triple negative breast cancer patients. Am J Nucl Med Mol Imaging 2016;6:120–127. [PMC free article] [PubMed] [Google Scholar]
- 40.Ohara M, Shigematsu H, Tsutani Y et al. Role of FDG‐PET/CT in evaluating surgical outcomes of operable breast cancer‐‐Usefulness for malignant grade of triple‐negative breast cancer. Breast 2013;22:958–963. [DOI] [PubMed] [Google Scholar]
- 41.Zhang J, Fan M, Xie J et al. Chemotherapy of metastatic triple negative breast cancer: Experience of using platinum‐based chemotherapy. Oncotarget 2015;6:43135–43143. [DOI] [PMC free article] [PubMed] [Google Scholar]
- 42.Leone BA, Vallejo CT, Romero AO et al. Prognostic impact of metastatic pattern in stage IV breast cancer at initial diagnosis. Breast Cancer Res Treat 2017;161:537–548. [DOI] [PubMed] [Google Scholar]
- 43.Imkampe A, Bendall S, Bates T. The significance of the site of recurrence to subsequent breast cancer survival. Eur J Surg Oncol 2007;33:420–423. [DOI] [PubMed] [Google Scholar]


