Several barriers to clinical trial participation exist; however, the burden of cost and time associated with travel to visits may contribute to disparities in care. This analysis may inform ways that health care payers and systems can reduce the burden to encourage equitable recruitment and retention in cancer clinical trials.
Keywords: Representativeness in clinical trials, Recruitment science, Travel distance, Health care costs, Cancer clinical trial disparities
Abstract
Background.
Recent literature suggests that living in a rural setting may be associated with adverse cancer outcomes. This study examines the burden of travel from home to cancer center for clinical trial (CT) enrollees.
Materials and Methods.
Patients from the University of California San Francisco Clinical Trial Management System database who enrolled in a cancer CT for a breast, genitourinary, or gastrointestinal malignancy between 1993 and 2014 were included. Cancer type, household zip code, race/ethnicity, phase of study, study sponsor, and year of signed consent were exported. Distance traveled from home to center was calculated using a GoogleMaps application programming interface. The relationships of distance with phase of CT, household income, and race/ethnicity were examined.
Results.
A total of 1,600 patients were enrolled in breast (55.8%), genitourinary (29.4%), or gastrointestinal (14.9%) cancer CTs. The overall median unidirectional distance traveled from home to study site was 25.8 miles (interquartile range [IQR] 11.5–75.3). Of the trial sponsors examined, principal investigator (56.4%), industry (22.2%), cooperative group (11.6%), and National Institutes of Health (NIH; 9.8%), the longest distance traveled was for NIH‐sponsored trials, with a median of 39.4 miles (p < .001). Phase I (8.4%) studies had the longest distance traveled, with a median of 41.2 miles (IQR 14.5–101.0 miles; p = .001). White patients (83%) traveled longer compared with black patients (4.4%), with median distances of 29.9 and 13.9 miles, respectively (p < .001). Patients from lower‐income areas (n = 799) traveled longer distances compared with patients from higher‐income areas (n = 773; 58.3 vs. 17.8 miles, respectively; p < .001). A multivariable linear model where log10 (distance) was the outcome and adjusting for the exported variables and income revealed that cancer type, year of consent, race/ethnicity, and income were significantly associated with distance traveled.
Conclusion.
This study found that the burden of travel is highest among patients enrolled in NIH‐sponsored trials, phase I studies, or living in low‐income areas. These data suggest that travel burden for cancer CT participants may be significant.
Implications for Practice.
This study is one of the first to measure travel distance for patients in cancer clinical trials using a real‐world GoogleMaps calculator. Out‐of‐pocket expenses such as travel are not typically covered by health care payers; therefore, patients may face considerable cost to attend each study visit. Using a single‐center clinical trials enrollment database, this study found that the burden of travel is highest for patients enrolled in National Institutes of Health‐sponsored trials and phase I studies, as well as for patients living in low‐income areas. Results suggest that a significant proportion of patients enrolled in clinical trials face a substantial travel burden.
Introduction
Living in rural settings in the U.S. may be associated with adverse health outcomes [1]. Prior research examining disparities based on geography has focused on examining access to standard care [2]; however, less attention and funding have been directed to disparities in cancer clinical trial participation [3]. High‐volume tertiary care centers tend to have a large catchment area and care for patients who travel long distances in order to make clinical trial appointments. To our knowledge, the length of travel assumed by cancer treatment clinical trials enrollees has not been closely examined. Although several barriers to clinical trial participation exist, the burden of cost and time associated with travel to visits may contribute, in part, to disparities in whom trials serve [4], [5], [6].
Typically, discussions around cost and clinical trial implementation are focused on the burden carried by a sponsor [7], with little recognition of the out‐of‐pocket cost assumed by participants enrolled [4], [8], [9]. More recently, literature has emerged exploring the role of travel as an added cost placed on patients [10]. In this study, we attempted to measure the distance traveled by participants in cancer treatment clinical trials at an academic medical center in Northern California. We used the calculated distance traveled as an indicator of the relative burden of time and money assumed by patients and their caregivers while enrolled in a treatment clinical trial and in addition estimated the cost using Internal Revenue Service (IRS) mileage rate. This analysis is important because treatment clinical trials tend to require several recurring visits to a study site, and the out‐of‐pocket costs associated with travel are not typically covered by health care payers. The added expense of time and money may be prohibitive for a subset of patients. Therefore, if we are better able to approximate these costs, this analysis may inform ways in which health care payers and systems can mitigate them in order to encourage equitable recruitment and retention in cancer clinical trials. Furthermore, these data may inform strategies for trial sponsors to increase accrual for study trials by removing travel/costs as a barrier to participation.
Materials and Methods
Data Source
The primary data source for this study was the University of California San Francisco (UCSF) Clinical Trials Management System (CTMS) database. Data on enrolled patients at The Helen Diller Family Comprehensive Cancer Center (HDFCCC) in San Francisco, California, were obtained and stored in the CTMS database. A CTMS data extraction query was performed to obtain the variables of interest: registered home zip code, race/ethnicity of patient, study protocol number, and year of signed consent for study. The sponsor and phase of study was manually matched with the unique study protocol number linked with each patient's information in the CTMS database.
The research procedures were approved by the UCSF Committee on Human Research.
Study Population
Patients with breast, gastrointestinal, or genitourinary malignancies who enrolled in a cancer clinical trial at HDFCCC between 1993 and 2014, were 18 years or older, and who had a registered home zip code and a unique sequence number in the CTMS database were included in the study cohort. Patients for whom the registered home zip code was outside of the U.S. continental 48 states were excluded from the study. Patients for whom the data lacked a unique sequence number were excluded from further analysis out of concern that they may have signed a written consent to participate but did not actually enroll in the study.
Outcomes and Covariates
The primary outcome of the study was unidirectional driving distance in miles from home to study site. Participant zip code of residence registered at time of trial enrollment in the UCSF CTMS database was mapped to the zip code of HDFCCC site using a GoogleMaps application programming interface (API). The API calculated an estimated unidirectional distance traveled in miles from participant home zip code to Cancer Center zip code. Each result produced by the GoogleMaps API was measured in miles and did not include multiple routes or myriad other travel costs such as tolls and parking. We also calculated the cost in dollars using IRS mileage rate per year [11].
Other variables examined included patient racial/ethnic background, study sponsor type, phase of study, year that consent was signed by participant, and census‐reported median income for home zip code. The category of sponsor type was determined based on the UCSF cancer center's standard definitions. Studies categorized as National Institutes of Health (NIH) trials were publicly funded clinical trials supported by the NIH. Cooperative group trials were supported by external clinical research study organizations that tend to be collaborative. Principal investigator or institutional in‐house clinical research studies were coauthored by the cancer center's investigators with a variable payer source. Lastly, industry trials were financially sponsored by a pharmaceutical company and influenced the design and implementation of the clinical research study. The median household income data were derived from census data from 2006 to 2010 [12]. The patients were grouped in high‐ and low‐income subgroups based on whether their income lay above or below the median ($77,483), respectively. Additionally, the patients were also categorized into high/middle/low income groups based on income <$65,462, between $65,462 and $101,094, and >$101,094, respectively. These income cut‐points were informed by research from Dickman et al. and are derived from 361% ($65,462) and 558% ($101,094) of the 2012 federal poverty level for a family of three, or two adults and one child [13].
Statistical Analysis
Demographic and clinical characteristics were summarized by descriptive statistics. In general, frequency distribution and percentage were used to summarize categorical variables, and median with interquartile range (IQR) was used to describe continuous variables. Comparison of the continuous variables among groups were assessed using the two‐sample t test and analysis of variance for two groups and more than two groups, respectively. Logarithm transformation with base 10 (log10) was applied to distance and cost to avoid extreme skewness. Chi‐square test was applied to test if there is statistical association between two categorical variables. Furthermore, linear regression model and Cochran Armitage Test were utilized to test if the continuous and categorical variables had changes over the year of consent. Multivariate linear regression models with distance (or cost) as the outcome were used to assess the variables associated with distance (or cost). The model was adjusted for the available variables: cancer type, year of consent, sponsor type, phase of study, race/ethnicity, and income. The statistical significance was declared at p < .05, and all the statistical analysis was done by the statistical computing software R [14].
Results
Patient Characteristics
In total, data for 4,189 patients were extracted from the UCSF CTMS database from 1994 to 2014. However, only 1,605 patients had a matched unique sequence number and registered home zip code (Table 1). The remaining 2,584 patients had incomplete data, lacked a unique sequence number, and did not ultimately participate on a clinical trial and therefore were excluded from this analysis. Five patients registered zip codes outside of the U.S. continental 48 states and were excluded from the study as outliers. Of the remaining 1,600 patients, the median unidirectional distance traveled from home to study site was 25.8 miles (IQR 11.5–75.3).
Table 1. Characteristics of patients in study.
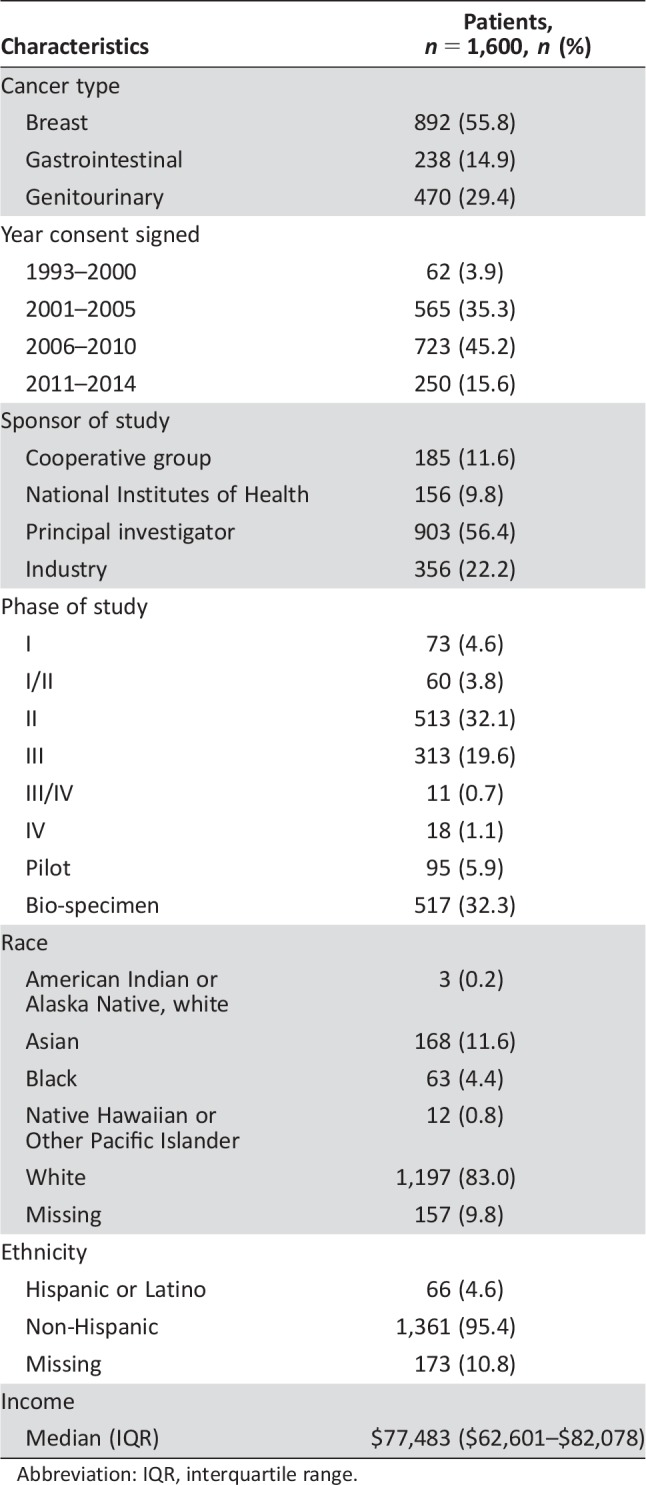
Abbreviation: IQR, interquartile range.
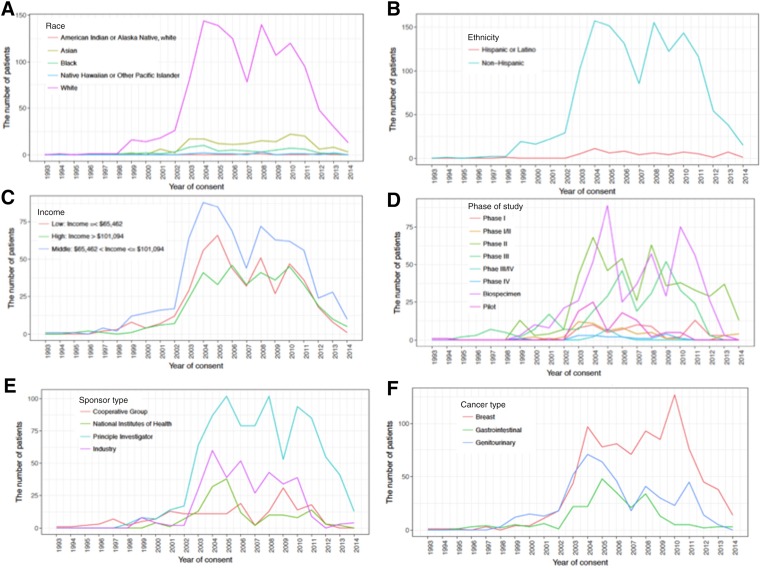
As seen in Figure 1A–1C, across the study period, the majority of patients enrolled in cancer clinical trials were racially/ethnically white and of middle‐income based on census data. There was significant difference in distance traveled among different races (overall p < .001); specifically, white patients (83%) had a longer unidirectional distance traveled compared with black patients (4.4%, p < .001) and with Asian patients (11.6%, p < .001), with median unidirectional distances traveled of 29.9, 13.9, and 13.4 miles, respectively. Patients from low‐income areas (income <$77,483, n = 773) traveled longer than those from high‐income areas (income >$77,483, n = 799), with median unidirectional distances traveled of 58.3 and 17.8 miles, respectively (p < .001). Furthermore, patients with income lower than $65,462 traveled longer compared with middle‐income ($65,462–$101,094) and high‐income (>$101,094) patients, with median distances traveled of 92.3, 15.9, and 19.3 miles, respectively (p < .001; Table 2).
Figure 1.
Frequencies of patients enrolled by year of consent. The number of patients across year of consent by race (A), ethnicity (B), income (C), phase of study (D), sponsor type (E), and cancer type (F).
a. The number of patients across year of consent by race; b. The number of patients across year of consent by ethnicity; c. The number of patients across year of consent by income; d. The number of patients across year of consent by phase of study; e. The number of patients across year of consent by sponsor type; f. The number of patients across year of consent by cancer type.
Table 2. The relationship between income and distance.
The income of each patient was estimated by using the median income of the corresponding zip code from U.S. census.
High/low income was defined as the estimated income is higher/lower than the median of the estimated income across all patients.
High/middle/low income was defined as the estimated income <$65,462, between $65,462 and $101,094, and >$101,094, respectively.
Abbreviations: Max, maximum; Min, minimum; Std, Standard Deviation.
Study Sponsor Type
Figure 1E and 1F reveal that principal investigator studies were the predominant sponsor type (56.4%, n = 903) and breast was the primary cancer type (53.9%, n = 892) during the study period. The NIH‐sponsored studies accounted for 9.8% (n = 156) of trial sponsors and had the longest median unidirectional distance traveled at 39.4 miles (Table 3). Industry, cooperative group, and principal investigator‐initiated studies followed with median distances of 30.4, 22.6, and 22.6 miles, respectively. A significant difference was identified between the distance traveled for NIH‐sponsored trials compared with all other study sponsor types (NIH vs. cooperative group, p = .001; NIH vs. principal investigator, p < .001; NIH vs. industry sponsor, p = .007). However, no difference was identified between the remaining study sponsor types (cooperative group vs. principal investigator, p = .776; cooperative group vs. industry sponsor, p = .419; principal investigator vs. industry sponsor, p = .159).
Table 3. The relationship between distance and sponsor type.
Overall p value < .01.
Abbreviations: Max, maximum; Min, minimum; NIH, National Institutes of Health; PI, principal investigator; Std, Standard Deviation.
Phase of Study
Among the analyzed cohort, 8.4% of patients were enrolled in phase I studies, with a median unidirectional distance traveled of 41.2 miles and standard deviation of 376.5 miles (Table 4). Among patients enrolled in phase II and III/IV studies, the median distance from home to study site was approximately 23.4 and 23.8 miles, respectively. Approximately 5.9% of patients were enrolled in pilot studies, with the least median distance traveled estimated at 14.5 miles. The distance traveled for pilot studies was found to be significantly different from other phases of study (pilot vs. phase I, p < .001; pilot vs. phase II, p = .043; pilot vs. phase III/IV, p = .030; pilot vs. bio‐specimen, p = .012). Additionally, a significant difference was found between phase I studies and phase II and phase III/IV, p < .001). No difference was found between the distance traveled for phase III/IV studies compared with phase II studies (p = .710) or bio‐specimen studies (p = .378). Similarly, examining phase II compared with bio‐specimen did not reveal a difference in distance traveled (p = .493).
Table 4. The relationship between phase of study and distance.
Overall p value = .02.
Abbreviations: Max, maximum; Min, minimum; Std, Standard Deviation.
Derivative Analysis
The cost in dollars was calculated using IRS mileage rate per year. For 1994–1999, the mileage rate per year was 0.10 dollars, and the average values were used if multiple values occurred in a single year (2008 and 2011) [11]. Similar results as those for distance traveled were discovered in the cost. The median travel cost for white patients in U.S. dollars was $5.32, compared with black ($2.36, p < .001) and Asian patients ($2.77, p < .001). The median travel cost of patients with income lower than $65,462 was $15.82 miles, compared with that of middle‐income ($65,462–$101,094) and high‐income patients (>$101,094) at $3.14 and $3.91 miles, respectively (p < .001).
A significant difference was identified between the travel cost for NIH‐sponsored trials (median = $6.61) compared with all other study sponsor types (NIH vs. cooperative group with median of $3.98, p = .001; NIH vs. principal investigator with median of $4.01, p < .001; NIH vs. industry sponsor with median of $4.63, p = .021). The travel cost for pilot studies with median of $2.49 was found to be significantly lower than other study phases except phase III/V (pilot vs. phase I, p < .001; pilot vs. phase I/II, p = .001; pilot vs. phase II, p = .002; pilot vs. phase III, p = .014; pilot vs. phase III/IV, p = .019; pilot vs. phase IV, p = .354; pilot vs. bio‐specimen, p < .001). Additionally, the travel cost of phase I studies is significantly higher than that of phase II (p = .007), phase III (p = .008), and phase III/IV (p < .002) studies.
Time‐Trended Analysis
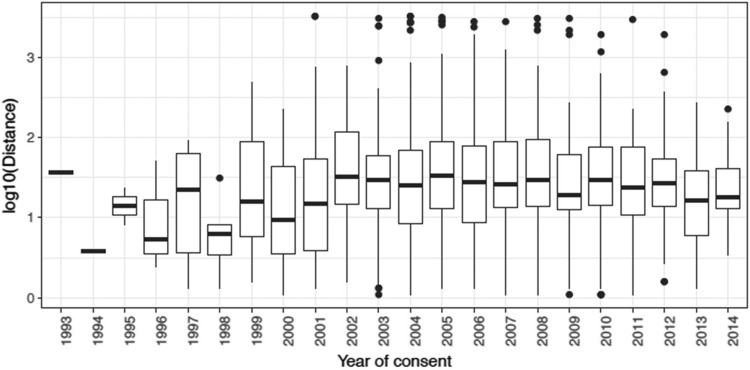
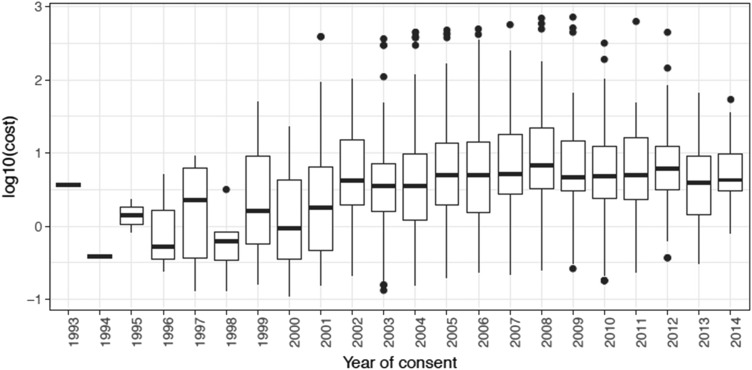
As shown in Figure 2, distance traveled did not significantly increase linearly over time (trend test; p = .746); however, it was significantly different across year of consent (p = .002). Additionally, as shown in Figure 3, the cost significantly increased across the time period (p < .001). Lastly, a formal trend test did not show that the proportion of race had a significant change by year of consent. However, a slight increase in income across year of consent was observed (p = .064).
Figure 2.
Distance traveled by year of consent.
Figure 3.
Travel cost by year of consent.
Multivariate Analysis
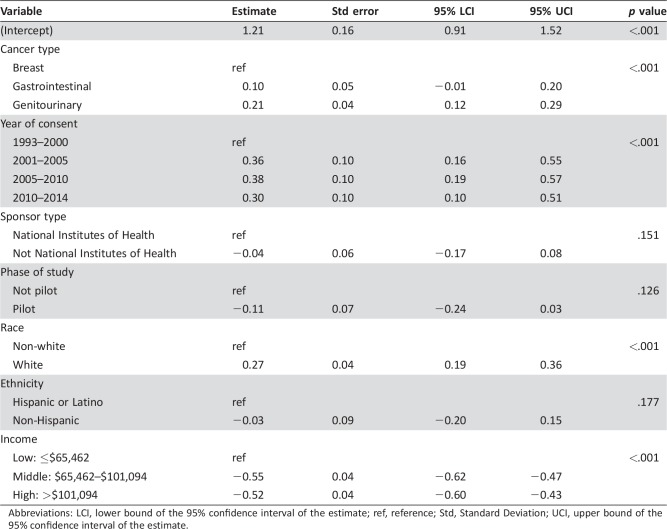
A multivariable linear model based on available data where log10 (distance) was considered the outcome revealed that cancer type, year of consent, race, and income were significantly associated with distance traveled (Table 5). Specially, gastrointestinal and genitourinary cancer patients traveled more than breast cancer patients (p < .001), white patients traveled more than non‐white patients (p < .001), patients with low income traveled more than those with high/middle income (p < .001), and patients who consented after the year 2000 intend to travel more than those who consented on or before the year 2000. Similar results were observed for log10 (cost; supplemental online data).
Table 5. Multivariate analysis to assess the relationship of the distance and the available variables. Log10 of distance was considered.
Abbreviations: LCI, lower bound of the 95% confidence interval of the estimate; ref, reference; Std, Standard Deviation; UCI, upper bound of the 95% confidence interval of the estimate.
Discussion
This study found that the median unidirectional distance traveled among patients enrolled in cancer clinical trials at a single center was approximately 25.8 miles. Importantly, 25% of NIH clinical trial patients were found to travel ≥100 miles each way per clinic visit. In the subset analysis using census data, the distance traveled was highest among patients from low‐income areas or patients enrolled in phase I trials (p < .001 compared with phase II and phase III studies). Given that phase I studies tend to have a higher risk/benefit ratio to other phase groups, these patients likely have fewer options and are therefore willing to travel longer distances. Overall, these data suggest that the burden of travel may be shouldered by the most vulnerable subset of patients with cancer.
Although an estimated 20% of adult cancer patients are thought to be eligible for a clinical trial, less than 5% enroll, the majority being white men [15]. In response to this trend, the U.S. Congress established the NIH Revitalization Act of 1993, which provided guidelines for the inclusion of women and minorities in clinical research [15], [17], [18], [19] and aimed to foster outreach for improved recruitment of underrepresented groups in clinical research [19]. However, despite these and other efforts to promote diversity in clinical research, clinical trials of all types continue to demonstrate the predominant enrollment of a young white male population [15], [16]. A growing body of research reveals that financial support to absorb added out‐of‐pocket expenses associated with travel to clinical trial sites may help reduce disparities in enrollment [4].
In our study, we attempted to measure the travel distance associated with cancer clinical trial participation for patients. Prior studies focused on measuring travel burden as a barrier to receiving standard of care and have suggested that longer travel distance from home to health care center may contribute to reduced use of standard therapeutic treatments [20].
This study is one of the first to measure travel distance for patients in cancer clinical trials using a real‐world GoogleMaps calculator. This analysis is important because it highlights that the expense of time and cost may be significant for patients enrolled in cancer clinical trials. Although many pharmaceutical companies, in industry‐sponsored trials, may attempt to mitigate out‐of‐pocket expenses through rich financial assistance programs, health care payers typically do not cover these added costs; therefore, many patients may face considerable cost to attend each study visit.
This study found that white patients enrolled in cancer clinical trials tended to travel longer distances than non‐white patients. This may, in part, be explained by the demographics of rural California and the widened disparities in non‐white patient participation in clinical trials in rural compared with suburban/urban settings [21]. Additionally, we observed that patients from lower‐income neighborhoods traveled longer distances. Given that cancer clinical trials tend to be clustered in metropolitan areas, it is not surprising that they may be more accessible to affluent populations [22]. However, these data highlight that the most financially vulnerable patients may shoulder the largest burden of cost and travel. It was also observed that the cost of travel significantly increased across the time period; however, this could be due to inflation, as the cost per mile also increased over time.
As a secondary analysis from one tertiary medical center, this study has several limitations. As a single‐site study, results may not be generalizable for all patients with cancer in the U.S. This analysis did not account for topographic changes over time that occurred in the area that may change the estimated distance traveled. This study lacked individual patient demographic and income data and therefore had to extrapolate from zip code‐level census data. Given the income heterogeneity within zip codes in urban landscapes, this may introduce error.
We developed a multivariable model based on available data; however, were not able to address all potential confounders such as age, sex, and marital status due to a lack of access to these data, which is a major limitation of the study. This study examined clinical trial enrollment data from three cancer types—genitourinary, breast, and gastrointestinal—because the clinical trial options were largest for these cancer groups at the cancer center. Therefore, the results may not be valid for patients with tumors that fit in other groups. Furthermore, a bimodal pattern of distance traveled may result when studying distance from the trial center. Although the rural poor may face the greatest disparity, they may be the least likely to enroll, and thus the results may be biased in favor of rural‐dwelling patients who are relatively wealthy, thus skewing results. Additionally, in this analysis, the cost was extrapolated based on distance traveled and did not include other costs associated with travel like hotel, meals, toll roads, and parking; therefore, it may underestimate the total travel costs associated with attending a single cancer clinical trial visit. Lastly, this analysis described the sponsor type but did not have data on whether studies supported any costs related to travel, which may be the case with certain industry‐sponsored trials; therefore, the analysis may suggest a falsely larger burden of cost for a subset of patients.
Additionally, this study only evaluates the distance traveled by patients who actually enrolled in studies and therefore will not reflect the number of individuals who decided not to enroll in clinical trials due to travel or other perceived burdens. To fully address limitations to clinical trial enrollment, future research must integrate data from a control group of all patients seen at a center over a given time or from those who were proposed, but did not enroll in, a clinical trial.
All these limitations are useful in the consideration of future studies to better characterize the burden experienced by patients enrolled in cancer clinical trials compared with patients receiving standard therapy.
Conclusion
Using a single‐center clinical trials enrollment database, this study found that the burden of travel and cost is highest for patients enrolled in NIH‐sponsored trials and phase I studies, as well as for patients living in low‐income areas. These results suggest that a significant proportion of patients enrolled in clinical trials face a substantial travel burden; however, this relationship will need to be explored further. Future work will need to examine the total out‐of‐pocket expenses assumed by patients across multiple academic medical centers to account for regional and geographic variability of trial participation.
See http://www.TheOncologist.com for supplemental material available online.
Author Contributions
Conception/design: Hala T. Borno, Adam Siegel, Charles J. Ryan
Provision of study materials or patients: Hala T. Borno, Emily Chang
Collection and/or assembly of data: Hala T. Borno, Emily Chang
Data analysis and interpretation: Hala T. Borno, Li Zhang
Manuscript writing: Hala T. Borno, Li Zhang, Adam Siegel, Emily Chang, Charles J. Ryan
Final approval of manuscript: Hala T. Borno, Li Zhang, Adam Siegel, Emily Chang, Charles J. Ryan
Disclosures
Li Zhang: Dendreon (C/A). The other authors indicated no financial relationships.
(C/A) Consulting/advisory relationship; (RF) Research funding; (E) Employment; (ET) Expert testimony; (H) Honoraria received; (OI) Ownership interests; (IP) Intellectual property rights/inventor/patent holder; (SAB) Scientific advisory board
References
- 1. Henley SJ, Anderson RN, Thomas CC et al. Invasive cancer incidence, 2004–2013, and deaths, 2006–2015, in nonmetropolitan and metropolitan counties — United States. MMWR Surveill Summ 10.15585/mmwr.ss6614a1. [DOI] [PMC free article] [PubMed] [Google Scholar]
- 2. Rhoads KF, Patel MI, Ma Y et al. How do integrated health care systems address racial and ethnic disparities in colon cancer? J Clin Oncol 2015;33:854–860. [DOI] [PMC free article] [PubMed] [Google Scholar]
- 3. Ford JG, Howerton MW, Lai GY et al. Barriers to recruiting underrepresented populations to cancer clinical trials: A systematic review. Cancer 2008;112:228–242. [DOI] [PubMed] [Google Scholar]
- 4. Nipp RD, Lee H, Powell E et al. Financial burden of cancer clinical trial participation and the impact of a cancer care equity program. The Oncologist 2016;21:467–474. [DOI] [PMC free article] [PubMed] [Google Scholar]
- 5. Symonds RP, Lord K, Mitchell AJ et al. Recruitment of ethnic minorities into cancer clinical trials: Experience from the front lines. Br J Cancer 2012;107:1017–1021. [DOI] [PMC free article] [PubMed] [Google Scholar]
- 6. Yancey AK, Ortega AN, Kumanyika SK. Effective recruitment and retention of minority research participants. Annu Rev Public Health 2006;27:1–28. [DOI] [PubMed] [Google Scholar]
- 7. Nipp RD, Powell E, Chabner B et al. Recognizing the financial burden of cancer patients in clinical trials. The Oncologist 2015;20:572–575. [DOI] [PMC free article] [PubMed] [Google Scholar]
- 8. de Souza JA, Yap BJ, Hlubocky FJ et al. The development of a financial toxicity patient‐reported outcome in cancer: The COST measure. Cancer 2014;120:3245–3253. [DOI] [PubMed] [Google Scholar]
- 9. Probstfield JL, Frye RL. Strategies for recruitment and retention of participants in clinical trials. JAMA 2011;306:1798–1799. [DOI] [PubMed] [Google Scholar]
- 10. Ambroggi M, Biasini C, Del Giovane C et al. Distance as a barrier to cancer diagnosis and treatment: Review of the literature. The Oncologist 2015;20:1378–1385. [DOI] [PMC free article] [PubMed] [Google Scholar]
- 11.IRS . Standard Mileage Rates. Available at https://www.irs.gov/tax-professionals/standard-mileage-rates. Accessed January 25, 2018.
- 12.Population Studies Center. Zip Code Characteristics: Mean and Median Household Income. Available at http://www.psc.isr.umich.edu/dis/census/Features/tract2zip/. Accessed February 18, 2016.
- 13. Dickman SL, Woolhandler S, Bor J et al. Health spending for low‐, middle‐, and high‐income Americans, 1963–2012. Health Aff (Millwood) 2016;35:1189–1196. [DOI] [PubMed] [Google Scholar]
- 14.The R Project for Statistical Computing 2017.
- 15. Murthy VH, Krumholz HM, Gross CP. Participation in cancer clinical trials: Race‐, sex‐, and age‐based disparities. JAMA 2004;291:2720–2726. [DOI] [PubMed] [Google Scholar]
- 16. Hutchins LF, Unger JM, Crowley JJ et al. Underrepresentation of patients 65 years of age or older in cancer‐treatment trials. N Engl J Med 1999;341:2061–2067. [DOI] [PubMed] [Google Scholar]
- 17. Burke NJ. Rethinking the therapeutic misconception: Social justice, patient advocacy, and cancer clinical trial recruitment in the US safety net. BMC Med Ethics 2014;15:68. [DOI] [PMC free article] [PubMed] [Google Scholar]
- 18.NIH Revitalization Act. June 10, 1993, Subtitle B, Part 1.
- 19. Borno H, Siegel A, Ryan C. The problem of representativeness of clinical trial participants: Understanding the role of hidden costs. J Health Serv Res Policy 2016;21:145–146. [DOI] [PubMed] [Google Scholar]
- 20. Lin CC, Bruinooge SS, Kirkwood MK et al. Association between geographic access to cancer care, insurance, and receipt of chemotherapy: Geographic distribution of oncologists and travel distance. J Clin Oncol 2015;33:3177–3185. [DOI] [PMC free article] [PubMed] [Google Scholar]
- 21. Baquet CR, Hammond C, Commiskey P et al. Health disparities research–A model for conducting research on cancer disparities: Characterization and reduction. J Assoc Acad Minor Phys 2002;13:33–40. [PubMed] [Google Scholar]
- 22. Sharrocks K, Spicer J, Camidge DR et al. The impact of socioeconomic status on access to cancer clinical trials. Br J Cancer 2014;111:1684–1687. [DOI] [PMC free article] [PubMed] [Google Scholar]


