Abstract
Genome-wide association studies have been increasingly employed to map and characterize genes that contribute to inter-individual variation in drug response. Some studies have integrated the pharmacokinetic (PK) and pharmacodynamic (PD) processes of drug reactions into association mapping, gleaning new insight into how genes determine the dynamic relationship of drug effect and drug dose. Here, we present an evolutionary framework by which two distinct concepts, chronopharmacodynamics and heterochrony (describing variation in the timing and rate of developmental events), are married to comprehend the pharmacogenetic architecture of drug response. The resulting new concept, heterochronopharmacodynamics (HCPD), can better interpret how genes influence drug efficacy and drug toxicity according to the body’s circadian rhythm and concentration change.
Keywords: pharmacokinetics, pharmacodynamics, functional mapping, heterochrony, heterochronopharmacodynamics
Short Teaser
An evolutionary concept of heterochronopharmacodynamics (HcPD) has been proposed to materialize the utility of chronotherapy. The implementation of HcPD into genetic association studies can gain new insight into pharmacogenetic basis of drug response.
Introduction
Human body’s reaction to drugs varies dramatically from individual to individual. As such, pharmacogenetics and pharmacogenomics that document and catalogue genomic regions in relation to inter-individual variation have been a long-standing focus of studies in pharmacology and medicine [1]. To better reveal the genetic architecture of how drugs affect the body, several studies have integrated the pharmacokinetic (PK) and pharmacodynamic (PD) mechanisms underlying drug metabolism into pharmacogenetic characterization [2–7]. A mounting body of evidence has suggested that circadian rhythm, or biological clock, running over a period of around 24 hours in the human body, plays a pivotal role in mediating drug response through immune function and metabolism [8,9]. The study of how the efficacy of drugs changes according to the body’s circadian rhythm, i.e., chronopharmacodynamics, has emerged as a vital and promising area of personalized medicine or individualized medicine [10–16].
We argue that the role of chronopharmacodynamics in clinical practice can be manifested, substantiated, and strengthened by introducing an evolutionary concept into the pharmacogenetics paradigm. Heterochrony, defined as a dynamic change in the timing or rate of developmental events from individual to individual, can lead to changes and evolution in the form and process of development [17–19]. We marry heterochrony and chronopharmacodynamics to create a new concept, heterochronopharmacodynamics (HcPD). This concept represents several key heterochronic parameters that characterize and portray the PK-PD process of drug response mediated by circadian rhythm. The identification and quantification of these HcPD parameters can gain mechanistic insight into pharmacogenetic variation.
Here, we provide a proof-of-concept for deriving HcPD parameters from rhythmic PK-PD equations and integrating them into pharmacogenetic and pharmacogenomic settings. The HcPD parameters we will focus on here are the timings or drug concentrations of maximum drug efficacy change rate, maximum drug efficacy change acceleration and maximum drug efficacy change deceleration, and the durations or concentration widows of three distinct PK-PD phases, lag, exponential and stationary. The implementation of these HcPD parameters into genetic association studies facilitates the elucidation of the genetic and molecular landscape of how genes govern drug response by modulating key “heterochronic” steps or events.
Heterochronopharmacodynamic model
Although heterochrony was not articulated as a tool for pharmacological research, the impact of this evolutionary concept on drug response can date back to Levy’s [20] work in the 1960s’ where he found a mathematical link between the rate of decline of the pharmacological effect of drugs and their elimination rate. Levy’s discovery has led to the development of pharmacodynamic modeling that quantitatively integrates pharmacokinetics, pharmacological systems, and (patho-) physiological processes [21]. We add circadian rhythms as an additional dimension to the joint PD-PK modeling machinery through heterochrony, in a quest to better understand the strength and time-course of drug effects on the body.
The Hill equation
A number of pharmacodynamic models have been constructed and evaluated to predict pharmacological/toxicological effects from drug exposure. These models have been instrumental for generating new insights and competing hypotheses of biochemical mechanisms that mediate drug responses and providing guidance for subsequent drug discovery, development, and pharmacotherapy. The Hill equation is the simple direct effect model, assuming that drug effects (E) changes directly in proportion to plasma drug concentrations (C) [21], which is mathematically expressed as
| (1) |
where E0 is a baseline effect, Emax is the maximum possible effect, EC50 is the drug concentration producing a half of drug effect between E0 and Emax, and H is the Hill coefficient describing the steepness of the concentration-effect relationship curve.
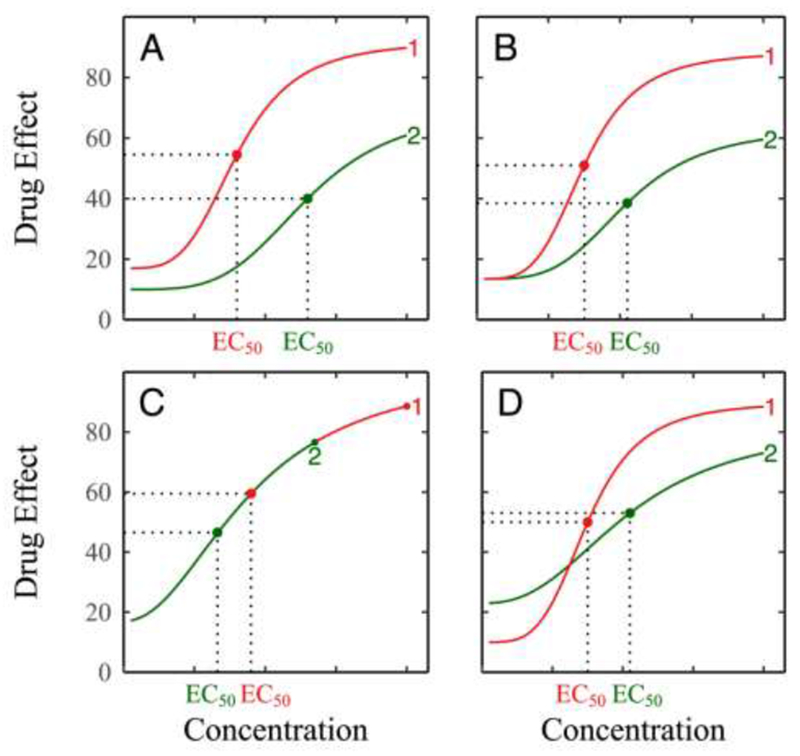
The pattern of how drug effects change with concentration can be visualized by estimating the model parameters (E0, Emax, EC50, H). Inter-individual variability in drug response may be very complex, but it can be roughly explained by the four following types (Fig. 1): (1) high-low variation where one individual has a higher baseline and greater drug effects consistently across a full spectrum of drug concentration than the other, (2) fast-slow variation where one individual has a greater slope of response than the other, although they start from the same baseline, (3) long-short variation in which one individual can adapt to a long spectrum of dose than the other, and (4) reverse variation where drug response curves cross-over between two individuals.
Figure 1.

Types of variation in drug response modulated by heteropharmacodynamics (HPD) parameters. (A) High-low variation where one individual has a greater drug effect than the other during the full spectrum of concentration. (B) Fast-slow variation where one individual responds to drug concentration at a greater rate than the other although they starts from the same baseline. (C) Long-short variation where one individual displays an extended spectrum of drug concentration compared to the other. (D) Reverse variation where one individual with a low baseline surpasses its high-baseline counterpart during changing concentrations.
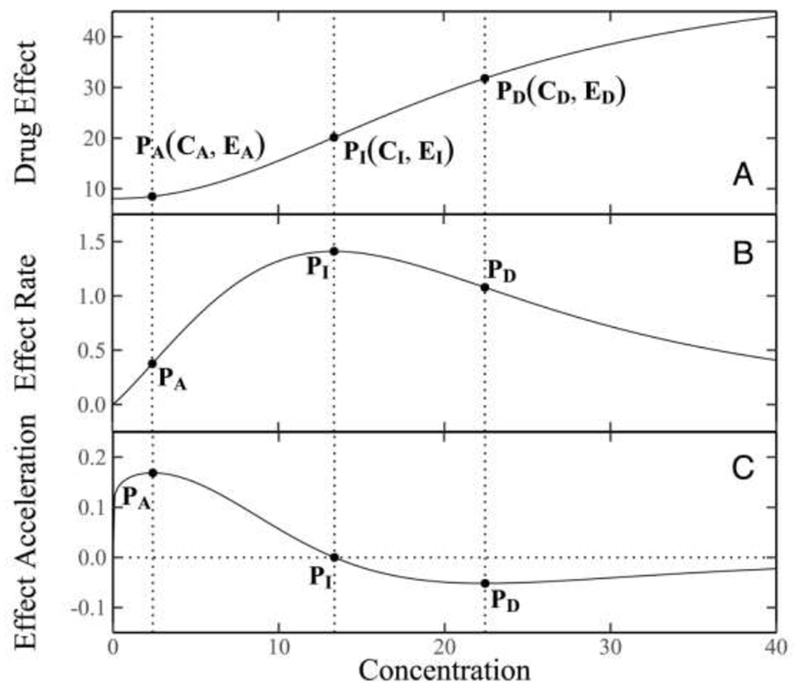
The Hill equation (1), also called the sigmoid Emax model, spans three distinct phases of curves, lag, exponential and stationary or asymptotic (Fig. 2). During the lag phase, drugs after administration are gradually absorbed and distributed within the body, but do not metabolize heavily to function, although the synthesis of RNA, enzymes and other molecules occurs under drug reaction. The exponential phase is a period characterized by the augment of drug metabolism during which drug effects are exponentially proportional to the present drug concentration. The rate of change of drug effects during the exponential phase and the concentration spectrum of this phase directly affect the outcome of drug efficacy or toxicity. At the stationary phase, drug effects approach their maximum value, tending to change little due to the depletion of drugs and the removal of substances from the body.
Figure 2.

Curves of drug response (A), drug response rate (B), and drug response acceleration (C). Three (x,y)-coordinates on the curves, (CA, EA), (CI, EI), and (CD, ED), are shown, presenting the inflection point, the maximum acceleration and maximum deceleration of drug response curve, respectively.
Integrating heterochrony into pharmacodynamic modeling
As discussed above, the three phases drug response experiences display different biochemical properties and, therefore, trigger distinct impacts on final pharmacological response. The distinction of these phases is essential for the design of an optimal drug dose and an optimal time of drug administration. For example, if the exponential phase occurs within a short concentration spectrum, a small dose of drugs may be adequate to achieve their maximum pharmacological effects. If the concentration spectrum of the exponential phase is under genetic control, personalized drug delivery strategies can be made according to patients’ genetic makeups.
The concept of heterochrony can be instrumental for better describing drug response and dissecting it into its lag, exponential and stationary phases. By deriving the first, second, and third derivatives of the Hill equation with respect to concentration, expressed as
| (2a) |
| (2b) |
| (2c) |
Letting the second derivative (2b) equal to zero, we solve the concentration as
| (3) |
which is the inflection point of the Hill curve, representing the concentration of drugs at which the rate of drug effect change reaches a maximum value. Letting the third derivative (2c) equal to zero, we obtain two solutions of the concentration as
| (4a) |
| (4b) |
representing two points at which drug effect changes achieve the maximum acceleration and maximum deceleration, respectively. The difference between these two concentrations,
| (5) |
describes a window of drug concentration during which drug effects change exponentially. In other words, W is the concentration window of drug response’s exponential phase.
We are interested in drug effects at the points where drug response transmits from one phase to the next. Drug effects at CI (at which drug effect reaches its maximum value), CA (at which the exponential phase starts) and CD (at which the exponential phase ends) can be derived as
| (6a) |
| (6b) |
| (6c) |
Equations (3)–(6) describe several key parameters that mechanistically dissect and characterize the pattern of drug response in terms of heterochrony. In summary, these so-called heteropharmacodynamic (HPD) parameters are (1) the (x,y)-coordinates of the inflection point of the Hill curve (CI, EI), (2) the (x,y)-coordinates of drug response acceleration curve (CA, EA), (3) the (x,y)-coordinates of drug response deceleration curve (CD, ED), (4) the concentration spectrum of the exponential phase of drug response (CD − CA), (5) the concentration associated with 1/2Emax (EC50), (6) the maximum drug effect at high concentrations (Emax), and (7) the slope of drug response (H). The estimation of the HPD parameters can be made by fitting the Hill equation (1) to concentration-dependent drug effect data and substituting the estimated curve parameters into equations (3)–(6).
Mapping HPD QTLs
Given that the pharmacological response of drugs has a genetic component, the characterization of whether QTLs determine HPD parameters can provide mechanistic insight into the pharmacologenetic architecture of drug response. A number of competing hypotheses regarding pharmacologenetic mechanisms are formulated and tested. Specifically, the following questions can be addressed: (1) how do genes control the timing at which drugs trigger a maximum efficacy? (2) how do genes mediate the time duration or concentration spectrum of maximum pharmacological effect? (3) whether are there any genes that turn on or turn off the body’s response to drugs? If there are such genes, where are they and how do they act and interact? (4) how do HPD-related genes alter their expression with life style, demographic factor, or developmental cue? (5) how do genes control differently three phases of PK-PD processes, lag, exponential and stationary?
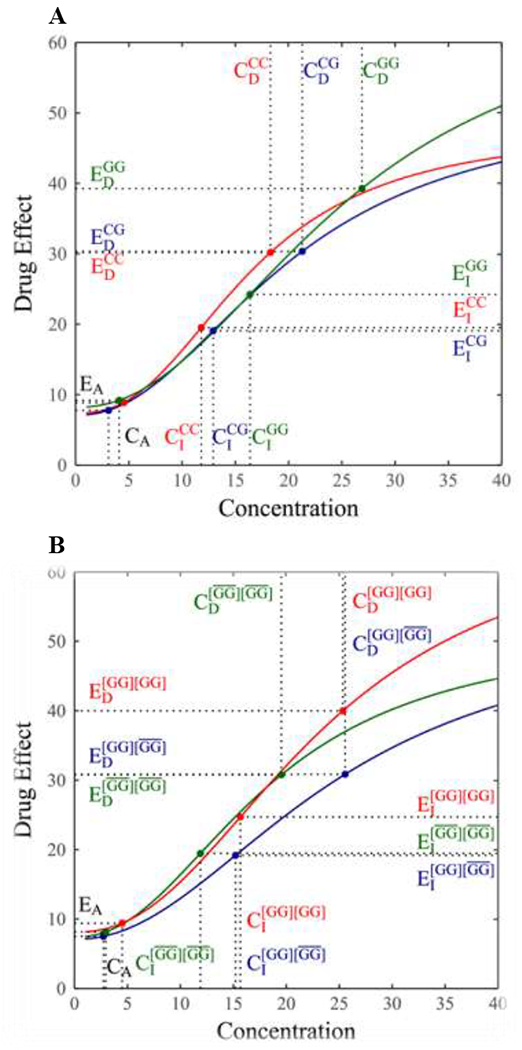
In a pharmacologenetic study of cardiovascular disease, Lin et al. developed a likelihood approach to fit the Hill equation for different genotype groups at each SNP and identified a significant SNP at codon 27 (Gln27Glu) within the β2AR gene associated with heart rate response curves in a range of dobutamine doses [2]. A bivariate ANOVA approach was implemented to test how this SNP affects (x,y)-coordinates of (CI, EI), (CA, EA), and (CD, ED) derived from the Hill equation. It was detected to be significantly associated with (CI, EI) (P = 0.023) and (CD, ED) (P = 0.028). Thus, this SNP is regarded as an HPD QTL. From the curves of heart rate change over different doses of dobutamine for three genotypes at this QTL (Fig. 3A), one can visually investigate how it governs drug response through its mediation on HPD parameters. A univariate ANONA was used to analyze and test the association between this SNP and single HPD parameters, Emax, EC50, H, or W. It was found to exert a significant impact on the slope of drug response curve (P = 0.047). As shown in Fig. 3A, the slope of heart rate response curve varies remarkably among three genotypes at this QTL. A delayed occurrence of maximal drug effect change rate (i.e., a large CI) makes genotype GG outmatch the other two genotypes in asymptote Emax.
Figure 3.

Genotypic differences in the curve of heart rate response to dobutamine at a QTL. (A) The QTL detected is a single SNP at codon 27 within the β2AR gene. (B) The QTL detected represents haplotype variants composed of two SNPs at codon 16 and 27 within the β2AR gene. Haplotype GG is a key determinant, whose combinations with the rest three haplotypes (collectively expressed by bars) form three composite diplotypes [2]. Genotypic differences in several key heteropharmacodynamic parameters are shown.
Lin et al. [2] developed a mixture model-based approach to detect the association of drug response with haplotype, a linear arrangement of DNA nucleotides on the same chromosome. By selecting the most likely haplotype that is most distinguishable from the rest, this approach can test how different nucleotides govern drug effects through their varying sequences on chromosomes. We implemented Lin et al.’s haplotyping approach to identify haplotype variants associated with HCPD parameters. Of four possible haplotypes over two SNPs at 16 (Argl6Gly) and 27 (Gln27Glu) within the β2AR gene, haplotype GG was detected to be a genetic determinant of heart rate response to dobutamine. For example, it affects (x,y)-coordinates of (CI, EI) and (CD, ED), and also maximum response value Emax. Using the Hill coefficients estimated, response curves of heart rates were drawn for three composite diplotypes constructed from different combinations of haplotype GG and the rest three haplotypes as a whole (Fig. 3B), from which we can visualize how haplotype variants contribute to overall response-dose curves through the mediation of HPD variation.
Heterochronopharmacodynamic dissection
The HPD concept is relevant for the determination of an optimal dose to achieve maximum efficacy and minimum toxicity. Since pharmacodynamic processes are rhythmically moderated by the circadian timing system over 24-hour day and night cycles [9], an optimal delivery schedule may exist for the best therapy. Circadian timing, constituted of a network of genetic cellular circadian clocks, determines how a drug is absorbed, distributed, metabolized, and eliminated in the body and how this process causes pharmacological effects. One way for tailoring circadian drug delivery to individual circadian timing systems for optimizing treatment effects is the synthesis of HPD and its molecular clock control. This forms a new concept, heterochronopharmacodynamics (HcPD).
A chronopharmacodynamic equation can be manifested by a Hill equation, modulated in amplitude by a circadian chronosensitivity factor [22]. It is mathematically expressed as
| (7) |
where t is the time of drug reaction after administration, C, Emax, EC50, and H are defined as above, T = 24 h is the period of circadian drug sensitivity oscillations, and φ is the phase of the maximum activity of E(C, t), in hours with reference to a fundamental 24-hour rhythm.
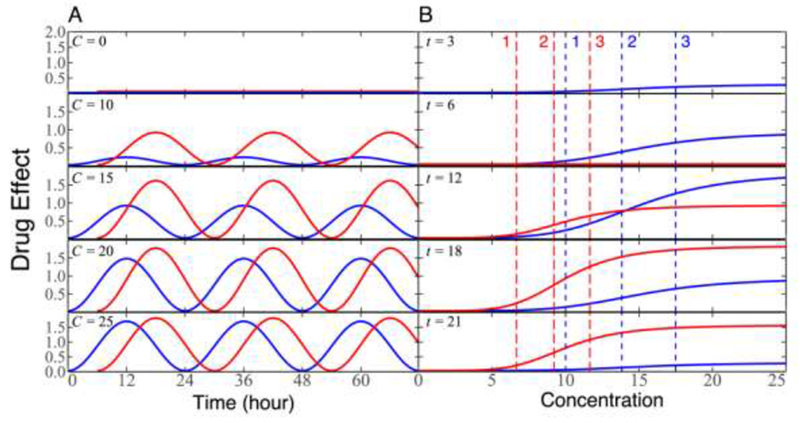
Consider a patient who is administered by the same drug at two different times, midnight (time 1) and 6 am (time 2). At both dosing times, drug effect changes over time in a 24-hour periodicity under a given concentration, although the pattern of this change depends on doing time. The dosing time at 6 am produces a higher drug effect under a low concentration than does the dosing time at midnight, whereas the drug effect of the dosing time at midnight is more responsible to drug concentration than that at 6 am (Fig. 4A). At a given time after administration, drug response follows an S-shaped curve, with the pattern varying between dosing times. Because of different periods of rhythmic change, dosing time at midnight generates a great drug response than that dosing time at 6 am at one time after administration (e.g., t = 12), whereas the inverse pattern was observed at the other time (e.g., t = 18) (Fig. 4B). Taken together, this hypothesized example suggests that different dosing times produce different drug effects through circadian timing systems, which is determined by HcPD.
Figure 4.

The diagrammatic representation of heterochronopharmacodynamics for the same patient administered by a drug at two dosing times, midnight (blue curve) and 6 am (red curve). (A) Drug effect changes as a function of time after administration at different concentrations. (B) Drug effect changes as a function of concentration at different times. Vertical slash lines present the timing of drug response acceleration (1), the timing of drug response inflection point (2), and the timing of drug response deceleration (3). Blue lines and red lines correspond to dosing times at midnight and 6 am, respectively.
HcPD can be described by several key parameters, including HPD parameters at different times after administration and amplitudes and phases of rhythmic drug response curves at different concentration levels. A great interpersonal variability in circadian timing system implicates the existence of QTLs for HcPD. By viewing each HcPD parameter as a phenotype, statistical models can be implemented to map HcPD QTLs throughout the genome.
Concluding remarks
Increasing studies in animals have shown that the pharmacokinetics and pharmacodynamics of drug reactions in the body vary according to the time of drug administration [12,23,24]. This time-dependent variation originates from the circadian rhythm of the body, controlled by an inherent molecular clock network [8,9]. Because of this rhythmic phenomenon, a therapeutic strategy, named chronotherapy, has been proposed, where treatments are performed at empirically selected times in a hope to maximize drug efficacy and minimize drug toxicity. The fundamental principle of chronotherapy lies in stage-varying functionality of intrinsic circadian clocks.
However, although chronotherapy has emerged as a potential clinical strategy, its application depends on our understanding of how circadian rhythms vary in the human population. It has well been recognized that circadian times differ from individual to individual, implying the essentiality of chronotherapeutic schedules to be individualized. As new pharmacological concepts, chronopharmacokinetics or chronopharmacodynamics have been regarded as important tools to characterize the biochemical mechanisms of drug response [23,24]. These concepts can find their maximum utility when they are married with an evolutionary concept, heterchronony. Heterochrony defines how the timing or rate of developmental events determine the overall shape of developmental trajectories.
In this article, we have for the first time established a synthetic framework of chronopharmacodynamics and heterochrony to study the timing and drug concentration window that determine the outcome of drug response. The resulting concept, heterochronopharmacodynamics (HcPD), is further integrated with pharmacogenetic or pharmacogenomic studies to map and estimate specific DNA variants (QTLs) responsible for drug response. Beyond traditional pharmacogenetic studies of the overall relationship between genes and drug response, the HcPD-grounded evolutionary model is armed with a capacity to address fundamental questions regarding the genetic mechanisms of pharmacological processes guided by evolutionary theory.
A profound understanding of when a patient is more responsive to drugs and which dose window critically affect his/her pharmacological outcome can help tailor drug treatment through specific prescription to individual patients. This endeavor can be more effective if we incorporate genomic data into the genetic model. For example, by using gene, protein or epigenetic profiles expressed following a circadian rhythm as biomarkers, the HcPD-based model can enhance its predictive power, scope, and precision. Thus, we do not only determine an optimal dose of drugs for different patients based on their genetic blueprints, but also administer phase-dependent doses (higher level used for exponential phase but lower level used for lag and stationary phases) for the same patient to maximize the therapeutic efficacy of drugs and minimize their damage to surrounding healthy cells.
Highlight.
Incorporating pharmacokinetics-pharmacodynamics facilitates pharmacogenomics.
The marriage of circadian rhythms captures the right time of drug injection.
Chronotherapy aims to maximize drug efficiency and minimize drug toxicity.
A new evolutionary concept makes chronotherapy more efficacious and established.
Acknowledgements
We thank Prof. Julie Johnson at the University of Florida for supplying her data to validate our theory. This work is supported by Fundamental Research Funds for the Central Universities (2017JC05), the “one-thousand person” plan, grant U01 HL119178, and grant NICHD 5R01HD086911-02.
Footnotes
Publisher's Disclaimer: This is a PDF file of an unedited manuscript that has been accepted for publication. As a service to our customers we are providing this early version of the manuscript. The manuscript will undergo copyediting, typesetting, and review of the resulting proof before it is published in its final citable form. Please note that during the production process errors may be discovered which could affect the content, and all legal disclaimers that apply to the journal pertain.
We claimed no CONFLICTS OF INTEREST.
References
- [1].Gonzalez-Covarrubias V et al. (2017) Pharmacogenetic variation in over 100 genes in patients receiving acenocumarol. Front. Pharmacol 8, 863. [DOI] [PMC free article] [PubMed] [Google Scholar]
- [2].Lin M, et al. (2005) Sequencing drug response with HapMap. Pharmacogenomics J 5, 149–156. [DOI] [PubMed] [Google Scholar]
- [3].Ahn K et al. (2010) Functional mapping of drug response with pharmacodynamic-pharmcokinetic principles. Trends Pharmacol. Sci 31, 306–311. [DOI] [PubMed] [Google Scholar]
- [4].Mustavich LF et al. (2010) Using a pharmacokinetic model to relate an individual’s susceptibility to alcohol dependence to genotypes. Hum. Hered 70, 177–193. [DOI] [PMC free article] [PubMed] [Google Scholar]
- [5].Wu RL et al. (2011) A conceptual framework for integrating pharmacodynamic principles into genome-wide association studies for pharmacogenomics. Drug Discov. Today 16, 884–890. [DOI] [PMC free article] [PubMed] [Google Scholar]
- [6].Wang YQ et al. (2013) Delivering systems pharmacogenomics towards precision medicine through mathematics. Adv. Drug Deliv. Rev 65, 905–911. [DOI] [PMC free article] [PubMed] [Google Scholar]
- [7].Wang YQ et al. (2015) Pharmacodynamic genome-wide association study identifies new response loci for glucocorticoid intervention in asthma. Pharmacogenomics J 15, 422–429. [DOI] [PMC free article] [PubMed] [Google Scholar]
- [8].Panda S (2016) Circadian physiology of metabolism. Science 354, 1008–1015. [DOI] [PMC free article] [PubMed] [Google Scholar]
- [9].Kuhlman SJ et al. (2017) Biological rhythms workshop I: introduction to chronobiology. Cold Spring Harb. Symp. Quant. Biol 72, 1–6. [DOI] [PubMed] [Google Scholar]
- [10].Lemmer B (2007) Chronobiology, drug-delivery, and chronotherapeutics. Adv. Drug Deliv. Rev 59, 825–827. [DOI] [PubMed] [Google Scholar]
- [11].Smolensky MH et al. (2015) Bedtime hypertension chronotherapy: concepts and patient outcomes. Curr. Pharm. Des 21, 773–790. [DOI] [PubMed] [Google Scholar]
- [12].Dallmann R et al. (2016) Dosing-time makes the poison: Circadian regulation and pharmacotherapy. Trends Mol. Med 22, 430–445. [DOI] [PubMed] [Google Scholar]
- [13].Kaur G et al. (2016) Chronotherapy in practice: the perspective of the community pharmacist. Intl. J. Clin. Pharm 38, 171–182. [DOI] [PubMed] [Google Scholar]
- [14].Ballesta A et al. (2017) Systems chronotherapeutics. Pharmacolog Rev 69, 161–199. [DOI] [PMC free article] [PubMed] [Google Scholar]
- [15].Kiessling S and Cermakian N (2017) The tumor circadian clock: a new target for cancer therapy? Future Oncology 13, 29. [DOI] [PubMed] [Google Scholar]
- [16].Cutolo M (2016). Glucocorticoids and chronotherapy in rheumatoid arthritis. RMD Open 2, e000203. [DOI] [PMC free article] [PubMed] [Google Scholar]
- [17].Keyte AL and Smith KK (2014) Heterochrony and developmental timing mechanisms: Changing ontogenies in evolution. Sem. Cell Develop. Biol 34, 99–107. [DOI] [PMC free article] [PubMed] [Google Scholar]
- [18].Sun LD et al. (2014) A model framework for identifying genes that guide the evolution of heterochrony. Mol. Biol. Evol 31, 2238–2247. [DOI] [PubMed] [Google Scholar]
- [19].Sun LD et al. (2017) The genetic architecture of heterochrony: Lessons from a computational model. Brief. Bioinform, doi: 10.1093/bib/bbx056. [DOI] [PubMed] [Google Scholar]
- [20].Levy G (1964) Relationship between elimination rate of drugs and rate of decline of their pharmacologic effects. J. Pharm. Sci 53, 342–343. [DOI] [PubMed] [Google Scholar]
- [21].Felmlee MA et al. (2012) Mechanism-based pharmacodynamic modeling. Methods Mol. Biol 929, 583–600. [DOI] [PMC free article] [PubMed] [Google Scholar]
- [22].Clairambault J (2007) Modelling oxaliplatin drug delivery to circadian rhythm in drug metabolism and host tolerance. Adv. Drug Deliv. Rev 59, 1054–1068. [DOI] [PubMed] [Google Scholar]
- [23].Zhang C et al. (2014) Chronopharmacodynamics and chronopharmacokinetics of pethidine in mice. PLoS ONE 9(7), el02054. [DOI] [PMC free article] [PubMed] [Google Scholar]
- [24].Zhang Y et al. (2017) Dosing time dependent in vitro pharmacodynamics of Everolimus despite a defective circadian clock. Cell Cycle 17, 33–42. [DOI] [PMC free article] [PubMed] [Google Scholar]


