

Abstract
Controlling gene expression during a bioprocess enables real‐time metabolic control, coordinated cellular responses, and staging order‐of‐operations. Achieving this with small molecule inducers is impractical at scale and dynamic circuits are difficult to design. Here, we show that the same set of sensors can be integrated by different combinatorial logic circuits to vary when genes are turned on and off during growth. Three Escherichia coli sensors that respond to the consumption of feedstock (glucose), dissolved oxygen, and by‐product accumulation (acetate) are constructed and optimized. By integrating these sensors, logic circuits implement temporal control over an 18‐h period. The circuit outputs are used to regulate endogenous enzymes at the transcriptional and post‐translational level using CRISPRi and targeted proteolysis, respectively. As a demonstration, two circuits are designed to control acetate production by matching their dynamics to when endogenous genes are expressed (pta or poxB) and respond by turning off the corresponding gene. This work demonstrates how simple circuits can be implemented to enable customizable dynamic gene regulation.
Keywords: control theory, feedback, metabolic engineering, synthetic biology
Subject Categories: Methods & Resources, Synthetic Biology & Biotechnology
Introduction
Genetic modifications made to an organism to optimize the production of a chemical or biologic are typically static (Holtz & Keasling, 2010; Brockman & Prather, 2015b). For example, knocking out a gene to redirect metabolic flux implements its impact permanently and continuously (Schellenberger et al, 2011). Similarly, introduced pathways are often under unchanging constitutive control (Zhang et al, 2002; Burgard et al, 2003; Price et al, 2004; Schellenberger et al, 2011; Morse & Alper, 2016; Deparis et al, 2017). While these changes are required to make the product and optimize yield, they can have a detrimental effect when activated at the wrong time, such as early in growth when resources need to be dedicated to building biomass (San & Stephanopoulos, 1984; Park et al, 2007; Michener et al, 2012; Brockman & Prather, 2015a; Ceroni et al, 2016). Static functions contrast with natural cellular systems that continuously monitor environmental conditions and respond by adjusting gene expression as needed (Shen‐Orr et al, 2002; Zaslaver et al, 2004; Cho et al, 2014). Implementing flexible synthetic versions of this regulation would be valuable in engineering projects. For instance, product yields could be optimized by re‐balancing enzyme expression to respond to growth phase, the buildup of precursor metabolites, or feedstock concentration (Farmer & Liao, 2000; Liu et al, 2015; Zhang et al, 2015; Morse & Alper, 2016). Additionally, less external intervention would be required if cells could be pre‐programmed to undergo a series of steps during a bioprocess or respond as autonomous agents to bioreactor‐borne stresses.
Dynamic gene expression has begun to be implemented in academic metabolic engineering projects (Liu et al, 2016; Qian & Cirino, 2016; Min et al, 2017; Liu & Zhang, 2018; Zhou et al, 2018). These projects depend on genetically encoded sensors that respond to external environmental signals (O2, temperature, pH), the internal cell state (metabolites, growth phase, stress response, redox), the depletion of carbon feedstock (glucose), cell density, or the accumulation of products and by‐products (acetate) (Farmer & Liao, 2000; Bayly et al, 2002; March & Bentley, 2004; Boccazzi et al, 2006; Nevoigt et al, 2007; Kang et al, 2008; Tsao et al, 2010; Liang et al, 2011; Michener et al, 2012; Zhang et al, 2012; Anesiadis et al, 2013; Siedler et al, 2014; Afroz et al, 2015; Liu & Lu, 2015; Soma & Hanai, 2015; Xie et al, 2015; Guan et al, 2016; Immethun et al, 2016; Lo et al, 2016; Qian & Cirino, 2016; Rajkumar et al, 2016; preprint: Borkowski et al, 2017; Bothfeld et al, 2017; Gupta et al, 2017; He et al, 2017; Juarez et al, 2017; Klamt et al, 2017; Pham et al, 2017; Kasey et al, 2018). The information transmitted by these sensors can be used to implement feedback control or switch the carbon flux through alternative pathways at the opportune time (Xu et al, 2014; Brockman & Prather, 2015b; Liu et al, 2015; Ceroni et al, 2016). For many products, this approach has been shown to increase yields by maintaining a toxic intermediate below a critical level or separating growth and production phases (Farmer & Liao, 2000; Michener et al, 2012; Zhang et al, 2012, 2015; Xu et al, 2014; Brockman & Prather, 2015b; Liu et al, 2015; Soma & Hanai, 2015; Xie et al, 2015; Ceroni et al, 2016; Morse & Alper, 2016).
Several strategies can be taken to build such sensors. The ideal sensors consist of a regulator that directly binds to a known signal, such as the metabolite, and then strongly regulates the activity of a promoter (Tang & Cirino, 2011; Zhang et al, 2012; Rogers et al, 2015; Albanesi & de Mendoza, 2016; Libis et al, 2016; Morgan et al, 2016; Rogers & Church, 2016). When a sensor for a specific metabolite is unavailable, native promoters that respond to a given stimulus have also been co‐opted as sensors (Dahl et al, 2013; Yuan & Ching, 2015). However, many native promoters integrate multiple signals, making them respond to alternative or unknown stimuli (Kang et al, 2008; Dahl et al, 2013; Boyarskiy et al, 2016; Rajkumar et al, 2016; preprint: Borkowski et al, 2017; Hoynes‐O'Connor et al, 2017; Kasey et al, 2018; Siu et al, 2018). One approach to address this is to put the operators for a transcription factor into the “clean” background of a constitutive promoter (Cox et al, 2007).
A sensor can be genetically modified to change the threshold of signal required to activate it. For example, increasing the expression level of the regulator can make the sensor turn on earlier and mutations can tune the binding constant to the ligand (Nevoigt et al, 2007; Moser et al, 2013; Afroz et al, 2015; Feher et al, 2015; Wang et al, 2015; Gupta et al, 2017; Mannan et al, 2017; Landry et al, 2018). However, an individual sensor can only implement a switch at a one defined cell state and cannot be used to drive a series of events (Wang et al, 2015; Gupta et al, 2017). An alternative approach to modifying the sensors is to select a set of sensors that turn on at different times during a bioprocess and then use a genetic circuit that responds to a pattern of sensor activities to turn on at a defined point. During a bioprocess, many conditions change dynamically inside the reactor and inside of individual cells. Therefore, the same set of sensors can be integrated in different ways to generate different dynamic responses.
There is precedent for using genetic circuits to alter a sensor's response (Karig & Weiss, 2005; Slusarczyk et al, 2012; Brophy & Voigt, 2014; Hoynes‐O'Connor & Moon, 2015). Connecting a sensor to a circuit is simplified when both are transcriptional; that is, when the output of the sensor is a promoter and the inputs/outputs of a circuit are promoters. Circuits have been used to integrate multiple sensors, change their threshold, amplify the response, convert a transient input to a permanent response, and toggle between outputs (Chen & Bailey, 1994; Kobayashi et al, 2004; Bennett et al, 2008; Moon et al, 2011; Wang et al, 2011; Moser et al, 2012; Solomon et al, 2012; Soma et al, 2014; Soma & Hanai, 2015; Rantasalo et al, 2016; preprint: Borkowski et al, 2017; Bothfeld et al, 2017; He et al, 2017; Ryo et al, 2017; Kasey et al, 2018).
One way to respond to a pattern of sensor activities is to use genetic circuits that implement logic operations. Combinatorial logic is defined as a relationship in steady state in which the circuit outputs are a function of only the inputs. While circuits themselves do not implement dynamics, when the inputs (sensors) are changing over time, the output of the circuit will also change. Integrating more sensors makes the response more specific to a set of conditions or period of time during growth (Immethun et al, 2016; He et al, 2017). Larger logic gates can simultaneously integrate many sensors and control multiple output promoters, each turning on in response to a different pattern of sensor activities (Callura et al, 2012; Moon et al, 2012; Guan et al, 2016; Nielsen et al, 2016; Green et al, 2017).
There are a number of genetic tools to connect the output promoters of a circuit to the control of endogenous or recombinant genes. The output promoter could be used to directly express enzymes (Temme et al, 2012; Immethun et al, 2016) or orthogonal RNA polymerases that transcribe multi‐gene pathways (Temme et al, 2012; Segall‐Shapiro et al, 2014; Bonde et al, 2015; Song et al, 2017; Harder et al, 2018). The output promoter can also be used to turn genes off using CRISPRi or sRNA/RNAi (Drinnenberg et al, 2009; Qi et al, 2013). These methods have been used to optimize titers by knocking down enzymes of central metabolism at an opportune time or to redirect flux through a heterologous pathway (Callura et al, 2012; Solomon et al, 2012; Anesiadis et al, 2013; Na et al, 2013; Oyarzun & Stan, 2013; Soma et al, 2014; Brockman & Prather, 2015a; Lv et al, 2015; Wu et al, 2015; Zalatan et al, 2015; Deaner & Alper, 2017; Harder et al, 2018; Kasey et al, 2018). Proteases have also been developed that target a tag that can be added to an enzyme, though this requires modification of the target enzyme (Cameron & Collins, 2014). The ability to degrade the enzyme pool is critical for rapidly eliminating its activity, particularly when the growth rate is low and proteins are only slowly diluted (Soma et al, 2014; Brockman & Prather, 2015a).
In this manuscript, we develop three sensors that respond to generic signals that change over the course of bioproduction and are agnostic to a particular product pathway. Oxygen and glucose sensors are constructed by placing FNR/CRP operators into a constitutive promoter and optimizing for dynamic range using oligonucleotide arrays (Kosuri et al, 2010) and fluorescence‐assisted cell sorting (FACS). A third sensor that responds to acetate was selected from the literature (Bulter et al, 2004) and modified to improve its response. Each of these signals responds at a different time during growth: The low oxygen sensor turns on first, followed by the turning off of the glucose sensor, and finally the acetate sensor turns on. Simulations of many genetic circuits implementing these sensors’ signals into different logic operations show that diverse responses are possible. From these, we select several based on layered AND and ANDN gates, construct them, and verify their temporal response. As a proof‐of‐principle, we design two genetic circuits to respond during periods of endogenous poxB and pta expression, respectively, as determined using RNA‐seq. The circuit controlling poxB is turned on during the transition to stationary phase, and the circuit controlling pta is turned on early in growth. When the circuits are on, they repress the native genes using a combination of CRISPRi and proteases. The resulting circuits are able to control the appropriate genes at early and late stages of growth, thus reducing acetate accumulation. This demonstrates how different configurations of sensors and gates can be used to generate responses at different times and thereby control carbon flux through endogenous metabolism.
Results
Design of glucose, oxygen, and acetate sensors
The simultaneous use of multiple sensors requires that they respond to independent stimuli and do not interfere with each other's response. Further, they require a large dynamic range to facilitate their connection to circuits. For oxygen and glucose, we and others have built sensors based on native promoters and heterologous transcription factors (Anderson et al, 2007; Garcia et al, 2009; Immethun et al, 2016). However, we were concerned that these would either respond to additional unwanted cellular signals or that their reported dynamic ranges were insufficient. Initially, a number of natural Escherichia coli promoters were gleaned from the literature and tested, but their dynamic range proved to be too low (Appendix Fig S1). Therefore, synthetic promoters were designed to respond only to select regulatory proteins and screened variations to identify those that produced a large dynamic range.
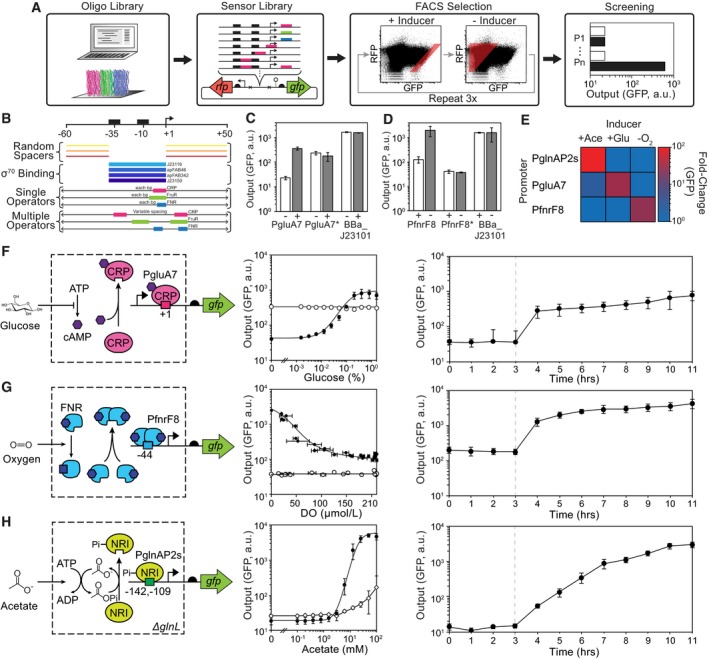
The approach to build the glucose and oxygen sensors utilizes a previously published method to generate large libraries of constitutive promoters (Kosuri et al, 2013). A library of 11,964 synthetic promoters was computationally designed by varying the promoter backbone and the placement of operators for E. coli transcription factors that respond to each signal (Fig 1A). First, twelve constitutive promoter variations were generated, each made up of one of four σ70‐associated promoter sequences (−35 to +1) and one of three randomly generated spacer sequences for the −60 to −35 and +1 to +50 (Fig 1B). Within these sequences, the operators for the glucose‐ and oxygen‐sensing transcription factors were placed at all possible locations (Cox et al, 2007; Stanton et al, 2014b). For glucose, the operators bind to either the global regulators cAMP receptor protein (CRP; Lawson et al, 2004) or FruR (Kochanowski et al, 2013), although no promoters with the latter operator ultimately emerged from the screen. For oxygen, the operator is for the fumarate and nitrate reductase (FNR) transcriptional activator, which is directly modified by oxygen via a Fe‐S cluster (Constantinidou et al, 2006). The full set of promoters was synthesized using a CustomArray oligo array and cloned into a reporter plasmid (p15A origin) upstream of green fluorescent protein (gfp). Constitutive expression of a red fluorescent protein (rfp) enabled us to correct for variation in copy number of the plasmid (Materials and Methods). RiboJ was included upstream of gfp in order to insulate against genetic context effects that occur when it is transcribed from different promoters (Lou et al, 2012).
Figure 1. Design and optimization of glucose, acetate, and oxygen sensors.
-
AScheme for sensor design including (left to right): computational design and DNA chip oligo library synthesis, insertion into a plasmid reporter, FACS enrichment, and screening of select mutants in the presence (black) and absence (white) of stimulus. All three sensors were synthesized on a single chip (indicated by the colors).
-
BDesign of the promoter library. The location, number, and name of promoter elements are shown. The permutations included different constitutive core promoters (blue) flanked by random spacers (orange). Single operators (colored bars) were varied across the ranges shown with single nucleotide resolution. When two operators were included, they were inserted at multiple sites and the distance between them was varied by up to 6 bp from each site.
-
CShown are the responses of the glucose sensor promoter (PgluA7), a negative control lacking the CRP operator (PgluA7*), and a constitutive promoter (BBa_J23101) to the presence (+) and absence (−) of glucose.
-
DShown are the responses of the oxygen sensor promoter (PfnrF8), a negative control lacking the FNR operator (PfnrF8*), and a constitutive promoter (BBa_J23101) to the presence (+) and absence (−) of oxygen.
-
EThe orthogonality of the sensors is shown. The averages and standard deviations for these data are provided in Appendix Fig S5.
-
F–HShown are the schematics and responses for the glucose, oxygen, and acetate sensors, respectively. The response functions (center) are shown for each sensor (black circles) compared to promoter variants where the operators are removed (PgluA7*, PfnrF8*; open circles). Horizontal error bars in the PfnrF8 response reflect one standard deviation of three dissolved oxygen (DO) measurements. For the acetate sensor, the response of the sensor is shown in unmodified Escherichia coli MG1655 with glnL intact (open diamonds). The dynamics of induction are shown (right graph) where cells are induced at the time indicated by the dashed line (see text). Representative cytometry florescence distributions for Fig 1F–H are shown in Appendix Fig S2.
The promoter library was then transformed into E. coli MG1655, and FACS sorting was used to screen for activity. For the glucose sensor, cells were grown in the presence of 0.4% glucose and then sorted using a threshold for high GFP:RFP fluorescence (Fig 1A). The recovered variants were then grown in the absence of glucose and re‐sorted, this time recovering cells below a threshold GFP:RFP fluorescence. This was repeated for three cycles, after which 95 promoter variants were recovered and tested for their on/off response. The same approach was applied to identify oxygen sensors, where the three FACS cycles were performed by iterating between aerobic and anaerobic growth (Materials and Methods). The top glucose‐ and oxygen‐responsive promoters to emerge from these screens were PgluA7 and PfnrF8, respectively. Their responses were compared to native promoters and the strong constitutive promoter BBa_J23101 (Fig 1C and D; 2016; Kelly et al, 2009). The replacement of each sensor's operator with a random sequence eliminated its response (Fig 1C and D). The promoters only respond to their corresponding signal (Fig 1E).
To characterize the promoters as sensors, their response was measured as a function of inducer concentration under conditions that approximate steady state (Materials and Methods). The best glucose sensor (PgluA7) shows a maximum 18‐fold dynamic range and achieves half‐maximum induction at 0.1% glucose (Fig 1F). The best oxygen sensor (PfnrF8) produces a 25‐fold induction and achieves its half‐maximum output at a dissolved oxygen (DO) concentration of 36 μmol/l (Fig 1G). For both promoters, the transition between the off and on states occurs uniformly throughout the population of cells (Appendix Fig S2). The responses of both the glucose and oxygen promoters are rapid, achieving 8‐fold and 7‐fold activation, respectively, after 1 h (Fig 1F and G, and Appendix Fig S3).
For the acetate sensor, we tested one previously designed by Liao and co‐workers based on the PglnAP2 promoter, which responds to phosphorylated NtrC (glnG) in a glnL knockout stain (Fig 1H; Bulter et al, 2004). In our hands, this promoter produces a 16‐fold induction in E. coli MG1655, but requires knocking out the receptor NtrB (ΔglnL; Materials and Methods), which limits its use to strains in which this gene is deleted or repressed. We found that truncating the promoter at the +1 start site (PglnAP2s) improved the dynamic range to 250‐fold by reducing the leakiness of the off state (Fig 1H). The half‐maximum response occurs at 13.8 mM acetate, and the response to intermediate concentrations is bimodal (Appendix Fig S2). In addition, the response is slower than the other two sensors. It should be noted that the response is sensitive to the pH of the media and changes when other genes are knocked out (Appendix Fig S4; Bulter et al, 2004). Because ΔglnL knockout mutation interferes with the nitrogen starvation response, we used a nitrogen‐rich media and did not observe any growth defects due to this mutation (Appendix Table S1).
The three sensors (PfnrF8, PgluA7, PglnAPs) were tested for orthogonality to each other's signals (low oxygen, glucose, acetate; Fig 1E). The three sensors are activated by their cognate stimuli, with minimal measurable cross‐reactivity between the acetate and glucose sensors (Appendix Fig S5). Thus, they can all be used together within one circuit, although some care needs to be taken to avoid crosstalk.
The three sensors were then evaluated in shake flask experiments where cells were seeded into a defined glucose‐based media common in industry (Moser et al, 2012) and grown for over 24 h (Materials and Methods). For these experiments, GFP was fused to a degradation tag to better measure off‐times (McGinness et al, 2006). Glucose, dissolved oxygen (DO), and acetate were monitored throughout growth by offline liquid chromatography and an oxygen sensor probe (Materials and Methods). Glucose and DO decrease over time due to cell growth and metabolism (Fig 2A and B, Appendix Fig S6). The inoculum culture is first grown without glucose, but when cells are added to glucose‐containing media (t = 0 h), the glucose sensor rapidly turns on and remains on until glucose is consumed after 15 h (Fig 2A). The DO sensor turns on to the absence of oxygen, which is consumed during growth, causing the sensor to turn on after 8 h (Fig 2B). Acetate accumulates late in growth and the sensor turns on when the acetate concentration passes the 15 mM threshold after 14 h (Fig 2C and Appendix Fig S7).
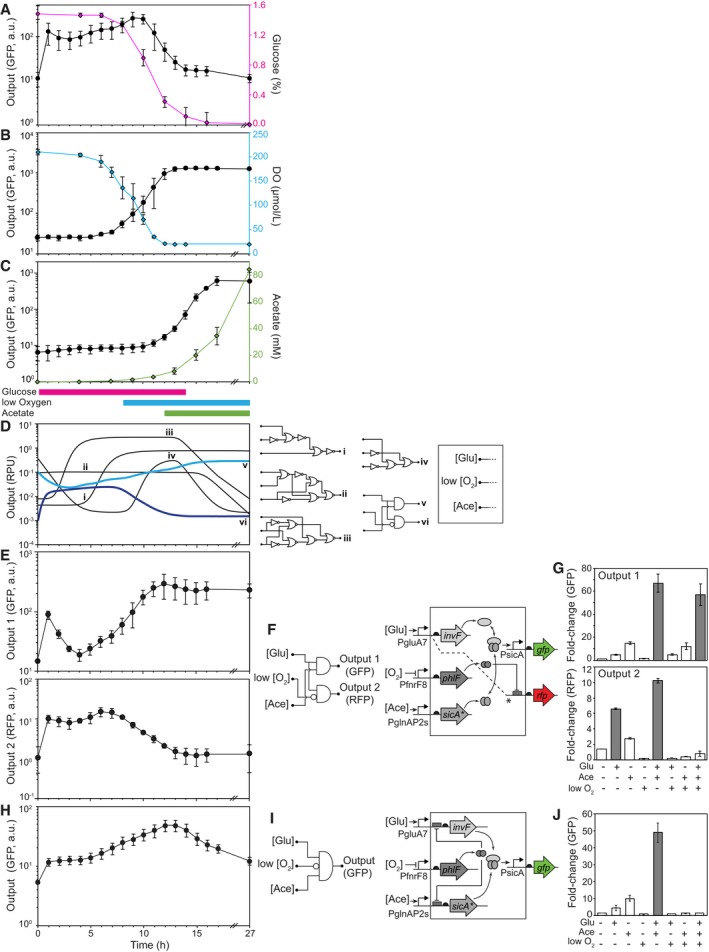
Figure 2. Response of sensors and circuits during growth in batch experiments.
-
A–CThe responses of the glucose, oxygen, and acetate sensors during growth in shake flasks are shown. The colored lines (right axes) correspond to the measured changes in the stimuli (Materials and Methods). The colored bars under (C) show the times when the output promoter of each sensor should be on, based on the response functions shown in Fig 1.
-
DSimulations of circuit dynamics. Examples of different characteristic responses are shown, selected from the full set of simulated circuits (Appendix Fig S8). The lines shown in bold blue colors correspond to those circuits experimentally tested. The simulated output promoter activities are in relative promoter units (RPU; Nielsen et al, 2016).
-
EThe responses of a 3‐input, 2‐output circuit are shown.
-
FShown are the circuit (left) and genetic diagram (right) of the circuit corresponding to (E). In the genetic diagram, the dashed line and * indicates a second copy of the PgluA7 promoter that drives rfp expression and is repressed by PhlF via an immediately downstream PhlF operator.
-
GThe response of the circuit in (E, F) to different combinations of stimuli under the same conditions as Fig 1 (Materials and Methods). The (+) and (−) indicate whether the output promoter of each sensor is active under those conditions. Bars where the circuit is predicted to be on are shown in gray and white when predicted to be off.
-
HThe response of a 3‐input 1‐output circuit is shown.
-
IShown are the circuit (left) and genetic diagram (right) of the circuit corresponding to (H).
-
JThe response of the circuit in (H, I) to different combinations of stimuli under the same conditions as Fig 1 (Materials and Methods).
Sensor integration with combinatorial logic circuits
Over the course of a growth experiment, the output of the three sensor promoters is continuously changing. These promoters can be connected as inputs to a logic circuit that responds only when each sensor is at the correct level. Thus, by connecting the sensors to circuits that implement different logic operations (truth tables), the circuits will produce different responses over time. Because the circuits are based on the layered expression of regulators (a cascade), different circuits that encode the same truth table can result in different dynamics due to delays in signal propagation. To determine the range of possible dynamics, simulations were run for all possible 3‐input logic circuits designed based on layered AND, ANDN, and NOR gates (Moon et al, 2012; Nielsen et al, 2016; Appendix Fig S8). The inputs to the circuit are the empirically measured output promoter activities of the three sensors over time (Fig 2A–C). The circuit response is simulated using a simple set of ordinary differential equations (ODEs) to model the on‐ and off‐times of each gate (Materials and Methods). The simulation results for the full set of circuits are shown in Appendix Fig S8, of which a subset of characteristic responses are shown in Fig 2D. Circuits are predicted to yield a diverse range of dynamic behaviors with varying on‐ and off‐times.
Two modeled circuits were built and tested experimentally (Fig 2E and H). The circuits are built using AND gates that utilize an activator (InvF) that requires the expression of a second protein (SicA) to turn on an output promoter (PsicA; Appendix Fig S9). In addition, the repressor PhlF is used to build ANDN gates (Stanton et al, 2014a). The first circuit (Fig 2E–G) has three inputs and two outputs, where each output is designed to respond to a different combination of signals, and thus, each will turn on and off at different times. In this circuit, the glucose and acetate sensors drive the SicA/InvF system to compose an AND gate. The oxygen sensor drives the repressor PhlF to turn off a second copy of the glucose‐inducible promoter to compose AND NOT (ANDN) logic that activates in the presence of glucose AND NOT low oxygen. The second circuit (Fig 2H–J) is based on a three‐input, one‐output logic gate that implements (A and B) AND NOT (C) logic, where the C signal (low O2) turns off the gate by expressing PhlF, which represses the expression of both InvF and SicA. These gate designs were selected to reduce delays that can occur due to layering and the likelihood of a transiently incorrect response (fault) occurring (Hooshangi et al, 2005; Mangan et al, 2006; Moon et al, 2012).
The circuits were constructed and their responses measured over time. For the first circuit, outputs 1 and 2 were measured using a degradation‐tagged GFP and RFP, respectively (Fig 2E and F). Their responses to changes in the sensor activities are in accordance with the encoded logic (Fig 2G). As predicted, Output 2 turns on early in growth and Output 1 turns on late in growth (after an initial transient response around t = 0 due to the shift from glycerol to glucose). This demonstrates that a single circuit can encode multiple responses by integrating the same set of input sensors; for example, to turn one process off and another on at defined times during growth. The second circuit shows strong induction under the correct conditions and produces a temporal pulse in the activity of the output promoter (Fig 2H–J). The fluorescence distributions from cytometry show that the circuit responses are monotonic (Appendix Fig S10).
Dual transcription/translation control over output genes
The output promoter can be used to drive the expression of a gene. It is more complicated when the goal is to turn a gene off. Tools such as CRISPRi can be used to repress the transcription of a gene by expressing a sgRNA that targets dCas9 to block its transcription (Qi et al, 2013). However, it does not rid the cell of mRNA/protein that has already been expressed, which will continue to be active until they slowly degrade. This will be problematic when a rapid response is required (e.g., to eliminate an enzyme to redirect metabolic flux). Methods to induce the degradation of mRNA and proteins include the transcription of sRNA and targeted proteolysis (Na et al, 2013; Ghodasara & Voigt, 2017). Here, we evaluated different combinations of CRISPRi/sRNA/proteases in order to evaluate their impact on the magnitude and timing of the knockdown of a gene (Fig 3A).
Figure 3. Eliminating protein activity using a combination of CRISPRi, sRNA, and proteases.
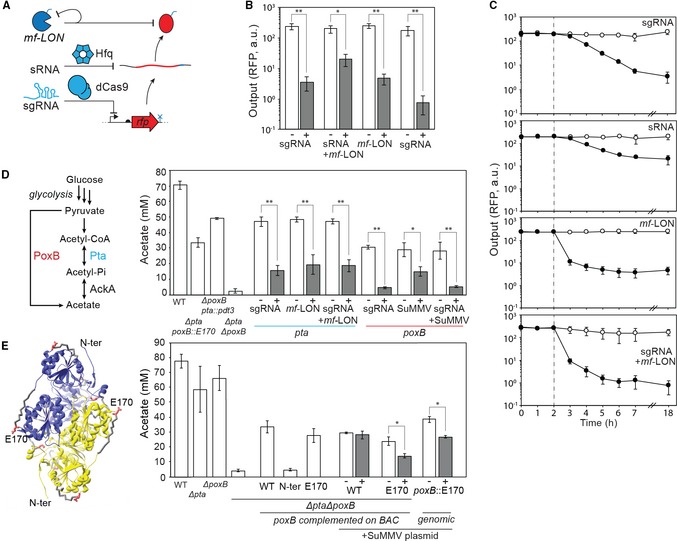
- Schematic showing three levels of repression. A small guide RNA (sgRNA) directs deactivated Cas9 (dCas9) to block transcription from a promoter. sRNA binds to the mRNA and promotes degradation by recruiting Hfq. The mf‐Lon protease targets a tag (blue) added to the protein. The protease is also targeted to itself to reduce toxicity (Materials and Methods).
- Reduction of fluorescence of RFP by the different mechanisms of repression after 18 h of growth (Materials and Methods). The inducers are either 1 mM IPTG (sRNA) or 25 μM DAPG (sgRNA, mf‐LON). sgRNA and mf‐LON are co‐transcribed on a single transcript that is processed by ribozymes (Appendix Fig S13).
- The dynamics of repression by each of the mechanisms is shown. Empty circles are uninduced and black circles are induced (1 mM IPTG or 25 μM DAPG) at the 2‐h time point (dashed line; Materials and Methods).
- Metabolic pathways to acetate in Escherichia coli are shown along with the targeted enzymes. The impact of either knocking out these enzymes or knocking them down by the various mechanisms after 20 h is shown. On the left of the graph are shown empty strains containing either no acetate pathway modifications (WT; MG1655∆glnL), a double deletion (∆pta∆poxB), or single knockouts and protease tag modifications (∆poxB pta::pdt3, ∆pta poxB::E170). On the right are shown knockdowns of pta (blue) and poxB (red), tested in strains ∆poxB pta::pdt3 and ∆pta poxB::E170, respectively. Knockdowns are generated by expression of sgRNA, proteases, or both mechanisms encoded on a single transcript.
- Design of a PoxB mutant that can be targeted by the SuMMV protease. The structure of PoxB is shown (PDB: 3ey9; Neumann et al, 2008), highlighting the amino acid sites selected for degron insertion (in red). The impact on acetate production of different acetate pathway mutants is shown on the left of the graph. On the right of the graph, a double knockout mutant (ΔptaΔpoxB) contains variants of poxB expressed from a BAC. Note that complementation of unmodified poxB (WT) from the BAC does not fully reconstitute acetate production. N‐ter and E170 refer to the location of the SuMMV degron tag in poxB. A plasmid expressing protease SuMMV from a DAPG‐inducible promoter was also introduced into strains containing poxB variants WT and E170 complemented on a BAC and a strain poxB with an E170 site replacement on the genome (poxB::E170). The graph shows the acetate produced in these strains when either no inducer (white) or 25 μM DAPG (grey) is added to the culture.
First, the three methods were evaluated for their ability to reduce the expression of RFP encoded on a plasmid (Materials and Methods). For CRISPRi, dCas9 was expressed from a weak constitutive promoter and sgRNA was expressed from a DAPG‐inducible PphlF promoter encoded on plasmid (p15a origin). The sgRNA encodes a previously published 20 bp targeting sequence that binds to the non‐template strand early in the mRFP1 CDS (Qi et al, 2013). This system represses RFP expression by 69‐fold (Fig 3B). The sRNA sequence is designed to bind a “barcode” sequence (Ghodasara & Voigt, 2017) adjacent to the rfp ribosome binding site (RBS). The sRNA transcript is expressed from an IPTG‐inducible promoter, and a ribozyme is inserted immediately after the promoter to cleave the 5′‐UTR to ensure it is active (Ghodasara & Voigt, 2017). This sRNA system represses RFP expression by 10‐fold in the presence of IPTG (Fig 3B). Because sRNA is less effective in our hands than CRISPRi and showed no improvement in dynamics (Fig 3C and Appendix Fig S11), we selected CRISPRi to combine with proteolysis.
The Mesoplasma florum LON (mf‐LON) protease was tested for its ability to degrade a target protein containing the corresponding 27‐amino acid C‐terminal tag (Materials and Methods; Cameron & Collins, 2014). This tag was fused to RFP and mf‐LON is expressed from an IPTG‐inducible promoter. Some toxicity was observed in the initial designs, which could be mollified by using a weak RBS and fusing the protease to its own degradation tag to enable autoproteolysis (Appendix Fig S12). The expression of mf‐LON is less effective than CRISPRi (Fig 3B), but its impact occurs rapidly with a significant reduction in the first hour (Fig 3C).
We then tested if co‐expression of CRISPRi and protease could behave synergistically to enable more rapid and potent knockdown of RFP. To co‐express both from the same output promoter, a transcript was designed that contains the sgRNA and the protease, separated by a ribozyme (RiboJ; Fig 3A, and Appendix Figs S11 and S13). Although we could not detect greater potency of the knockdown compared to sgRNA alone, we observed a rapid knockdown that matched the speed of the mf‐LON knockdown (Fig 3B and C).
Targeting genome‐encoded enzymes for repression
Core metabolic enzymes involved in acetate production were then targeted using the dual CRISPRi/mf‐LON system. Acetate overproduction late in growth reduces product yield and can be toxic at concentrations above 1 g/l (Wolfe, 2005; Eiteman & Altman, 2006; De Mey et al, 2007). However, it is beneficial to the cell when glucose is plentiful because it facilitates the recycling of coenzyme A and balances the redox state; thus, knocking out the producing genes can be detrimental under these conditions (De Mey et al, 2007). The primary route to acetate production is pta and ackA, which are expressed constitutively and have been reported to be upregulated in low oxygen conditions (Shalel‐Levanon et al, 2005). Pyruvate dehydrogenase (poxB) can also make acetate directly through pyruvate decarboxylation and FAD reduction and is expressed in stationary phase (Chang et al, 1994). Therefore, we selected pta and poxB as the genes to target with dual CRISPRi/protease control.
When E. coli MG1655ΔglnL is grown for 20 h in 1.6% glucose, the resulting culture contains ~ 70 mM acetate (Fig 3D; Materials and Methods). Knocking out either pta or poxB reduces the rate of acetate accumulation during growth but has little effect on the final acetate concentration (Appendix Fig S15). The dual knockout of pta and poxB results in 10‐fold less acetate (Fig 3D and Appendix Fig S15). Deletion of ackA is severely detrimental to growth (Appendix Table S1).
We tested the impact of knocking down pta and poxB with CRISPRi on acetate production. For this, pta and poxB knockdowns were tested in E. coli MG1655ΔglnLΔpoxB and E. coli MG1655ΔglnLΔpta, respectively (Fig 3D; Materials and Methods). Three sgRNAs were designed to target the non‐template strand near the beginning of each gene and were found to have approximately the same effect. One of these sgRNA sequences was selected for each gene, and the corresponding acetate reductions are shown in Fig 3D.
The genes for pta and poxB were then tagged such that different proteases could be used to target their degradation. The N‐terminal of Pta is critical for function, but its C‐terminus can be functionally tagged (Campos‐Bermudez et al, 2010). Therefore, mf‐LON pdt3 tag was fused to the C‐terminus of pta in its native context in the genome, generating the strain E. coli MG1655ΔglnLΔpoxB pta::pdt3. The method by which the tag is introduced into the genome leaves only a short FLP recombinase scar after the tag, as previously described (Cameron & Collins, 2014). Escherichia coli MG1655ΔglnL pta::pdt3 showed no change in growth rate or acetate productivity compared to the wild‐type strain (Appendix Table S1). However, the expression of mf‐LON in this strain reduces acetate production (Fig 3D).
Both the N‐ and C‐terminal ends of PoxB are critical for function, making it ineligible for mf‐LON degradation (Neumann et al, 2008; Weidner et al, 2008). Therefore, the Potyvirus SuMMV protease was selected, which cleaves peptide bonds immediately after the sequence EEIHLQ (Fig 3E; Fernandez‐Rodriguez & Voigt, 2016). Cleavage of this sequence can be used to expose the N‐terminal degron sequence FLFVQ (Bachmair et al, 1986; Tasaki et al, 2012; Fernandez‐Rodriguez & Voigt, 2016). A screen was developed to identify an internal site that could accommodate replacement of the native sequence with EEIHLQFLFVQ without disrupting function. PoxB variants were made that replaced the sequence at positions E170–180, E325–335, E347–357, and E469–479 (Fig 3E, Appendix Figure S14). These four internal poxB variants as well as an N‐terminal fusion variant were expressed from their native promoter from a bacterial artificial chromosome (BAC) in E. coli MG1655ΔglnLΔptaΔpoxB (Materials and Methods). As expected, the N‐terminal fusion of the tag eliminated PoxB activity (Fig 3E). A maltose binding protein (MBP)‐SuMMV fusion was expressed from a DAPG‐inducible promoter on a separate plasmid (Materials and Methods). One variant (E170–180) showed a reduction in acetate that is both protease‐ and tag‐dependent (Appendix Fig S14). We then modified the genomic copy of poxB in E. coli MG1655ΔglnLΔpta with the integrated SuMMV cleavage site and N‐degron, generating the strain E. coli MG1655ΔglnLΔpta poxB::E170 (Materials and Methods). When SuMMV was expressed in this strain, there is a similar decline in acetate production (Fig 3E).
Design of circuits that target pta and poxB when they are transcribed
Two circuits were designed that integrate environmental signals and subsequently knock down genomically encoded poxB and pta to reduce acetate (Fig 4). Previously, it has been reported that pta contributes the most to acetate production during exponential growth and that poxB contributed only after entry into stationary phase (Chang et al, 1994; Wolfe, 2005). To confirm this, we performed transcriptomic studies with E. coli MG1655ΔglnL. We grew this strain in shake flasks in minimal media containing 1.6% glucose for 27 h and assessed the pta and poxB transcript abundance using RNA‐seq at six time points (Materials and Methods). These data confirmed that poxB expression peaks during the transition from exponential to stationary phase, whereas pta expression is higher during exponential growth (Fig 4B and E; Appendix Fig S15).
Figure 4. Dynamic control of acetate production.
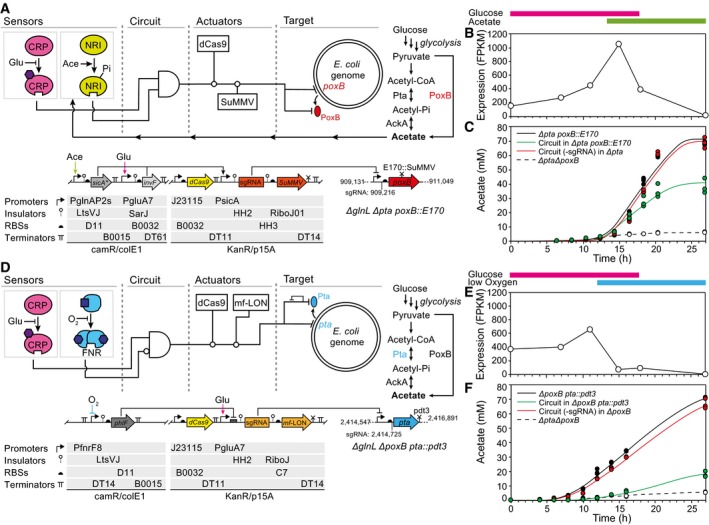
- The genetic circuit designed to control poxB is shown. The strain genotype is shown, including the positions targeted by the sgRNA and the SuMMV protease.
- The transcription of poxB over time (Escherichia coli MG1655∆glnL), as calculated from RNA‐seq data (Materials and Methods). The colored bars indicate the times at which the glucose/acetate sensors will be on based on metabolite measurements. It should be noted that these are right‐shifted compared to Fig 2 due to slower growth of the tested strains.
- The production of acetate is shown over time for E. coli MG1655∆glnL∆pta poxB::E170 (black) as compared to the same strain containing the complete circuit (green). A version of the circuit in which the sgRNA is targeted to rfp (not present in the system) and is tested in MG1655∆glnL∆pta (containing an untagged poxB) is shown as a control (red). Empty circles connected by the dashed line represent MG1655∆glnL∆pta∆poxB.
- The genetic circuit design to control pta is shown.
- The transcription of pta over time (E. coli MG1655∆glnL), as calculated from RNA‐seq data (Materials and Methods). The colored bars indicate the times at which the glucose/oxygen sensors will be on based on metabolite measurements.
- The production of acetate is shown over time for E. coli MG1655∆glnL∆poxB pta::pdt3 as compared to a strain containing the complete circuit (green) tested in same strain. A version of the circuit in which the sgRNA is targeted to rfp (not present in the system) and is tested in MG1655∆glnL∆poxB (containing an untagged pta) is shown as a control (red). Empty circles connected by the dashed line represent MG1655ΔglnLΔptaΔpoxB.
A circuit was selected to regulate poxB by integrating the glucose and acetate sensors using an AND gate (Fig 4A). The predicted response matches when poxB is transcribed (Fig 4B). Note that this circuit implements closed loop feedback control as acetate production is downregulated when sensed. The output of the circuit is used to drive the expression of the sgRNA targeting poxB as well as the SuMMV protease that degrades the tagged enzyme. The background transcription from PsicA was initially too high when the circuit was off, which necessitated its mutation to reduce activity (Materials and Methods). When parent cells lacking the circuit (E. coli MG1655ΔglnLΔpta poxB::E170) are grown, 70 mM acetate accumulated after a day of growth in media containing 1.6% glucose (Fig 4C; Materials and Methods). When the circuit is included, the acetate accumulates normally until the time in which the circuit is expected to become active and then slows its accumulation, subsequently reducing the final acetate concentration by half. A control was constructed in which the sgRNA is targeted to RFP and was tested in a strain in which no protease tag was fused to poxB (E. coli MG1655ΔglnLΔpta). This control yielded the same amount of acetate as the empty control strain (Fig 4C).
To control pta, a different circuit was chosen that responds in the presence of glucose AND NOT low oxygen (Fig 4D). This is predicted to be on during exponential phase and to turn off as cells transition to stationary phase, which mimics when pta is transcribed (Fig 4E). The circuit was constructed by using PfnrF8 to drive the expression of PhlF, which then blocks transcription from the PgluA7 promoter. This promoter serves as the output of the circuit and is connected to the transcription of sgRNA targeting pta and the protease mf‐LON. The output promoter initially showed too much basal transcription, which had to be reduced by mutation (Materials and Methods). When the parent strain lacking the circuit (E. coli MG1655ΔglnLΔpoxB pta::pdt3) is grown in 1.6% glucose for 27 h, it produces 70 mM acetate under the same growth conditions as described above. The same strain containing the circuit greatly reduces acetate accumulation during exponential growth, yielding a 4‐fold reduction in acetate after 27 h (Fig 4F). As a control, we tested a circuit in which sgRNA targets RFP and tested it in a strain in which no protease tag is fused to pta (E. coli MG1655ΔglnLΔpoxB). This control produced the same amount of acetate as the empty control strain, indicating that the reduction in acetate we observed in the pta‐targeting circuit is due to circuit outputs.
Discussion
Digital logic, defined where the signals exist in either a low (0) or high (1) state, is a powerful abstraction because it enables computer algorithms to design the circuit. When applied to genetic circuits, this sometimes invokes criticism that controlling gene expression requires intermediate levels and dynamic control (Zaslaver et al, 2004; Young et al, 2018), neither of which are embedded within a combinatorial logic circuit itself. However, these circuits can implement dynamic responses by continuously monitoring and responding to changes in the sensor inputs. Further, while the logic minimization algorithms generate a wiring diagram based on Boolean logic, the implementation of the circuit with repressors is in practice fuzzy logic, where the gate responses are intermediate levels that can be tuned through the selection of parts.
In this manuscript, we have demonstrated how combinatorial logic circuits can be used to respond to signals that change over the course of growth and can be used to execute a temporal response. Further, it can be used to implement feedback control, where the signal that forms the closed loop (in this case, acetate) is external to the circuit. Extending the logic diagram to include multiple outputs enables the same sensors to be used to implement varied control over different genes. Here, we chose three generic signals that change over the course of production and a greater degree of control could be achieved by expanding this to include additional sensors (metals, ammonia, pH, redox, toxins), light control, and promoters that respond to stress (Brekasis & Paget, 2003; Dixon & Kahn, 2004; Weber et al, 2005; Krulwich et al, 2011; Moser et al, 2013; Wang et al, 2013; Fernandez‐Rodriguez et al, 2017). As the circuits get larger, one can imagine implementing complex control over a metabolic pathway by turning on different portions of the pathway at different times, coordinating stress responses, and staging a process to including steps before (seeding and growth) and after (biomass recycling or disposal) the production phase. Examples of advanced approaches include the following: (i) only expressing oxygen‐sensitive enzymes under anaerobic conditions (Burgard et al, 2012; Immethun et al, 2016), (ii) transiently responding to localized stresses within larger bioreactors (Bylund et al, 1998; Enfors et al, 2001), (iii) lysis system for product recovery (Borrero‐de Acuna et al, 2017), (iv) flocculation for sedimentation for biomass removal and inhibition of cell growth (You et al, 2004; Izard et al, 2015), and (iv) elimination of synthetic DNA before disposal (Caliando & Voigt, 2015; Chan et al, 2016). Such approaches have been implemented individually, but one can envision linking many together into one large system. Thus, the advantages of the resulting synthetic regulatory control encompass far more than the simplistic, albeit important, concepts of improving titer and yield.
There are some key challenges that must be addressed before large synthetic regulatory networks can be practically implemented. Foremost is the problem of toxicity and stability. Even medium‐sized synthetic circuits (≥4 regulators) can slow growth (Sleight et al, 2010; Chen et al, 2013; Xu et al, 2014; Ceroni et al, 2018). This can cause instability in the form of plasmid loss or mutations to the genome (Fernandez‐Rodriguez et al, 2015). Further, the slowing of growth can be devastating for bioproduction. Even when genes only have a slight impact individually, these impacts are additive and quickly compound. This limited the size of the complete systems that we could build to the relatively small circuits shown in Fig 4. Larger circuits that integrated all three sensors, multiple AND/NOT gates, and CRISPRi/protease control of both PoxB/Pta proved to be unstable and significantly slow growth (not shown). Addressing this challenge will require understanding the mechanisms underlying regulator toxicity, quantitative metrics for the resource utilization of regulatory circuitry (e.g., ATP consumption), encoding the circuits in the genome, and redesigning gates to minimize their impact.
Materials and Methods
Strains
All cloning and plasmid propagation was carried out in E. coli NEB10 (F– mcrA Δ(mrr‐hsdRMS‐mcrBC) Φ80lacZDM15 DlacX74 recA1 endA1 araD139 Δ(ara leu) 7697galU galKrpsLnupG λ–; NEB #C3019). Promoter measurement plasmids were built on the backbone of pSB3K3, containing a p15A origin of replication and kanamycin resistance marker (2016; Shetty et al, 2008). Genomic modifications were generated in E. coli MG1655 using the technique of Datsenko and Wanner (Datsenko & Wanner, 2000). For gene knockouts, only the translated CDS (ATG..TAA) of each gene was removed. Fusion of the mf‐LON pdt3 tag to genome‐encoded pta was performed as previously described (Cameron & Collins, 2014). Briefly, a PCR product containing the protease tag, a kanamycin resistance marker, and 50 bp of sequence homologous to the target site were integrated into the genome by lambda red recombination. Following identification of a successful modification by PCR, this cassette was transduced by bacteriophage P1 into E. coli MG1655ΔglnLΔpoxB. The kanamycin resistance marker was then removed by FLP recombinase expressed from pCP20 (Datsenko & Wanner, 2000), which left a 46 bp FLP recombinase scar sequence downstream of pta. For the poxB modification, we modified pKD4 (Datsenko & Wanner, 2000) with the SuMMV‐targeted poxB sequence (E170) inserted downstream of a chloramphenicol resistance marker flanked by two FLP recombinase sites (pFM1165; Appendix Figure S17). Using this plasmid, we generated an amplicon by PCR that contained the chloramphenicol marker, part of the poxB sequence containing the modification, and 50 bp of sequence homologous to the target site upstream of the native poxB. This amplicon was transformed into an E. coli MG1655 strain expressing lambda red recombinase (Datsenko & Wanner, 2000). Following screening by PCR of a successful insertion, this cassette was transduced into E. coli MG1655ΔglnLΔpta with bacteriophage P1. The chloramphenicol resistance marker was then removed by FLP recombinase expressed from pCP20 (Datsenko & Wanner, 2000), leaving a 46 bp scar site immediately upstream of the native poxB promoter. All modified genomic loci were verified by PCR and subsequent Sanger sequencing (Quintara).
Media
Cultures were grown in LB‐Miller broth (BD #2020‐05‐31) for cloning and plasmid propagation. For all other experiments, cultures were grown on a defined industrial minimal medium (MM) containing the following: 5 g/l (NH4)2SO4 (Millipore #AX1385‐1), 5 g/l K2HPO4 (VWR #0705), 30 g/l 2‐(N‐morpholino)ethanesulfonic acid (MES; Sigma #M2933), a carbon source as indicated, and a proprietary mixture of micronutrients as previously described (Moser et al, 2012). Carbon sources included glycerol (VWR #97062‐832) or glucose (BDH #8005‐500g). Concentrations of glycerol and glucose here are given as % mass (g/g). Following preparation, the pH of the minimal media was adjusted to 6.8 with NaOH and HCl and the media was filtered through a 0.2 μm filter (Corning #430049). The inducers anhydrotetracycline (aTc; Sigma #37919), 2,4‐diacetylphloroglucinol (DAPG; Santa Cruz Biotechnology #12161‐86‐6), sodium acetate (Sigma #127‐09‐3), and isopropyl β‐D‐1‐thiogalactopyranoside (IPTG; Sigma #367‐93‐1) were added to the concentrations indicated. Antibiotics were added at the following concentrations to maintain plasmids in all liquid cultures and plates unless otherwise indicated: 50 μg/ml kanamycin (GoldBio #25389‐94‐0), 50 μg/ml spectinomycin (GoldBio #22189‐32‐8), 50 μg/ml ampicillin (GoldBio #69‐52‐3), and 35 μg/ml chloramphenicol (GoldBio #25‐75‐7).
Sensor library design and construction
We automated the design of a library of 11,964 unique 150 bp promoter sequences using a program written in MATLAB (Mathworks). The program concatenates sequences of four different promoters (BBa_J23150, BBa_J23119, apFAB46, apFAB342; 2016; Mutalik et al, 2013) with consensus operators of FruR (GCTGAAACGTTTCAAG; Saier & Ramseier, 1996), CRP (AAATGTGATCTAGATCACATTT; Lawson et al, 2004), and FNR (TTGATTTACATCAA; Constantinidou et al, 2006), flanking randomized spacer sequences (Appendix Table S2), and 20 bp sequences at each end for amplification (Lawson et al, 2004; Kochanowski et al, 2013). Individual operator sequences were inserted at every position of each promoter, and multiple operator sequences were inserted at either the +1 site, the 17 bp spacer between the −10 and −35 sites, or immediately upstream of the −35 site. The completed library sequences were screened for > 5 bp repeats, −10 and −35 near‐consensus sequences, and BsaI sites. The library was synthesized as single‐stranded oligonucleotides on a microarray chip, cleaved from the chip, and delivered as a desiccated sample (CustomArray). Library oligonucleotides were rehydrated and amplified by PCR for 20 cycles with Phusion DNA polymerase (NEB, #M0530) using the primers oFM1004 (GATTACAGGTCTCTCAGGAAACTCAACTCCTGTGGCGTG) and oFM1005 (GATTACAGGTCTCTCTGCTTTCGCACGTATACGTGAGTGG) to generate BsaI cut sites with unique 4 bp overhangs on the ends of the product strands. The plasmid pFM436 was amplified with the primers oFM974 (GATTACAGGTCTCAGCAGAAGCTGTCACCGGATGTGCTTTCCGGTCTGATGAGTCC) and oFM976 (GATTACAGGTCTCTCCTGATGCCACCTGACGTCTAAGAAACCATTATTATCATGACATTAAC) to generate a linear fragment with two BsaI cut sites at each with unique 4 bp overhangs. The PCR products was then gel purified (Zymo #D4001), and library inserts were cloned into pFM436 using the MoClo assembly protocol (Werner et al, 2012) such that library promoters were directionally inserted immediately upstream of sfGFP. The resulting promoter library in pFM436 was then transformed into electrocompetent E. coli MG1655 for screening. To assess the library quality, we sequenced the inserts of 89 different colonies by Sanger sequencing and found that 35 (39%) contained inserts exactly matching members of the library.
Sensor FACS screening
To enrich for promoters with the largest dynamic range in response to inducing conditions, we performed repeated cycles of positive and negative screening using fluorescence‐assisted cell sorting (FACS). For this, we scraped ~ 150,000 individual colonies from library transformation plates and grew the pooled cells in MM containing 0.4% glycerol for 18 h. Cells were then diluted 1/1,000 into fresh MM containing either 0.4% glucose or 0.4% glycerol for the glucose sensors. For oxygen sensors, cells were grown in MM containing 0.4% glycerol in either aerated tubes or tubes from which oxygen had been removed (see below). Cells were grown for 3 h in these conditions before diluting them to an OD600 of 0.01 in phosphate‐buffered saline (PBS; VWR # EM‐6505). FACS screening was performed on a FACSAria 2 (Becton Dickinson) at the Koch Institute Swanson Biotechnology Center Cytometry Core facility (Cambridge, MA). Cells were sorted based on gates drawn diagonally in the GFP versus RFP plot to correct for variation in plasmid copy number (Elowitz et al, 2002). Briefly, a positive screening was performed by collecting at least 1 million cells showing the greatest 5% of GFP to RFP ratio following growth on MM containing 0.4% glucose or no oxygen. Negative screening was performed for all sensors by collecting at least 106 cells showing the lowest 20% of GFP to RFP ratio following growth on MM containing 0.4% glycerol and grown under aerobic conditions. In both positive and negative screening rounds, cells were sorted into 1 ml of LB broth to recover for 3 h and were subsequently plated on LB agar and diluted back 1/100 for overnight growth on MM containing 0.4% glycerol. Each FACS screen was performed identically, excepting alternating growth on positive and negative screening conditions.
Sensor plate screening
After each round of positive and negative FACS screening, some of the cells were diluted and plated on LB agar. Of the resulting colonies, 95 were randomly selected and screened for GFP induction in response to glucose or anaerobic conditions during growth in 96‐well deep‐well plates. As a control, an identical construct containing constitutive promoter BBa_J23101 was also tested to measure the effect of induction conditions on constitutive σ70 promoters. For these assays, colonies were picked into 500 μl MM containing 0.4% glycerol in a 2‐ml deep‐well 96‐well plate and grown for 18 h at 37°C in a Microtron plate incubator (Infors) at 1,000 RPM. The cultures were then diluted 1/100 in fresh 500 μl MM containing 0.4% glycerol in two separate 2‐ml deep‐well 96‐well plates. Following inoculation, each plate was covered with a transparent BreatheEasy membrane (USA Scientific #9123‐6100) and cultures were grown at 37°C in a Microtron plate incubator (Infors) at 1,000 RPM for 6 h prior to induction. For the glucose sensor screen, one plate was induced by adding 0.8% glucose to each well. For the oxygen sensor, one plate was induced by placing it in a vinyl anaerobic chamber (Coy Type C) containing 2% hydrogen, 98% nitrogen, and a palladium catalyst and shaking it at 37°C in a shaker incubator (VWR #12620‐930) at 800 RPM to prevent settling. All plates were grown for an additional 6 h prior to sampling the cultures for cytometry to enable production of the GFP output (see below). Sensor performance was evaluated based on the ratio between the median GFP fluorescence of the uninduced cells compared to the induced cells. The promoters that showed the strongest response were sequenced, sub‐cloned into pFM438 (Appendix Fig S17), and further characterized in E. coli MG1655∆glnL.
RBS and promoter library design and screening
RBS library sequences were computationally generated using the RBS Library Calculator Version 1.2 (Salis Lab; Tian & Salis, 2015). Each library contained at least 50 RBS sequences that evenly spanned 2–3 orders of magnitude in calculated strength (arbitrary units). For promoter libraries, base pairs were randomized at the −10 and −35 sites as indicated. These sequences were then integrated into primers for amplification of the target plasmid. Following generation of the DNA library, electrocompetent cells were transformed with the library and plated on LB agar containing antibiotics. Individual colonies were then picked and screened by fluorescence 96‐well plate assays.
Fluorescence assays
The fluorescence responses of sensors and circuits were tested in 96‐well deep‐well plates (USA Scientific #1896‐2000) or 14‐ml culture tubes (Falcon #352059) unless otherwise indicated. Fresh cultures were inoculated from single colonies streaked on LB agar from a glycerol stock frozen at −80°C. Inoculum cultures were grown for 6 h in 3 ml of LB media at 37°C in 14‐ml culture tubes and then diluted into 3 ml of MM containing 0.8% glycerol in 14‐ml culture tubes for 18 h of overnight growth. The initial OD600 of this overnight culture was calculated such that after 18 h of growth, the OD600 of the culture would not exceed 0.5 to prevent anaerobic induction of the oxygen sensor by a dense culture state (Appendix Fig S6). The glucose and acetate sensor induction curves were performed in 96‐well deep‐well plates. For characterization in plates, overnight cultures were diluted to OD600 = 0.01 in 500 μl MM containing 0.8% glycerol in a 2‐ml deep‐well 96‐well plate. Following inoculation, the plate was covered with a transparent BreatheEasy membrane (USA Scientific #9123‐6100) and cultures were grown at 37°C in a Microtron plate incubator (Infors) at 1,000 RPM for 6 h prior to induction. Oxygen sensors and oxygen‐modulated circuits were tested in 14‐ml culture tubes, unless otherwise noted, in order to maintain anaerobic conditions following initial removal of oxygen by vacuum and nitrogen cycling as described below. RFP knockdown time courses (Fig 3) were also performed in tubes. For characterization in tubes, overnight cultures were diluted to OD600 = 0.01 in 3 ml of MM containing 0.8% glycerol in 14‐ml culture tubes. Cultures were then grown in an Innova 44 shaking incubator (New Brunswick) at 250 RPM and 37°C for 6 h prior to induction. Acetate and glucose sensors were induced with glucose and acetate dissolved in MM as indicated. Oxygen sensor cultures were induced by sealing the culture tubes with rubber stoppers (Fisher Scientific #FB57879) and using a vacuum manifold to remove the air from the tube and replace it with nitrogen to ambient pressure. Vacuum and nitrogen cycling was done three times to maximize the removal of oxygen from the headspace. Following induction, cells were sampled at the indicated time points for cytometry analysis, using syringes to penetrate the rubber stoppers for the anaerobic oxygen sensor cultures. Sampled cells were diluted to an OD600 of 0.01 or below in cold PBS containing 0.5 mg/ml of Kanamycin and were left at 4°C for at least 1 h prior to cytometry.
Acetate knockdown assays
CRISPRi, sRNA, and protease knockdown of targeted pta and poxB were tested in 14‐ml culture tubes. Knockdowns of pta and poxB was tested in E. coli MG1655ΔglnLΔpoxB pta::pdt3 and E. coli MG1655ΔglnLΔpta poxB::170, respectively. Inoculum cultures were grown for 6 h in 3 ml of LB media at 37°C in 14‐ml culture tubes. Cultures were then diluted 1/1,000 into 3 ml of MM containing 0.8% glycerol in 14‐ml culture tubes for 18 h of overnight growth. Following overnight growth, inoculum cultures were diluted to an OD600 of 0.01 in 4 ml of MM containing 1.6% glucose and either inducers or no inducers. CRISPRi systems were induced with 25 μM DAPG and 4 ng/ml aTc, sRNA systems were induced with 1 mM IPTG, and proteases mf‐LON and SuMMV were induced with 25 μM DAPG. Cultures were then grown in an Innova 44 shaking incubator (New Brunswick) at 250 RPM and 37°C. Following overnight growth, 1 ml of each culture was added to a separate 1.5 ml tube and centrifuged at 21,000 g for 5 min. This was repeated twice more, keeping half the volume of supernatant after each spin. After the third centrifugation, 100 μl of supernatant was pipetted into a U‐bottom 96‐well plate (Corning #3797). This plate was covered with an AluminaSeal (Diversified Biotech #ALUM‐1000) and kept at 4°C until analysis by liquid chromatography.
Shake flask cultures
We assessed sensor and circuit performance in shake flask cultures, a common intermediate during industrial scale‐up. For these experiments, we grew cultures of 30 ml MM in 250‐ml unbaffled shake flasks (Pyrex No. 4980) and used fluorescent protein reporters fused to a weak ssrA degradation tag (AANDENYAASV). Fresh cultures were grown from single colonies streaked on LB agar the previous day from a glycerol stock frozen at −80°C. These inoculum cultures were grown out for 6 h in 3 ml of LB media at 37°C in 14‐ml culture tubes and then diluted into 3 ml of MM containing 0.8% glycerol in 14‐ml culture tubes for 18 h of overnight growth. The initial dilution of these overnight cultures was carefully set to a sufficiently low OD600 so that the cell density after 18 h of growth would be below an OD600 of 0.5 so as not to induce the oxygen sensor. The overnight culture was diluted to an OD600 of 0.01 in pre‐warmed 30 ml of MM containing carbon sources as indicated. Cultures were grown at 37°C at 250 RPM in an Innova 44 incubator (New Brunswick) with a circular throw diameter of 1 inch. Samples of 1 ml were removed at different time points and their OD600 was immediately measured using a Cary 50 UV‐vis spectrophotometer (Varian) before freezing at −20°C in a 96‐well deep‐well plate for later analysis.
Cytometry
Cells were analyzed by flow cytometry on a LSR Fortessa analyzer (BD) with a 488‐nm laser and 510/20‐nm band pass filter to collect GFP fluorescence and a 561‐nm laser and 610/20‐nm band pass filter to collect RFP fluorescence. Cell samples were diluted below OD600 of 0.01 in PBS to ensure separation of cell events. Cell samples were analyzed by a High‐Throughput Sampler at a flow rate of 0.5 μl/s until 104–105 gated counts were collected. FSC‐H and SSC‐H thresholds were set to exclude background events. Data were analyzed using FlowJo software (Treestar). The median of the fluorescence histogram of each gated population was calculated and is reported here as the fluorescence value of a sample in arbitrary units (a.u.).
Dissolved oxygen measurements
To measure dissolved oxygen (DO) during shake flask growth, we used a FireStingO2 oxygen sensor (PyroScience) with an OXF1100 needle. The sensor was calibrated to 100% DO (210 μmol/l) with a single point calibration in MM heated to 37°C and vigorously shaken for 5 min prior to calibration. DO measurements were taken by submerging the sensor needle in the culture immediately after removing the culture flask from the incubator. Sensor readings were recorded in real time in the FireStingO2 software and were analyzed for equilibrium DO concentrations. Readings below 20 μmol/l could not be accurately attained; therefore, lower readings are reported at this lower limit. Following DO measurement, 1 ml of each culture was sampled to measure cell density (OD600) on a Cary 50 UV‐vis spectrophotometer (Varian).
Liquid chromatography
Culture samples frozen at −20°C in 96‐well plates were thawed in a 42°C water bath for 30 min. Sample plates were then centrifuged at 4,255 g for 10 min three times, each time pipetting half the supernatant into a clean plate. After the third centrifugation, 100 μl of supernatant was pipetted into a U‐bottom 96‐well plate (Corning #3797). This plate was covered with an AluminaSeal (Diversified Biotech #ALUM‐1000) and kept at 4°C until analysis. Supernatant analysis was performed using an Agilent 1260 Infinity Liquid Chromatography system with an inline Aminex HPX‐87H column (#125‐0140) and Micro‐Guard Cation column (Bio‐Rad #125‐0129) running a 5 mM sulfuric acid mobile phase at 0.6 ml/min. Purified supernatant samples in 96‐well plates were placed in an autosampler cooled to 4°C. Following sampling of 10 μl, the autosampler needle was cleaned with a 3‐s rinse of 10% isopropanol. The peaks for glucose (9.2 min) and acetate (15.5 min) were detected with a Refractive Index detector (RID; Agilent #G1362A). Both the columns and the RID were heated to 35°C. Standard curves of glucose (Sigma #049K6201) and acetate (Fluka #57191) were run to enable quantification. Integration of the RID peaks for glucose and acetate was done automatically in Chemstation software (Agilent).
Modeling
To generate circuit models, the sensors’ promoter activities were first converted to relative promoter units (RPU) by multiplying the background‐subtracted fluorescence levels by a conversion factor (10−3) estimated such that the units are comparable to a previously published standard (Nielsen et al, 2016). The minimum and maximum values for each sensor's output promoter are (in RPU) as follows: glucose, 0.006–0.237; low oxygen, 0.020–1.346; and acetate 0.002 and 0.700. The output of each sensor was measured at discrete 1‐h time points over 27‐h growth experiments. For the purposes of the simulation, sensor outputs in between measurements are determined using a linear interpolation. All possible 3‐input, 1‐output truth tables were designed by Cello (version 1.0 with Eco1C1G1T1 UCF) using the minimum and maximum RPU values for the sensors (Nielsen et al, 2016). The output of Cello includes a wiring diagram of NOR/NOT gates that produces the desired truth table as well as the specific repressors assigned to each gate. The circuits based on AND and ANDN gates were designed by hand. Cello only predicts the steady‐state behavior of the circuit. Simple dynamic simulations were run to evaluate how the circuits respond to changes in the sensors over time. The steady‐state response function for each NOR/NOT gate is captured by
| (1) |
where x is the activity of the input promoter (for a NOR gate, x is the sum of the input promoters x = x 1 + x 2), y is the output of the gate, and the parameters are dependent on the assigned repressor and have been published previously (Nielsen et al, 2016). For the AND gate, the response function is
| (2) |
where x 1 and x 2 are the outputs from glucose and acetate sensors, respectively, and the parameters are estimated to be y min = 0.001 RPU, y max = 0.3 RPU, and K = 10−5 RPU. For the ANDN gate,
| (3) |
where x 1 and x 2 are the outputs from glucose and oxygen sensors, respectively, y min = 0.001 RPU, and K = 0.0025 RPU. To simulate the dynamic response of each circuit, a set of ordinary differential equations (ODEs) is solved, where each ODE represents the change in the output activity of a gate in the circuit according to
| (4) |
where α and γ are the rate constants for turning a gate ON and OFF, respectively. Parameters y min, y max, K, and n are the same as equation (1), and α and γ are estimated to be 1 per hour (Tabor et al, 2009; Moon et al, 2012). Equations (5), (6), (7) show the complete set of equations for an example 3‐input (x 1, x 2, x 3) and 1‐output (y 3) circuit (Circuit B in the top panel of Appendix Fig S8):
| (5) |
| (6) |
| (7) |
This system of ODEs is solved discretely in Python for an interval of 27 h, using a time step size of 0.025 h. In each time step, the corresponding empirical values for the output activity of glucose, oxygen, and acetate sensors are assigned to the inputs x 1, x 2, and x 3, respectively. The initial conditions for y 1, y 2, and y 3 are also determined by solving the above system of ODEs at steady state using the following sensor output activities: x 1 = 1.294 RPU, x 2 = 0.006 RPU, and x 3 = 0.028 RPU.
RNA‐seq library preparation
RNA‐seq library preparation and sequencing were performed following the methods described in Gorochowski et al (2017). Briefly, total RNA was harvested from E. coli MG1655 ΔglnL cells at different time points specified above. Cells were grown in minimal media containing 1.6% glucose. At least 2 million cells were collected at each time point, as assessed by the culture's OD600. This was done by spinning down sufficient volume of each culture at 4°C and 15,000 × g for 3 min, discarding the supernatant, and flash freezing the cell pellets in liquid nitrogen for storage at −80°C. After lysing the cells with 1 mg of lysozyme (Sigma‐Aldrich, MO, L6871) in 10 mM Tris–HCl (pH 8.0) with 0.1 mM EDTA (USB 75825 and 15694, respectively), RNA was extracted with PureLink RNA Mini Kit (Life Technologies, CA, 12183020). RNA Clean & Concentrator‐5 (Zymo Research, R1015) was used to further purify and concentrate the RNA samples, verified by Bioanalyzer (Agilent, CA). Next, ribosomal RNAs were depleted from the samples using Ribo‐Zero rRNA Removal Kit for bacteria (Illumina, CA, MRZMB126). Only samples with RNA integrity number (RIN) > 8.5 were considered for the subsequent library preparation steps. Strand‐specific RNAtag‐seq libraries were created by the Broad Technology Labs specialized service facility (SSF) (Gorochowski et al, 2017). Each sample was tagged with a unique barcode, and all samples were pooled together to run on two separate lanes of an Illumina HiSeq 2500. Finally, sequencing reads were generated by re‐pooling the reads from the two lanes, de‐multiplexing them into the original samples, and trimming the barcode tag from each read.
Processing of sequencing data
Alignment of raw reads and transcription profile generation were performed following a previously developed in‐house Python script (Gorochowski et al, 2017). Briefly, raw reads were mapped to the genome of E. coli MG1655 (NCBI RefSeq: NC_000913.3), with one modification in which the relevant region around glnL gene was deleted to yield E. coli MG1655ΔglnL. The alignment of raw reads was done using BWA version 0.7.4 with default settings (Li & Durbin, 2009), followed by generating the corresponding SAM files and BAM files. Next, the sense and anti‐sense transcription profiles were generated by identifying the position of mapped reads in the forward and reverse directions, respectively. To do that, the BAM files were filtered using the “view” command of SAMtools and the sense reads were selected using the filter codes 83 and 163, and anti‐sense reads were selected using filter codes 99 and 147. The normalized FPKM values were calculated by averaging the height of transcription profile along the length of each gene, normalized by the total mapped nucleotides across the genome, and multiplied by 109. To account for potential variations introduced during library preparation, between‐sample normalization factors were calculated using the trimmed mean of M‐values approach (TMM; Robinson & Oshlack, 2010), and were applied to the FPKM values in each sample.
Data availability
Full annotated plasmid sequences, code for generating promoter libraries, and detailed descriptions of promoter sequences are provided in the authors’ Github repository (https://github.com/VoigtLab/promoter-library-design-tool). Additional data is available upon request.
Author contributions
FM and CAV conceived of the study. FM designed and performed the experiments and analyzed the data. AEB did the modeling and analyzed RNA seq data. ANG designed the sRNA system. EC designed the self‐targeting mf‐LON system. YP handled samples for the RNA seq experiment. FM, AEB, and CAV wrote the manuscript.
Conflict of interest
The author declares that they have no conflict of interest.
Supporting information
Appendix
Review Process File
Acknowledgements
This work was supported by US National Science Foundation Synthetic Biology Engineering Research Center (SynBERC EEC0540879) and the Office of Naval Research Multidisciplinary University Research Initiative (N00014‐13‐1‐0074) and the Department of Energy (DE‐SC0018368, DE‐SC0018368).
Mol Syst Biol. (2018) 14: e8605
References
- Afroz T, Biliouris K, Boykin KE, Kaznessis Y, Beisel CL (2015) Trade‐offs in engineering sugar utilization pathways for titratable control. ACS Synth Biol 4: 141–149 [DOI] [PMC free article] [PubMed] [Google Scholar]
- Albanesi D, de Mendoza D (2016) FapR: from control of membrane lipid homeostasis to a biotechnological tool. Front Mol Biosci 3: 64 [DOI] [PMC free article] [PubMed] [Google Scholar]
- Anderson JC, Voigt CA, Arkin AP (2007) Environmental signal integration by a modular AND gate. Mol Syst Biol 3: 133 [DOI] [PMC free article] [PubMed] [Google Scholar]
- Anesiadis N, Kobayashi H, Cluett WR, Mahadevan R (2013) Analysis and design of a genetic circuit for dynamic metabolic engineering. ACS Synth Biol 2: 442–452 [DOI] [PubMed] [Google Scholar]
- Bachmair A, Finley D, Varshavsky A (1986) In vivo half‐life of a protein is a function of its amino‐terminal residue. Science 234: 179–186 [DOI] [PubMed] [Google Scholar]
- Bayly AM, Kortt AA, Hudson PJ, Power BE (2002) Large‐scale bacterial fermentation and isolation of scFv multimers using a heat‐inducible bacterial expression vector. J Immunol Methods 262: 217–227 [DOI] [PubMed] [Google Scholar]
- Bennett MR, Pang WL, Ostroff NA, Baumgartner BL, Nayak S, Tsimring LS, Hasty J (2008) Metabolic gene regulation in a dynamically changing environment. Nature 454: 1119–1122 [DOI] [PMC free article] [PubMed] [Google Scholar]
- Boccazzi P, Zhang Z, Kurosawa K, Szita N, Bhattacharya S, Jensen KF, Sinskey AJ (2006) Differential gene expression profiles and real‐time measurements of growth parameters in Saccharomyces cerevisiae grown in microliter‐scale bioreactors equipped with internal stirring. Biotechnol Prog 22: 710–717 [DOI] [PubMed] [Google Scholar]
- Bonde MT, Kosuri S, Genee HJ, Sarup‐Lytzen K, Church GM, Sommer MO, Wang HH (2015) Direct mutagenesis of thousands of genomic targets using microarray‐derived oligonucleotides. ACS Synth Biol 4: 17–22 [DOI] [PMC free article] [PubMed] [Google Scholar]
- Borkowski O, Endy D, Subsoontorn P (2017) Hands‐free control of heterologous gene expression. BioRxiv 10.1101/150375 [PREPRINT] [DOI] [Google Scholar]
- Borrero‐de Acuna JM, Hidalgo‐Dumont C, Pacheco N, Cabrera A, Poblete‐Castro I (2017) A novel programmable lysozyme‐based lysis system in Pseudomonas putida for biopolymer production. Sci Rep 7: 4373 [DOI] [PMC free article] [PubMed] [Google Scholar]
- Bothfeld W, Kapov G, Tyo KEJ (2017) A glucose‐sensing toggle switch for autonomous, high productivity genetic control. ACS Synth Biol 6: 1296–1304 [DOI] [PubMed] [Google Scholar]
- Boyarskiy S, Davis Lopez S, Kong N, Tullman‐Ercek D (2016) Transcriptional feedback regulation of efflux protein expression for increased tolerance to and production of n‐butanol. Metab Eng 33: 130–137 [DOI] [PubMed] [Google Scholar]
- Brekasis D, Paget MS (2003) A novel sensor of NADH/NAD+ redox poise in Streptomyces coelicolor A3(2). EMBO J 22: 4856–4865 [DOI] [PMC free article] [PubMed] [Google Scholar]
- Brockman IM, Prather KL (2015a) Dynamic knockdown of E. coli central metabolism for redirecting fluxes of primary metabolites. Metab Eng 28: 104–113 [DOI] [PMC free article] [PubMed] [Google Scholar]
- Brockman IM, Prather KL (2015b) Dynamic metabolic engineering: new strategies for developing responsive cell factories. Biotechnol J 10: 1360–1369 [DOI] [PMC free article] [PubMed] [Google Scholar]
- Brophy JA, Voigt CA (2014) Principles of genetic circuit design. Nat Methods 11: 508–520 [DOI] [PMC free article] [PubMed] [Google Scholar]
- Bulter T, Lee SG, Wong WW, Fung E, Connor MR, Liao JC (2004) Design of artificial cell‐cell communication using gene and metabolic networks. Proc Natl Acad Sci USA 101: 2299–2304 [DOI] [PMC free article] [PubMed] [Google Scholar]
- Burgard AP, Pharkya P, Maranas CD (2003) Optknock: a bilevel programming framework for identifying gene knockout strategies for microbial strain optimization. Biotechnol Bioeng 84: 647–657 [DOI] [PubMed] [Google Scholar]
- Burgard AP, Burk MJ, Pharkya P (2012) Methods and organisms for converting synthesis gas or other gaseous carbon sources and methanol to 1,3‐butanediol, Vol. US8268607 B2. In USPTO (ed.). San Diego, CA: Genomatica, Inc. [Google Scholar]
- Bylund F, Collet E, Enfors SO, Larsson G (1998) Substrate gradient formation in the large‐scale bioreactor lowers cell yield and increases by‐product formation. Bioprocess Eng 18: 171–180 [Google Scholar]
- Caliando BJ, Voigt CA (2015) Targeted DNA degradation using a CRISPR device stably carried in the host genome. Nat Commun 6: 6989 [DOI] [PMC free article] [PubMed] [Google Scholar]
- Callura JM, Cantor CR, Collins JJ (2012) Genetic switchboard for synthetic biology applications. Proc Natl Acad Sci USA 109: 5850–5855 [DOI] [PMC free article] [PubMed] [Google Scholar]
- Cameron DE, Collins JJ (2014) Tunable protein degradation in bacteria. Nat Biotechnol 32: 1276–1281 [DOI] [PMC free article] [PubMed] [Google Scholar]
- Campos‐Bermudez VA, Bologna FP, Andreo CS, Drincovich MF (2010) Functional dissection of Escherichia coli phosphotransacetylase structural domains and analysis of key compounds involved in activity regulation. FEBS J 277: 1957–1966 [DOI] [PubMed] [Google Scholar]
- Ceroni F, Blount BA, Ellis T (2016) Sensing the right time to be productive. Cell Syst 3: 116–117 [DOI] [PubMed] [Google Scholar]
- Ceroni F, Boo A, Furini S, Gorochowski TE, Borkowski O, Ladak YN, Awan AR, Gilbert C, Stan GB, Ellis T (2018) Burden‐driven feedback control of gene expression. Nat Methods 15: 387–393 [DOI] [PubMed] [Google Scholar]
- Chan CT, Lee JW, Cameron DE, Bashor CJ, Collins JJ (2016) ‘Deadman’ and ‘Passcode’ microbial kill switches for bacterial containment. Nat Chem Biol 12: 82–86 [DOI] [PMC free article] [PubMed] [Google Scholar]
- Chang YY, Wang AY, Cronan JE Jr (1994) Expression of Escherichia coli pyruvate oxidase (PoxB) depends on the sigma factor encoded by the rpoS(katF) gene. Mol Microbiol 11: 1019–1028 [DOI] [PubMed] [Google Scholar]
- Chen W, Bailey JE (1994) Communication to the editor. Application of the cross‐regulation system as a metabolic switch. Biotechnol Bioeng 43: 1190–1193 [DOI] [PubMed] [Google Scholar]
- Chen YJ, Liu P, Nielsen AA, Brophy JA, Clancy K, Peterson T, Voigt CA (2013) Characterization of 582 natural and synthetic terminators and quantification of their design constraints. Nat Methods 10: 659–664 [DOI] [PubMed] [Google Scholar]
- Cho BK, Kim D, Knight EM, Zengler K, Palsson BO (2014) Genome‐scale reconstruction of the sigma factor network in Escherichia coli: topology and functional states. BMC Biol 12: 4 [DOI] [PMC free article] [PubMed] [Google Scholar]
- Constantinidou C, Hobman JL, Griffiths L, Patel MD, Penn CW, Cole JA, Overton TW (2006) A reassessment of the FNR regulon and transcriptomic analysis of the effects of nitrate, nitrite, NarXL, and NarQP as Escherichia coli K12 adapts from aerobic to anaerobic growth. J Biol Chem 281: 4802–4815 [DOI] [PubMed] [Google Scholar]
- Cox RS III, Surette MG, Elowitz MB (2007) Programming gene expression with combinatorial promoters. Mol Syst Biol 3: 145 [DOI] [PMC free article] [PubMed] [Google Scholar]
- Dahl RH, Zhang F, Alonso‐Gutierrez J, Baidoo E, Batth TS, Redding‐Johanson AM, Petzold CJ, Mukhopadhyay A, Lee TS, Adams PD, Keasling JD (2013) Engineering dynamic pathway regulation using stress‐response promoters. Nat Biotechnol 31: 1039–1046 [DOI] [PubMed] [Google Scholar]
- Datsenko KA, Wanner BL (2000) One‐step inactivation of chromosomal genes in Escherichia coli K‐12 using PCR products. Proc Natl Acad Sci USA 97: 6640–6645 [DOI] [PMC free article] [PubMed] [Google Scholar]
- De Mey M, De Maeseneire S, Soetaert W, Vandamme E (2007) Minimizing acetate formation in E. coli fermentations. J Ind Microbiol Biotechnol 34: 689–700 [DOI] [PubMed] [Google Scholar]
- Deaner M, Alper HS (2017) Systematic testing of enzyme perturbation sensitivities via graded dCas9 modulation in Saccharomyces cerevisiae . Metab Eng 40: 14–22 [DOI] [PubMed] [Google Scholar]
- Deparis Q, Claes A, Foulquie‐Moreno MR, Thevelein JM (2017) Engineering tolerance to industrially relevant stress factors in yeast cell factories. FEMS Yeast Res 17: fox036 [DOI] [PMC free article] [PubMed] [Google Scholar]
- Dixon R, Kahn D (2004) Genetic regulation of biological nitrogen fixation. Nat Rev Microbiol 2: 621–631 [DOI] [PubMed] [Google Scholar]
- Drinnenberg IA, Weinberg DE, Xie KT, Mower JP, Wolfe KH, Fink GR, Bartel DP (2009) RNAi in budding yeast. Science 326: 544–550 [DOI] [PMC free article] [PubMed] [Google Scholar]
- Eiteman MA, Altman E (2006) Overcoming acetate in Escherichia coli recombinant protein fermentations. Trends Biotechnol 24: 530–536 [DOI] [PubMed] [Google Scholar]
- Elowitz MB, Levine AJ, Siggia ED, Swain PS (2002) Stochastic gene expression in a single cell. Science 297: 1183–1186 [DOI] [PubMed] [Google Scholar]
- Enfors SO, Jahic M, Rozkov A, Xu B, Hecker M, Jurgen B, Kruger E, Schweder T, Hamer G, O'Beirne D, Noisommit‐Rizzi N, Reuss M, Boone L, Hewitt C, McFarlane C, Nienow A, Kovacs T, Tragardh C, Fuchs L, Revstedt J et al (2001) Physiological responses to mixing in large scale bioreactors. J Biotechnol 85: 175–185 [DOI] [PubMed] [Google Scholar]
- Farmer WR, Liao JC (2000) Improving lycopene production in Escherichia coli by engineering metabolic control. Nat Biotechnol 18: 533–537 [DOI] [PubMed] [Google Scholar]
- Feher T, Libis V, Carbonell P, Faulon JL (2015) A sense of balance: experimental investigation and modeling of a malonyl‐CoA sensor in Escherichia coli . Front Bioeng Biotechnol 3: 46 [DOI] [PMC free article] [PubMed] [Google Scholar]
- Fernandez‐Rodriguez J, Yang L, Gorochowski TE, Gordon DB, Voigt CA (2015) Memory and combinatorial logic based on DNA inversions: dynamics and evolutionary stability. ACS Synth Biol 4: 1361–1372 [DOI] [PubMed] [Google Scholar]
- Fernandez‐Rodriguez J, Voigt CA (2016) Post‐translational control of genetic circuits using Potyvirus proteases. Nucleic Acids Res 44: 6493–6502 [DOI] [PMC free article] [PubMed] [Google Scholar]
- Fernandez‐Rodriguez J, Moser F, Song M, Voigt CA (2017) Engineering RGB color vision into Escherichia coli . Nat Chem Biol 13: 706–708 [DOI] [PubMed] [Google Scholar]
- Garcia JR, Cha HJ, Rao G, Marten MR, Bentley WE (2009) Microbial nar‐GFP cell sensors reveal oxygen limitations in highly agitated and aerated laboratory‐scale fermentors. Microb Cell Fact 8: 6 [DOI] [PMC free article] [PubMed] [Google Scholar]
- Ghodasara A, Voigt CA (2017) Balancing gene expression without library construction via a reusable sRNA pool. Nucleic Acids Res 45: 8116–8127 [DOI] [PMC free article] [PubMed] [Google Scholar]
- Gorochowski TE, Espah Borujeni A, Park Y, Nielsen AA, Zhang J, Der BS, Gordon DB, Voigt CA (2017) Genetic circuit characterization and debugging using RNA‐seq. Mol Syst Biol 13: 952 [DOI] [PMC free article] [PubMed] [Google Scholar]
- Green AA, Kim J, Ma D, Silver PA, Collins JJ, Yin P (2017) Complex cellular logic computation using ribocomputing devices. Nature 548: 117–121 [DOI] [PMC free article] [PubMed] [Google Scholar]
- Guan C, Cui W, Cheng J, Zhou L, Liu Z, Zhou Z (2016) Development of an efficient autoinducible expression system by promoter engineering in Bacillus subtilis . Microb Cell Fact 15: 66 [DOI] [PMC free article] [PubMed] [Google Scholar]
- Gupta A, Reizman IM, Reisch CR, Prather KL (2017) Dynamic regulation of metabolic flux in engineered bacteria using a pathway‐independent quorum‐sensing circuit. Nat Biotechnol 35: 273–279 [DOI] [PMC free article] [PubMed] [Google Scholar]
- Harder BJ, Bettenbrock K, Klamt S (2018) Temperature‐dependent dynamic control of the TCA cycle increases volumetric productivity of itaconic acid production by Escherichia coli . Biotechnol Bioeng 115: 156–164 [DOI] [PMC free article] [PubMed] [Google Scholar]
- He X, Chen Y, Liang Q, Qi Q (2017) Autoinduced AND gate controls metabolic pathway dynamically in response to microbial communities and cell physiological state. ACS Synth Biol 6: 463–470 [DOI] [PubMed] [Google Scholar]
- Holtz WJ, Keasling JD (2010) Engineering static and dynamic control of synthetic pathways. Cell 140: 19–23 [DOI] [PubMed] [Google Scholar]
- Hooshangi S, Thiberge S, Weiss R (2005) Ultrasensitivity and noise propagation in a synthetic transcriptional cascade. Proc Natl Acad Sci USA 102: 3581–3586 [DOI] [PMC free article] [PubMed] [Google Scholar]
- Hoynes‐O'Connor A, Moon TS (2015) Programmable genetic circuits for pathway engineering. Curr Opin Biotechnol 36: 115–121 [DOI] [PubMed] [Google Scholar]
- Hoynes‐O'Connor A, Shopera T, Hinman K, Creamer JP, Moon TS (2017) Enabling complex genetic circuits to respond to extrinsic environmental signals. Biotechnol Bioeng 114: 1626–1631 [DOI] [PubMed] [Google Scholar]
- Immethun CM, Ng KM, DeLorenzo DM, Waldron‐Feinstein B, Lee YC, Moon TS (2016) Oxygen‐responsive genetic circuits constructed in Synechocystis sp. PCC 6803. Biotechnol Bioeng 113: 433–442 [DOI] [PubMed] [Google Scholar]
- Izard J, Gomez Balderas CD, Ropers D, Lacour S, Song X, Yang Y, Lindner AB, Geiselmann J, de Jong H (2015) A synthetic growth switch based on controlled expression of RNA polymerase. Mol Syst Biol 11: 840 [DOI] [PMC free article] [PubMed] [Google Scholar]
- Juarez JF, Lecube‐Azpeitia B, Brown SL, Johnston CD, Church GM (2017) Biosensor libraries harness large classes of binding domains for construction of allosteric transcriptional regulators. Nat Commun 9: 3101 [DOI] [PMC free article] [PubMed] [Google Scholar]
- Kang Z, Wang Q, Zhang H, Qi Q (2008) Construction of a stress‐induced system in Escherichia coli for efficient polyhydroxyalkanoates production. Appl Microbiol Biotechnol 79: 203–208 [DOI] [PubMed] [Google Scholar]
- Karig D, Weiss R (2005) Signal‐amplifying genetic circuit enables in vivo observation of weak promoter activation in the Rhl quorum sensing system. Biotechnol Bioeng 89: 709–718 [DOI] [PubMed] [Google Scholar]
- Kasey CM, Zerrad M, Li Y, Cropp TA, Williams GJ (2018) Development of transcription factor‐based designer macrolide biosensors for metabolic engineering and synthetic biology. ACS Synth Biol 7: 227–239 [DOI] [PMC free article] [PubMed] [Google Scholar]
- Kelly JR, Rubin AJ, Davis JH, Ajo‐Franklin CM, Cumbers J, Czar MJ, de Mora K, Glieberman AL, Monie DD, Endy D (2009) Measuring the activity of BioBrick promoters using an in vivo reference standard. J Biol Eng 3: 4 [DOI] [PMC free article] [PubMed] [Google Scholar]
- Klamt S, Regensburger G, Gerstl MP, Jungreuthmayer C, Schuster S, Mahadevan R, Zanghellini J, Muller S (2017) From elementary flux modes to elementary flux vectors: metabolic pathway analysis with arbitrary linear flux constraints. PLoS Comput Biol 13: e1005409 [DOI] [PMC free article] [PubMed] [Google Scholar]
- Kobayashi H, Kaern M, Araki M, Chung K, Gardner TS, Cantor CR, Collins JJ (2004) Programmable cells: interfacing natural and engineered gene networks. Proc Natl Acad Sci USA 101: 8414–8419 [DOI] [PMC free article] [PubMed] [Google Scholar]
- Kochanowski K, Volkmer B, Gerosa L, Haverkorn van Rijsewijk BR, Schmidt A, Heinemann M (2013) Functioning of a metabolic flux sensor in Escherichia coli . Proc Natl Acad Sci USA 110: 1130–1135 [DOI] [PMC free article] [PubMed] [Google Scholar]
- Kosuri S, Eroshenko N, Leproust EM, Super M, Way J, Li JB, Church GM (2010) Scalable gene synthesis by selective amplification of DNA pools from high‐fidelity microchips. Nat Biotechnol 28: 1295–1299 [DOI] [PMC free article] [PubMed] [Google Scholar]
- Kosuri S, Goodman DB, Cambray G, Mutalik VK, Gao Y, Arkin AP, Endy D, Church GM (2013) Composability of regulatory sequences controlling transcription and translation in Escherichia coli . Proc Natl Acad Sci USA 110: 14024–14029 [DOI] [PMC free article] [PubMed] [Google Scholar]
- Krulwich TA, Sachs G, Padan E (2011) Molecular aspects of bacterial pH sensing and homeostasis. Nat Rev Microbiol 9: 330–343 [DOI] [PMC free article] [PubMed] [Google Scholar]
- Landry BP, Palanki R, Dyulgyarov N, Hartsough LA, Tabor JJ (2018) Phosphatase activity tunes two‐component system sensor detection threshold. Nat Commun 9: 1433 [DOI] [PMC free article] [PubMed] [Google Scholar]
- Lawson CL, Swigon D, Murakami KS, Darst SA, Berman HM, Ebright RH (2004) Catabolite activator protein: DNA binding and transcription activation. Curr Opin Struct Biol 14: 10–20 [DOI] [PMC free article] [PubMed] [Google Scholar]
- Li H, Durbin R (2009) Fast and accurate short read alignment with Burrows‐Wheeler transform. Bioinformatics 25: 1754–1760 [DOI] [PMC free article] [PubMed] [Google Scholar]
- Liang Q, Zhang H, Li S, Qi Q (2011) Construction of stress‐induced metabolic pathway from glucose to 1,3‐propanediol in Escherichia coli . Appl Microbiol Biotechnol 89: 57–62 [DOI] [PubMed] [Google Scholar]
- Libis V, Delepine B, Faulon JL (2016) Sensing new chemicals with bacterial transcription factors. Curr Opin Microbiol 33: 105–112 [DOI] [PubMed] [Google Scholar]
- Liu D, Evans T, Zhang F (2015) Applications and advances of metabolite biosensors for metabolic engineering. Metab Eng 31: 35–43 [DOI] [PubMed] [Google Scholar]
- Liu H, Lu T (2015) Autonomous production of 1,4‐butanediol via a de novo biosynthesis pathway in engineered Escherichia coli . Metab Eng 29: 135–141 [DOI] [PubMed] [Google Scholar]
- Liu D, Bentley GJ, Chu K, Zhang F (2016) Design of dynamic pathways In Biotechnology for biofuel production and optimization, Eckert CA, Trinh CT. (eds), Vol. 7, pp 165–200. Boston, MA: Elsevier; [Google Scholar]
- Liu D, Zhang F (2018) Metabolic feedback circuits provide rapid control of metabolite dynamics. ACS Synth Biol 7: 347–356 [DOI] [PubMed] [Google Scholar]
- Lo TM, Chng SH, Teo WS, Cho HS, Chang MW (2016) A two‐layer gene circuit for decoupling cell growth from metabolite production. Cell Syst 3: 133–143 [DOI] [PubMed] [Google Scholar]
- Lou C, Stanton B, Chen YJ, Munsky B, Voigt CA (2012) Ribozyme‐based insulator parts buffer synthetic circuits from genetic context. Nat Biotechnol 30: 1137–1142 [DOI] [PMC free article] [PubMed] [Google Scholar]
- Lv L, Ren YL, Chen JC, Wu Q, Chen GQ (2015) Application of CRISPRi for prokaryotic metabolic engineering involving multiple genes, a case study: controllable P(3HB‐co‐4HB) biosynthesis. Metab Eng 29: 160–168 [DOI] [PubMed] [Google Scholar]
- Mangan S, Itzkovitz S, Zaslaver A, Alon U (2006) The incoherent feed‐forward loop accelerates the response‐time of the gal system of Escherichia coli . J Mol Biol 356: 1073–1081 [DOI] [PubMed] [Google Scholar]
- Mannan AA, Liu D, Zhang F, Oyarzun DA (2017) Fundamental design principles for transcription‐factor‐based metabolite biosensors. ACS Synth Biol 6: 1851–1859 [DOI] [PubMed] [Google Scholar]
- March JC, Bentley WE (2004) Quorum sensing and bacterial cross‐talk in biotechnology. Curr Opin Biotechnol 15: 495–502 [DOI] [PubMed] [Google Scholar]
- McGinness KE, Baker TA, Sauer RT (2006) Engineering controllable protein degradation. Mol Cell 22: 701–707 [DOI] [PubMed] [Google Scholar]
- Michener JK, Thodey K, Liang JC, Smolke CD (2012) Applications of genetically‐encoded biosensors for the construction and control of biosynthetic pathways. Metab Eng 14: 212–222 [DOI] [PMC free article] [PubMed] [Google Scholar]
- Min BE, Hwang HG, Lim HG, Jung GY (2017) Optimization of industrial microorganisms: recent advances in synthetic dynamic regulators. J Ind Microbiol Biotechnol 44: 89–98 [DOI] [PubMed] [Google Scholar]
- Moon TS, Clarke EJ, Groban ES, Tamsir A, Clark RM, Eames M, Kortemme T, Voigt CA (2011) Construction of a genetic multiplexer to toggle between chemosensory pathways in Escherichia coli . J Mol Biol 406: 215–227 [DOI] [PMC free article] [PubMed] [Google Scholar]
- Moon TS, Lou C, Tamsir A, Stanton BC, Voigt CA (2012) Genetic programs constructed from layered logic gates in single cells. Nature 491: 249–253 [DOI] [PMC free article] [PubMed] [Google Scholar]
- Morgan SA, Nadler DC, Yokoo R, Savage DF (2016) Biofuel metabolic engineering with biosensors. Curr Opin Chem Biol 35: 150–158 [DOI] [PMC free article] [PubMed] [Google Scholar]
- Morse NJ, Alper HS (2016) Gene expression engineering In Metabolic engineering for bioprocess commercialization, Van Dien S. (ed.), Vol. 2, pp 7–30. Basel: Springer International Publishing; [Google Scholar]
- Moser F, Broers NJ, Hartmans S, Tamsir A, Kerkman R, Roubos JA, Bovenberg R, Voigt CA (2012) Genetic circuit performance under conditions relevant for industrial bioreactors. ACS Synth Biol 1: 555–564 [DOI] [PMC free article] [PubMed] [Google Scholar]
- Moser F, Horwitz A, Chen J, Lim W, Voigt CA (2013) Genetic sensor for strong methylating compounds. ACS Synth Biol 2: 614–624 [DOI] [PMC free article] [PubMed] [Google Scholar]
- Mutalik VK, Guimaraes JC, Cambray G, Lam C, Christoffersen MJ, Mai QA, Tran AB, Paull M, Keasling JD, Arkin AP, Endy D (2013) Precise and reliable gene expression via standard transcription and translation initiation elements. Nat Methods 10: 354–360 [DOI] [PubMed] [Google Scholar]
- Na D, Yoo SM, Chung H, Park H, Park JH, Lee SY (2013) Metabolic engineering of Escherichia coli using synthetic small regulatory RNAs. Nat Biotechnol 31: 170–174 [DOI] [PubMed] [Google Scholar]
- Neumann P, Weidner A, Pech A, Stubbs MT, Tittmann K (2008) Structural basis for membrane binding and catalytic activation of the peripheral membrane enzyme pyruvate oxidase from Escherichia coli . Proc Natl Acad Sci USA 105: 17390–17395 [DOI] [PMC free article] [PubMed] [Google Scholar]
- Nevoigt E, Fischer C, Mucha O, Matthaus F, Stahl U, Stephanopoulos G (2007) Engineering promoter regulation. Biotechnol Bioeng 96: 550–558 [DOI] [PubMed] [Google Scholar]
- Nielsen AA, Der BS, Shin J, Vaidyanathan P, Paralanov V, Strychalski EA, Ross D, Densmore D, Voigt CA (2016) Genetic circuit design automation. Science 352: aac7341 [DOI] [PubMed] [Google Scholar]
- Oyarzun DA, Stan GB (2013) Synthetic gene circuits for metabolic control: design trade‐offs and constraints. J R Soc Interface 10: 20120671 [DOI] [PMC free article] [PubMed] [Google Scholar]
- Park JH, Lee KH, Kim TY, Lee SY (2007) Metabolic engineering of Escherichia coli for the production of L‐valine based on transcriptome analysis and in silico gene knockout simulation. Proc Natl Acad Sci USA 104: 7797–7802 [DOI] [PMC free article] [PubMed] [Google Scholar]
- Pham HL, Wong A, Chua N, Teo WS, Yew WS, Chang MW (2017) Engineering a riboswitch‐based genetic platform for the self‐directed evolution of acid‐tolerant phenotypes. Nat Commun 8: 411 [DOI] [PMC free article] [PubMed] [Google Scholar]
- Price ND, Reed JL, Palsson BO (2004) Genome‐scale models of microbial cells: evaluating the consequences of constraints. Nat Rev Microbiol 2: 886–897 [DOI] [PubMed] [Google Scholar]
- Qi LS, Larson MH, Gilbert LA, Doudna JA, Weissman JS, Arkin AP, Lim WA (2013) Repurposing CRISPR as an RNA‐guided platform for sequence‐specific control of gene expression. Cell 152: 1173–1183 [DOI] [PMC free article] [PubMed] [Google Scholar]
- Qian S, Cirino PC (2016) Using metabolite‐responsive gene regulators to improve microbial biosynthesis. Curr Opin Chem Eng 14: 93–102 [Google Scholar]
- Rajkumar AS, Liu G, Bergenholm D, Arsovska D, Kristensen M, Nielsen J, Jensen MK, Keasling JD (2016) Engineering of synthetic, stress‐responsive yeast promoters. Nucleic Acids Res 44: e136 [DOI] [PMC free article] [PubMed] [Google Scholar]
- Rantasalo A, Czeizler E, Virtanen R, Rousu J, Lahdesmaki H, Penttila M, Jantti J, Mojzita D (2016) Synthetic transcription amplifier system for orthogonal control of gene expression in Saccharomyces cerevisiae . PLoS One 11: e0148320 [DOI] [PMC free article] [PubMed] [Google Scholar]
- Robinson MD, Oshlack A (2010) A scaling normalization method for differential expression analysis of RNA‐seq data. Genome Biol 11: R25 [DOI] [PMC free article] [PubMed] [Google Scholar]
- Rogers JK, Guzman CD, Taylor ND, Raman S, Anderson K, Church GM (2015) Synthetic biosensors for precise gene control and real‐time monitoring of metabolites. Nucleic Acids Res 43: 7648–7660 [DOI] [PMC free article] [PubMed] [Google Scholar]
- Rogers JK, Church GM (2016) Genetically encoded sensors enable real‐time observation of metabolite production. Proc Natl Acad Sci USA 113: 2388–2393 [DOI] [PMC free article] [PubMed] [Google Scholar]
- Ryo S, Ishii J, Matsuno T, Nakamura Y, Matsubara D, Tominaga M, Kondo A (2017) Positive feedback genetic circuit incorporating a constitutively active mutant Gal3 into yeast GAL induction system. ACS Synth Biol 6: 928–935 [DOI] [PubMed] [Google Scholar]
- Saier MH Jr, Ramseier TM (1996) The catabolite repressor/activator (Cra) protein of enteric bacteria. J Bacteriol 178: 3411–3417 [DOI] [PMC free article] [PubMed] [Google Scholar]
- San KY, Stephanopoulos G (1984) A note on the optimality criteria for maximum biomass production in a fed‐batch fermentor. Biotechnol Bioeng 26: 1261–1264 [DOI] [PubMed] [Google Scholar]
- Schellenberger J, Que R, Fleming RM, Thiele I, Orth JD, Feist AM, Zielinski DC, Bordbar A, Lewis NE, Rahmanian S, Kang J, Hyduke DR, Palsson BO (2011) Quantitative prediction of cellular metabolism with constraint‐based models: the COBRA Toolbox v2.0. Nat Protoc 6: 1290–1307 [DOI] [PMC free article] [PubMed] [Google Scholar]
- Segall‐Shapiro TH, Meyer AJ, Ellington AD, Sontag ED, Voigt CA (2014) A ‘resource allocator’ for transcription based on a highly fragmented T7 RNA polymerase. Mol Syst Biol 10: 742 [DOI] [PMC free article] [PubMed] [Google Scholar]
- Shalel‐Levanon S, San KY, Bennett GN (2005) Effect of oxygen, and ArcA and FNR regulators on the expression of genes related to the electron transfer chain and the TCA cycle in Escherichia coli . Metab Eng 7: 364–374 [DOI] [PubMed] [Google Scholar]
- Shen‐Orr SS, Milo R, Mangan S, Alon U (2002) Network motifs in the transcriptional regulation network of Escherichia coli . Nat Genet 31: 64–68 [DOI] [PubMed] [Google Scholar]
- Shetty RP, Endy D, Knight TF Jr (2008) Engineering BioBrick vectors from BioBrick parts. J Biol Eng 2: 5 [DOI] [PMC free article] [PubMed] [Google Scholar]
- Siedler S, Schendzielorz G, Binder S, Eggeling L, Bringer S, Bott M (2014) SoxR as a single‐cell biosensor for NADPH‐consuming enzymes in Escherichia coli . ACS Synth Biol 3: 41–47 [DOI] [PubMed] [Google Scholar]
- Siu Y, Fenno J, Lindle JM, Dunlop MJ (2018) Design and selection of a synthetic feedback loop for optimizing biofuel tolerance. ACS Synth Biol 7: 16–23 [DOI] [PubMed] [Google Scholar]
- Sleight SC, Bartley BA, Lieviant JA, Sauro HM (2010) Designing and engineering evolutionary robust genetic circuits. J Biol Eng 4: 12 [DOI] [PMC free article] [PubMed] [Google Scholar]
- Slusarczyk AL, Lin A, Weiss R (2012) Foundations for the design and implementation of synthetic genetic circuits. Nat Rev Genet 13: 406–420 [DOI] [PubMed] [Google Scholar]
- Solomon KV, Sanders TM, Prather KL (2012) A dynamic metabolite valve for the control of central carbon metabolism. Metab Eng 14: 661–671 [DOI] [PubMed] [Google Scholar]
- Soma Y, Tsuruno K, Wada M, Yokota A, Hanai T (2014) Metabolic flux redirection from a central metabolic pathway toward a synthetic pathway using a metabolic toggle switch. Metab Eng 23: 175–184 [DOI] [PubMed] [Google Scholar]
- Soma Y, Hanai T (2015) Self‐induced metabolic state switching by a tunable cell density sensor for microbial isopropanol production. Metab Eng 30: 7–15 [DOI] [PubMed] [Google Scholar]
- Song M, Sukovich DJ, Ciccarelli L, Mayr J, Fernandez‐Rodriguez J, Mirsky EA, Tucker AC, Gordon DB, Marlovits TC, Voigt CA (2017) Control of type III protein secretion using a minimal genetic system. Nat Commun 8: 14737 [DOI] [PMC free article] [PubMed] [Google Scholar]
- Stanton BC, Nielsen AA, Tamsir A, Clancy K, Peterson T, Voigt CA (2014a) Genomic mining of prokaryotic repressors for orthogonal logic gates. Nat Chem Biol 10: 99–105 [DOI] [PMC free article] [PubMed] [Google Scholar]
- Stanton BC, Siciliano V, Ghodasara A, Wroblewska L, Clancy K, Trefzer AC, Chesnut JD, Weiss R, Voigt CA (2014b) Systematic transfer of prokaryotic sensors and circuits to mammalian cells. ACS Synth Biol 3: 880–891 [DOI] [PMC free article] [PubMed] [Google Scholar]
- Tabor JJ, Salis HM, Simpson ZB, Chevalier AA, Levskaya A, Marcotte EM, Voigt CA, Ellington AD (2009) A synthetic genetic edge detection program. Cell 137: 1272–1281 [DOI] [PMC free article] [PubMed] [Google Scholar]
- Tang SY, Cirino PC (2011) Design and application of a mevalonate‐responsive regulatory protein. Angew Chem Int Ed Engl 50: 1084–1086 [DOI] [PubMed] [Google Scholar]
- Tasaki T, Sriram SM, Park KS, Kwon YT (2012) The N‐end rule pathway. Annu Rev Biochem 81: 261–289 [DOI] [PMC free article] [PubMed] [Google Scholar]
- Temme K, Hill R, Segall‐Shapiro TH, Moser F, Voigt CA (2012) Modular control of multiple pathways using engineered orthogonal T7 polymerases. Nucleic Acids Res 40: 8773–8781 [DOI] [PMC free article] [PubMed] [Google Scholar]
- Tian T, Salis HM (2015) A predictive biophysical model of translational coupling to coordinate and control protein expression in bacterial operons. Nucleic Acids Res 43: 7137–7151 [DOI] [PMC free article] [PubMed] [Google Scholar]
- Tsao CY, Hooshangi S, Wu HC, Valdes JJ, Bentley WE (2010) Autonomous induction of recombinant proteins by minimally rewiring native quorum sensing regulon of E. coli . Metab Eng 12: 291–297 [DOI] [PubMed] [Google Scholar]
- Wang B, Kitney RI, Joly N, Buck M (2011) Engineering modular and orthogonal genetic logic gates for robust digital‐like synthetic biology. Nat Commun 2: 508 [DOI] [PMC free article] [PubMed] [Google Scholar]
- Wang B, Barahona M, Buck M (2013) A modular cell‐based biosensor using engineered genetic logic circuits to detect and integrate multiple environmental signals. Biosens Bioelectron 40: 368–376 [DOI] [PMC free article] [PubMed] [Google Scholar]
- Wang B, Barahona M, Buck M (2015) Amplification of small molecule‐inducible gene expression via tuning of intracellular receptor densities. Nucleic Acids Res 43: 1955–1964 [DOI] [PMC free article] [PubMed] [Google Scholar]
- Weber H, Polen T, Heuveling J, Wendisch VF, Hengge R (2005) Genome‐wide analysis of the general stress response network in Escherichia coli: sigmaS‐dependent genes, promoters, and sigma factor selectivity. J Bacteriol 187: 1591–1603 [DOI] [PMC free article] [PubMed] [Google Scholar]
- Weidner A, Neumann P, Wille G, Stubbs MT, Tittmann K (2008) Crystallization and preliminary X‐ray diffraction analysis of full‐length and proteolytically activated pyruvate oxidase from Escherichia coli . Acta Crystallogr Sect F Struct Biol Cryst Commun 64: 179–181 [DOI] [PMC free article] [PubMed] [Google Scholar]
- Werner S, Engler C, Weber E, Gruetzner R, Marillonnet S (2012) Fast track assembly of multigene constructs using Golden Gate cloning and the MoClo system. Bioeng Bugs 3: 38–43 [DOI] [PubMed] [Google Scholar]
- Wolfe AJ (2005) The acetate switch. Microbiol Mol Biol Rev 69: 12–50 [DOI] [PMC free article] [PubMed] [Google Scholar]
- Wu J, Du G, Chen J, Zhou J (2015) Enhancing flavonoid production by systematically tuning the central metabolic pathways based on a CRISPR interference system in Escherichia coli . Sci Rep 5: 13477 [DOI] [PMC free article] [PubMed] [Google Scholar]
- Xie W, Ye L, Lv X, Xu H, Yu H (2015) Sequential control of biosynthetic pathways for balanced utilization of metabolic intermediates in Saccharomyces cerevisiae . Metab Eng 28: 8–18 [DOI] [PubMed] [Google Scholar]
- Xu P, Li L, Zhang F, Stephanopoulos G, Koffas M (2014) Improving fatty acids production by engineering dynamic pathway regulation and metabolic control. Proc Natl Acad Sci USA 111: 11299–11304 [DOI] [PMC free article] [PubMed] [Google Scholar]
- You L, Cox RS III, Weiss R, Arnold FH (2004) Programmed population control by cell‐cell communication and regulated killing. Nature 428: 868–871 [DOI] [PubMed] [Google Scholar]
- Young EM, Zhao Z, Gielesen BEM, Wu L, Benjamin Gordon D, Roubos JA, Voigt CA (2018) Iterative algorithm‐guided design of massive strain libraries, applied to itaconic acid production in yeast. Metab Eng 48: 33–43 [DOI] [PubMed] [Google Scholar]
- Yuan J, Ching CB (2015) Dynamic control of ERG9 expression for improved amorpha‐4,11‐diene production in Saccharomyces cerevisiae . Microb Cell Fact 14: 38 [DOI] [PMC free article] [PubMed] [Google Scholar]
- Zalatan JG, Lee ME, Almeida R, Gilbert LA, Whitehead EH, La Russa M, Tsai JC, Weissman JS, Dueber JE, Qi LS, Lim WA (2015) Engineering complex synthetic transcriptional programs with CRISPR RNA scaffolds. Cell 160: 339–350 [DOI] [PMC free article] [PubMed] [Google Scholar]
- Zaslaver A, Mayo AE, Rosenberg R, Bashkin P, Sberro H, Tsalyuk M, Surette MG, Alon U (2004) Just‐in‐time transcription program in metabolic pathways. Nat Genet 36: 486–491 [DOI] [PubMed] [Google Scholar]
- Zhang YX, Perry K, Vinci VA, Powell K, Stemmer WP, del Cardayre SB (2002) Genome shuffling leads to rapid phenotypic improvement in bacteria. Nature 415: 644–646 [DOI] [PubMed] [Google Scholar]
- Zhang F, Carothers JM, Keasling JD (2012) Design of a dynamic sensor‐regulator system for production of chemicals and fuels derived from fatty acids. Nat Biotechnol 30: 354–359 [DOI] [PubMed] [Google Scholar]
- Zhang J, Jensen MK, Keasling JD (2015) Development of biosensors and their application in metabolic engineering. Curr Opin Chem Biol 28: 1–8 [DOI] [PubMed] [Google Scholar]
- Zhou YJ, Hu Y, Zhu Z, Siewers V, Nielsen J (2018) Engineering 1‐alkene biosynthesis and secretion by dynamic regulation in yeast. ACS Synth Biol 7: 584–590 [DOI] [PubMed] [Google Scholar]
Associated Data
This section collects any data citations, data availability statements, or supplementary materials included in this article.
Supplementary Materials
Appendix
Review Process File
Data Availability Statement
Full annotated plasmid sequences, code for generating promoter libraries, and detailed descriptions of promoter sequences are provided in the authors’ Github repository (https://github.com/VoigtLab/promoter-library-design-tool). Additional data is available upon request.