Abstract
We examined the effect of a high fat diet (HFD) versus control diet (CD) upon pregestational and gestational wild type (wt) and glucose transporter (glut)3 heterozygous (glut3+/−) female mice and observed an increase in pre-gestational body weights, white adiposity (wt>glut3+/−), circulating cholesterol and high density lipoproteins, with glucose intolerance in both genotypes. The HFD exposed offspring displayed reduced birth weight with catch up to CD-fed in wt versus an increased birth weight persisting as such at weaning by day 21 in glut3+/− mice. To decipher the mechanism behind this genotype specific difference in the HFD offspring’s phenotype, we first examined placental macronutrient transporters and noted HFD induced increase in CD36 in wt with no change in other FATPs, SNATs and LAT2 in both genotypes. In contrast, while placental Glut1 increased in both the genotypes, only Glut3 increased in the glut3+/− genotype in response to HFD. Hence we next assessed glut3+/− embryonic (ES) cells under differing stressors of low glucose, hypoxia and inhibition of oxidative phosphorylation. Reduced Glut3 mediated glucose uptake in glut3+/− versus wt ES cells culminated in deficient growth. We conclude that maternal HFD affects the in-utero growth potential of the offspring by altering placental CD36 and Glut1 concentrations. In contrast, a differential effect on placental Glut3 concentrations between glut3+/− and wt genotypes is evident, with an increase occurring in the glut3+/− genotype alone. Deficient Glut3 in ES cells interferes with glucose uptake, cell survival and growth being further exaggerated with low glucose, hypoxia and inhibition of oxidative phosphorylation.
Keywords: Glucose transporters, fatty acid transporters, amino acid transporters, embryonic stem cells
Introduction
High caloric dietary intake along with escalating sedentary life style has caused an epidemic of Obesity and Diabetes Mellitus [1–3]. To mimic this human situation, many investigator groups have examined the effect of a high fat or high carbohydrate diet in various wild type animal models from mice to baboons [4–6]. The effect of a high fat diet during pregnancy can not only affect the mother but also the offspring immediately and on a long term basis [7–10]. Given this paradigm, it behooves us to determine the mechanisms and the impact of such a diet not just on the pregnant state but also on the pre-gestational stage when the female prepares for pregnancy. In order to have a good pregnancy outcome, it is imperative to ensure good pre-gestational health. In humans, pre-gestational body weight and body mass index determine the outcome of pregnancy and health of the offspring [11–13]. To this end, we hypothesized that a high fat diet during the pre-gestational and gestational stages affects placental macronutrient transporter proteins which in turn influence the outcome of the offspring. We tested this hypothesis first in wild type mice.
In addition to the dietary intake of a high fat diet, prenatal and postnatal programming due to perturbed maternal metabolism has also led to adult onset adiposity and glucose intolerance in the offspring [14, 15]. While multiple investigations have shown this paradigm in humans and various animal studies [15–18], we have also demonstrated such an occurrence in genetically modified mice [19, 20]. Employing such genetically modified mice (glut1+/− and glut3+/−), our previous investigations, while not demonstrating a significant role for glucose transporter isoform 1 (Glut1) [21], revealed a key role for Glut3 in mediating murine trans-placental glucose transport [21, 22]. Thus, focusing on glut3 heterozygous null mice, we observed metabolic programming [19, 21]. At 9–11 months of age while these mice were aging we encountered obesity, glucose intolerance, insulin resistance and a fatty liver, in response to reduced trans-placental glucose transport in fueling the developing fetus [23]. These findings supported a metabolic programming effect while mothers and the offspring were maintained on an ad lib fed regular chow diet. Given these previous observations, we put forth a second part to our hypothesis that a high fat diet in pre-gestational and gestational glut3 heterozygous mice will exacerbate the outcome of pregnancies and the offspring. To test this second part of the hypothesis, we engaged glut3+/− mice and exposed them to a high fat diet during pre-gestational and gestational stages in females, and examined placental macronutrient transporters and body weights of the suckling offspring. Based upon our glut3+/− placental results that revealed enhanced Glut3 protein expression with enhanced fetal/postnatal size upon pre-gestational and gestational exposure to a high fat diet, we subsequently investigated the proliferative growth capacity and glucose uptake in wild type and glut3+/− embryonic stem cells under control and differing stressing conditions (low glucose, low oxygen and inhibited oxidative metabolism), encountered by pre-implantation embryos as they enter the uterus soon after conception.
Materials and Methods
Animals and diets
Glut3 heterozygous (glut3+/−) and wild-type C57/BL6 female mice were housed in 12-h light, 12-h dark cycle with ad libitum access to a standard rodent chow (TD. 06414, Harlan Teklad Laboratories, Indianapolis, IN, 59% energy from carbohydrates [58.5%Kcals], 21% from protein [18.4%Kcals] and 7% from fat [10%Kcals]) and water till four weeks of age. At an age of four weeks, both wild type (wt) and glut3+/− female mice were fed a high fat diet (TD. 06414, Harlan Teklad Laboratories, Indianapolis; IN, 27% energy from carbohydrates [21.3%Kcals], 23% from protein [18.4%Kcals] and 34% from fat [60.3 %Kcals]) while another group of wt and glut3+/− ice remained on the regular chow diet for a period of eight weeks. At the end of twelve weeks in age both the high fat and chow fed females were mated with chow fed males. Presence of a copulatory plug was designated gestational d1. At gestational day (GD) 19, animals were euthanized by receiving 100 mg/kg of intraperitoneal phenobarbital. Protocols for the care and use of mice were approved by the Animal Research Committee of the University of California Los Angeles (UCLA) along the guidelines set by the National Institutes of Health.
Body and organ weight
Pre-gestational and gestational adult body weights were measured using an Ohaus Scout Pro Balance scale (Pleasant Prairie, WI). In addition, gestation d19 pups and placenta weights and other maternal organ weights consisting of liver, brain, heart, and adipose tissue were also assessed.
Body composition
Whole body fat and lean mass were assessed in not anesthetized freely moving three month (12 weeks) old female wt (glut3+/+) and glut3+/− mice using 1H-magnetic resonance spectroscopy (Bruker minispectroscopy analyzer; Echo Medical Systems, Houston, TX) as previously described [23].
Glucose and insulin tolerance tests
Following an overnight fast, 3-mo-old wt and glut3+/− female mice received either Dglucose (1 g/kg body wt) or insulin (0.5 U/kg body wt of pharmaceutical grade; NovoNordisk, Clayton, NC) intraperitoneally. Tail vein blood samples were collected at 0, 15, 30, 45, 60, 75, 105, and 120 min and blood glucose concentrations assessed using the Hemocue system (Mission Viejo, CA) as previously reported [20].
Placental Transporter protein studies
Glucose and System L amino acid transporter expression:
Placentas at d19.5 gestation were individually collected, weighed (accuracy of 0.01 mg), snap frozen, and stored at −80°C. Placentas were homogenized, solubilized in a lysate buffer, and protein concentration determined by the Bio-Rad dye-binding assay (Bio-Rad Laboratories, Hercules, CA). Western blots were performed as described previously [20]. Placental Glut1 and Glut3 (20 μg) and LAT2 (50 μg) proteins were assessed by subjecting homogenates to 10% SDS-PAGE and transferring to nitrocellulose membranes (Transblot; Bio-Rad Laboratories). The primary antibody consisted of an affinity-purified rabbit anti-mouse Glut3 or Glut1 IgG that was generated and previously characterized by us [24, 25]. The primary anti-mouse Glut3, the anti-mouse Glut1 and anti-LAT2 (SC 27581; Santa Cruz Biotechnology, Santa Cruz, CA) antibody incubations were carried out in a 1:1000 dilution for 2h at room temperature. The secondary antibody consisted of a horseradish peroxidase-conjugated anti-rabbit antibody (Glut1 and Glut3 = 1:2500; LAT2 = 1:1000) that allowed detection of the immuno-reactive protein bands by enhanced chemiluminescence (GE Healthcare Bio-Sciences, Uppsala, Sweden). Proteins were normalized to vinculin and quantification was performed using the image Quant 5.2 software (GE Healthcare Biosciences, Piscataway, NJ).
Placental sodium-coupled neutral amino acid and fatty acid transporter expression
Sodium coupled neutral amino acid and fatty acid transporters were assessed by subjecting solubilized protein homogenates (50 μg) to electrophoresis using 10% SDS-polyacrylamide gels and transferred to nitrocellulose membranes (Transblot; Bio-Rad, Hercules, CA). Membranes were blocked with 5% bovine milk for an hour then probed overnight at 4°C with antibodies against either FATP1 (SC-25541), FATP4 (SC-25670), CD36 (AB 36977), SNAT2 (SC-166316) or SNAT4 (SC-67086). The secondary antibody consisted of a horseradish peroxidase-conjugated antibody (1:2500 dilution) that allowed detection of the immunoreactive protein bands by enhanced chemiluminescence. Proteins were normalized to vinculin (internal control) and quantification was performed using the image Quant 5.2 software (GE Healthcare Biosciences, Piscataway, NJ).
Northern Blot Analysis of glut mRNA in embryonic stem (ES) cells
Poly(A+)-enriched RNA was extracted per manufacturer's instructions, using an oligotex mRNA extraction minikit (Qiagen, Valencia, CA) from glut3 targeted (+/−) and non-targeted (+/+) ES cells. Extracted mRNA (2 μg) was subjected to Northern blot analysis as previously described [20]. Following electrophoresis overnight of RNA on a 1% agarose gel, transfer to nylon membranes (Amersham, Hybond N+; Buckinghamshire, U.K.), and UV cross-linking, the blots were pre-hybridized for 2 h at 42°C and subsequently hybridized overnight at 42°C with the radiolabeled probe, namely the 32P-labeled murine glut3 cDNA (230bp, GenBank no. X61093.1) which served as the probe. The blots were then washed twice in 40 mM sodium phosphate (pH 7.2) solution containing 1% SDS and 1 mM EDTA at 42°C for 30 min each [20]. These washed blots were then exposed to X-ray film (Kodak Biomax, Rochester, NY.) in the presence of intensifying screens at −80°C. The same blots were stripped in 0.1% SDS at 100°C for 3–5 min and re-hybridized to the full-length murine glut1 cDNA (600bp, GenBank no. D10231.1) [20] and subsequently to a full-length gapdh probe (140bp, GenBank: AY618199.1) that served as the internal control to standardize interlane loading variability. mRNA band density was assessed by densitometry using the Scion Image software program after ensuring that the resultant optical density was linear to the loading mRNA concentrations.
Western Blot Analysis of Glut proteins in ES cells
Solubilized protein homogenates (25 μg) from glut3 targeted and non-targeted ES cells and embryonic fibroblast feeder (EF) layer cells were subjected to electrophoresis on 10% SDS-polyacrylamide gels and transferred to nitrocellulose membranes. Membranes were blocked overnight in 5% bovine milk at 4°C and then incubated with an affinity-purified rabbit anti-mouse Glut3 or Glut1 IgG that was generated and previously characterized by us [24, 25]. Additional antibodies for Glut4 (ab 654) and Glut8 (ab 169779) were also used for immunoblotting glut3+/+ and glut3+/− cells. The secondary antibody consisted of a horseradish peroxidase-conjugated antibody (1:2500) which allowed detection of the immunoreactive protein bands by enhanced chemiluminescence. Proteins were normalized to vinculin (internal control) and the intensity of the protein bands was assessed by densitometry using the Scion Image software program after ensuring that the resultant optical density was linear to the protein concentration.
ES Cell Proliferation Curve:
Both glut3 targeted and non-targeted ES cells were seeded (1×10³/well) in 96 wells of gelatinized (0.1%) culture plates and allowed to proliferate and grow in Knockout DMEM containing high glucose (25 mM), LIF and 15% FBS supplemented with 1% penicillin and streptomycin over 1 to 8 days duration. Cells were collected every second day, cell counts performed in a hemocytometer (0.1% trypan blue was used to identify dead cells that were removed), and the proliferation curves were plotted to compare the rates between glut3 (+/+) and (+/−) ES cells.
Stimulation of Glycolysis in ES cells by Inhibition of Oxidative Phosphorylation
Equal number of cells were seeded onto each 60 mm culture dishes in knockout DMEM containing 15% FBS and LIF. Once cells were confluent, the medium was replaced by fresh medium with 5 mM sodium azide (Sigma-Aldrich, St. Louis, Mo.) which inhibits oxidative phosphorylation, by inhibiting mitochondrial complex IV respiratory electron chain, and thereby stimulates glycolysis. Cells were incubated for 12 hr after which the supernatant was removed and cells were washed twice with ice-cold PBS, lysed in cell lysis buffer, and subjected to Western blot analysis where cell lysates transferred to nitrocellulose membranes were probed for Glut1 and Glut3 proteins.
Hypoxia studies in ES cells
Both the glut3+/+ and glut3+/− ES cells were grown in 60 mm culture dishes containing DMEM with 15% FBS, and maintained within an airtight chamber at 37°C containing 20% O2, 5% CO2 and 75% nitrogen (normoxia). Reduction of oxygen to 3% was achieved by bleeding in nitrogen to achieve 92%, and 5% CO2 (hypoxia). Cells were cultured for 24, 48 and 72 hours under normoxia or hypoxia conditions. After removal of the supernatant, cells were washed in ice-cold PBS, trypsin treated and subjected to Western blot analysis to detect Glut1 and Glut3 proteins.
Glucose studies in ES cells
glut3+/+ and glut3+/− embryonic stem cells were cultured in Knock Out DMEM containing high glucose (25 mM) supplemented with 15% FBS and 1% penicillin-streptomycin in a humidified incubator at 37°C in an atmosphere of 5% CO2 and 95% air. Once cells were confluent, they were washed twice with PBS then incubated in low glucose (2.5 mM) over varying durations. These cells were then lysed in cell lysis buffer (Cell Signaling Technology, Denvers, MA), supplemented with 1 % phosphatase and protease inhibitor cocktail (Cell Signaling Technology, Danvers, MA). The cell lysates (30 μg) were subjected to Western Blot analysis as described above. Next glucose uptake experiments were performed under a similar concentration of glucose (2.5 mM) over varying durations. Briefly upon achieving confluence in 24 hours by the cultured ES cells, the cells were washed twice with PBS prior to adding 2.5 mM glucose and 0.1 μCi/ml of 2-deoxy-d-[1-14C] glucose (PerkinElmer, Boston, MA) in PBS, followed by rapid removal of the isotope at differing time points. The cultured cells were immediately washed twice with ice-cold PBS, trypsin treated, washed again and suspended in 1N NaOH. Protein content was assessed by the BioRad dye-binding assay and radioactivity assessed in a scintillation counter, following which glucose uptake rates per unit protein were calculated for glut3+/+ and glut3+/− ES cells.
Data analysis
All data are shown as mean±SEM. Comparison between two groups was done by the Student’s t-test in the presence of a normal distribution, or by the Mann-Whitney rank sum test in the absence of a normal distribution. Comparison of four groups simultaneously (e.g. wt-chow diet, wt-high fat diet, glut3+/−-chow diet, glut3+/−-high fat diet) was undertaken by the one-way ANOVA followed by the Fisher’s PLSD post-hoc test to determine inter-group differences. Significance was assigned at a p<0.05. All statistical analyses were performed using Sigmastat 3.5 software (Systat Point, Richmond,CA).
Results
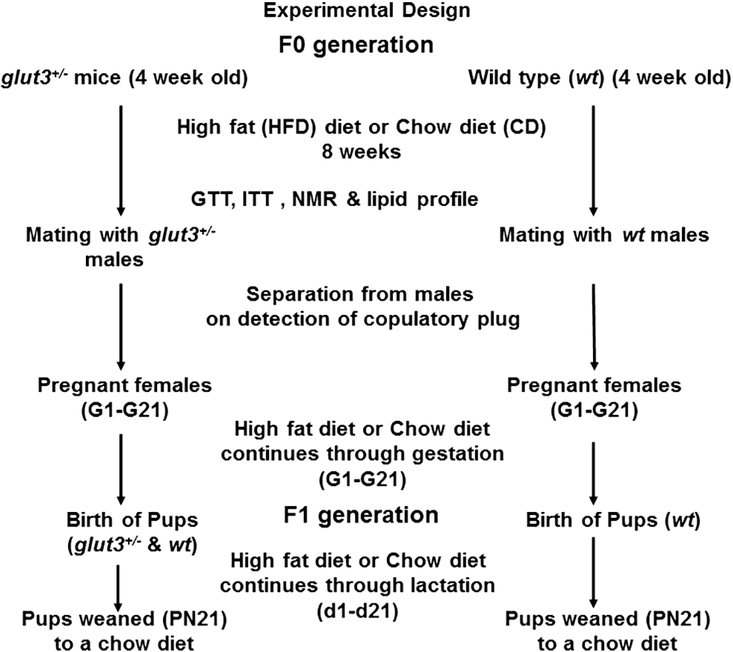
Figure 1 depicts the study design demonstrating introduction of a high fat diet or regular chow diet eight weeks prior to mating during the pre-gestational period in female wt and glut3+/− mice. The respective diets were continued throughout pregnancy and lactation in the female mice and at weaning the offspring from both groups were placed on a regular chow diet.
Figure 1. Schematic diagram depicting the experimental design:
Two genotypes wild type (wt) and glut3+/− females were fed either a high fat diet (HFD) or regular chow diet (CD) (n=8–10/group) over a period of eight weeks prior to mating with males. These diets were continued through pregnancy and lactation and the pups were subsequently weaned to a regular chow diet. Studies done during the pre-gestational period are shown. GTT = glucose tolerance test, ITT = insulin tolerance test, NMR = nuclear magnetic resonance.
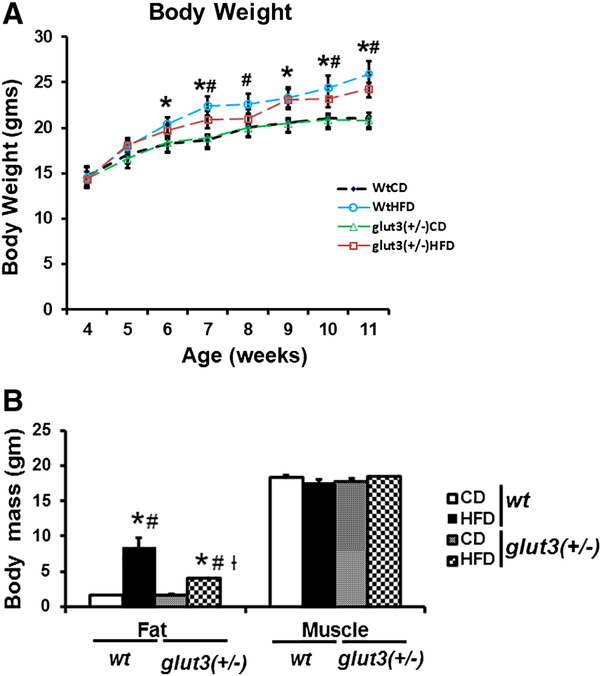
Figure 2A demonstrates the body weight gain of the pre-gestational females. High fat diet in wild type mice increased body weight in 2 weeks and sustained this increase over 8 weeks. A similar effect was noted in glut3+/− mice in response to a high fat diet. Figure 2B depicts fat and muscle mass as assessed by quantitative nuclear magnetic resonance (NMR). Skeletal muscle mass did not change in response to a high fat diet in both the genotypes. In contrast the fat mass increased four-fold in the wt mice and only two-fold in the glut3+/− mice. Table 1 depicts organ weights in the four experimental groups. No major changes were observed except in white adipose tissue which increased in response to the high fat diet in both genotypes.
Figure 2. Body Weight and Composition:
A. Body Weight. Wild type (wt) and glut3+/− pre-gestational mouse body weights in grams when maintained on high fat diet (HFD) or chow diet (CD), n = 7–10/group/genotype. ANOVA models followed by Fisher’s PLSD post-hoc test: *vs. wtCD, #vs. glut3+/−CD. F value (1.881), *wtHFD vs. wtCD (p=0.04)at 6th week; F value (4.32), *wtHFD vs. wtCD (p=0.004), #wtHFD vs. glut3+/−CD (p=0.009)at 7th week; F value (1.853), #wtHFD vs. glut3+/−CD (p=0.05) at 8th week; F value (2.317), *wtHFD vs. wtCD (p=0.05)at 9th week; F value (2.210), *wtHFD vs. wtCD (p=0.04), #wtHFD vs glut3+/−CD (p=0.04)at 10th week; and F value (4.311), *wtHFD vs. wtCD (p=0.006), and #wtHFD vs. glut3+/−CD (p=0.006)at 11th week. B. Fat and skeletal muscle mass: in wt and glut3+/− pre-gestational female mice (3 month old) maintained on HFD or CD (n=6–7/group/genotype) measured by nuclear magnetic resonance (NMR). F value (23.57), *wtHFD vs. wtCD (p=0.0001), #wtHFD vs. glut3+/−CD (p=0.0001), #glut3+/−HFD vs. glut3+/−CD (p=0.01), and †glut3+/−HFD vs. wtHFD (p=0.0002).
Table 1.
Organ weights in pre-gestational female mice (3 months of age).
| Group | Liver | Heart | Brain | Kidney | Pancreas | Skeletal muscle | Adipose tissue | Spleen |
|---|---|---|---|---|---|---|---|---|
| Wt-CD | 1.04±0.06 | 0.14±0.009 | 0.4±0.06 | 0.33±0.008 | 0.11±0.006 | 0.89±0.06 | 0.31±0.03 | 0.08±0.005 |
| Wt-HFD | 1.07±0.08 | 0.13±0.01 | 0.39±0.01 | 0.34±0.02 | 0.13±0.01 | 1.09±0.09 | 1.43±0.21*# | 0.07±0.01 |
| glut3(+/−) CD | 0.97±0.05 | 0.1±0.004 | 0.41±0.01 | 0.31±0.03 | 0.14±0.01 | 1±0.6 | 0.55±0.06 | 0.1±0.01 |
| glut3(+/−) HFD | 1.15±0.22 | 0.13±0.01 | 0.4±0.009 | 0.35±0.06 | 0.14±0.01 | 0.9±0.09 | 1.41±0.13*# | 0.07±0.008 |
Data in gm are shown as mean ± SEM. Fisher’s PLSD is as follows: F value (21.71), wtHFD (p=0.0001), glut3+/−HFD (p=0.0001) vs *wtCD, wtHFD (p=0.0002), glut3+/−HFD (p=0.0002) vs glut3+/−CD. n=10–14/group/genotype.
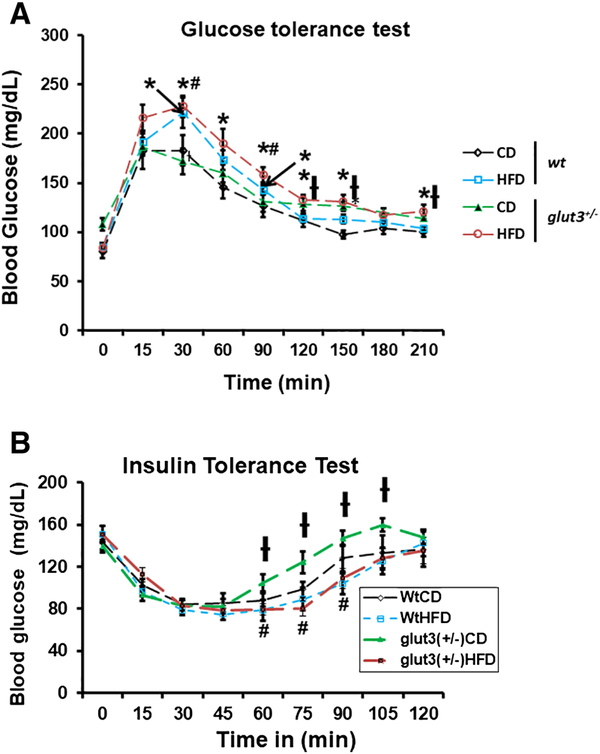
Figure 3A demonstrates the glucose tolerance tests in pre-gestational females. On a regular chow diet, both genotypes are glucose tolerant mimicking each other. In response to a high fat diet, both genotypes became glucose intolerant during the first phase between 30 to 60 minutes. Figure 3B shows the insulin tolerance tests which revealed that the glut3+/− mice maintained on a regular chow diet were insulin sensitive in comparison to the wt mice on a regular chow diet. This difference is seen only in the upswing upon the return of glucose concentrations to baseline from the insulin induced nadir. This swift increase towards normalcy may reflect counter-regulatory hormonal action. This is despite the glut3+/− female mice demonstrating higher baseline plasma glucose concentrations compared to the wild type mice, when both genotypes were maintained on a regular chow diet. The wild type mice on a high fat diet revealed the absence of insulin resistance. The glut3+/− mice on a high fat diet lost this early return to baseline exhibited by this genotype on a regular chow diet, demonstrating relatively more insulin resistance when compared to the glut3+/− mice on a chow diet. Assessment of the plasma lipid profile revealed an increase in total cholesterol and high density lipoprotein in both genotypes fed a high fat diet. Additionally, a diminution in plasma triglycerides was noted in both these high fat diet fed genotypes. No change in unesterified cholesterol and free fatty acids was noted, although a trend towards a decline was seen particularly in the wild type genotype on a high fat diet (Table 2).
Figure 3.
Glucose (A) and insulin (B) tolerance tests in wild type (wt) and glut3+/− three month old pre-gestational female mice maintained on either a high fat diet (HFD) or chow diet (CD). Following fasting over 16 hours female mice received either D-glucose (1gm /kg body weight; n=8–10/group/genotype) or insulin (0.5 U/kg body weight of pharmaceutical grade, Novo-Nordisk, Clayton, NC; n=7–9/group/genotype) intraperitoneally. A. ANOVA models with the post-hoc Fisher’s PLSD test: F value (3.706), wtHFD (p=0.05), glut3+/−HFD (p=0.02) vs *wtCD, glut3+/−HFD (p=0.01), wtHFD (p=0.02) vs #glut3+/−CD at 30min. F value (2.58), glut3+/−HFD vs *wtCD (p=0.01) at 60min. F value (7.15), wtHFD (p=0.008), glut3+/−HFD (p=0.0001) vs *wtCD, glut3+/−HFD vs #glut3+/−CD (p=0.02) at 90min. F value (3.769), glut3+/−HFD vs *wtCD (p=0.009) and glut3+/−HFD vs †wtHFD (p=0.01) at 120min. At 150 min, F value (6.7), glut3+/−CD (p=0.004), glut3+/−HFD (p=0.003) vs *wtCD, glut3+/−HFD vs †wtHFD (p=0.02). F value (3.54), glut3+/−HFD vs *wtCD (p=0.008), glut3+/− HFD vs †wtHFD (p=0.01) at 210 min. B. For ITT (N=7–9), Fisher’s PLSD for ITT is as follows: F value (2.46), glut3+/−HFD vs #glut3+/−CD(p=0.03), glut3+/−CD vs †wtCD (p=0.02) at 60min. F value (4.33), glut3+/−HFD vs #glut3+/−CD (p=0.002) and glut3+/−CD vs †wtHFD (p=0.009) at 75 min. F value (4.23), glut3+/−HFD vs #glut3+/−CD (p=0.009) and glut3+/−CD vs †wtHFD (p=0.003) at 90 min and at 105 min glut3+/−CD vs #wtHFD(p=0.04).
Table 2.
Plasma lipid profile in pre-gestational female mice (3 months of age).
| Group | Triglyceride | Total Cholesterol | High Density Lipoprotein | Unesterified Cholesterol | Free Fatty Acid |
|---|---|---|---|---|---|
| Wt-CD | 46.75±10.29 | 108.25±5.66 | 49.75±4.09 | 27.32±1.55 | 20.25±1.66 |
| Wt-HFD | 18.33±4.05* | 160±17.8* | 87±11.15* | 33.3±6.33 | 16±1 |
| glut3(+/−)-CD | 56.75±14.3 | 113.75±14.4 | 59.5±5.2 | 30.5±3.4 | 17.5±2.66 |
| glut3(+/−)-HFD | 20.2±3.4# | 141.2±9.91 | 79.4±8.44* | 37.5±2.2 | 23±1.13 |
Data in mg/dl are shown as mean ± SEM. n=6–8/group/genotype. Fisher’s PLSD is as follows: F value (2.76), wtHFD vs wtCD (p=0.05) and glut3+/−HFD (p=0.05), vs glut3+/−CD.
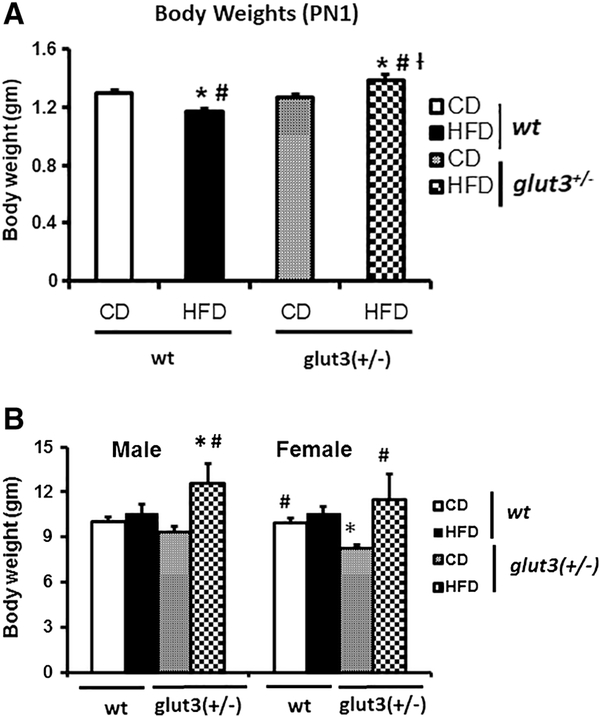
In figure 4A, at postnatal (PN)1 day, the offspring revealed a reduction in body weight in response to maternal high fat diet when compared to the chow fed wt mice. In contrast, an increase in body weight at PN1 in glut3+/− mice exposed to a maternal high fat diet versus chow diet was evident. At PN21, while no difference between maternal high fat and chow diet exposures in the wild type offspring was seen, an increased body weight in response to maternal high fat versus chow diet exposed glut3+/− mice (figure 4B) persisted. In addition, the day 21 glut3+/− mice displayed reduced body weight when compared to their age-matched wt mice when maintained on a chow diet.
Figure 4. Postnatal Body weights.
A. Body weights at day 1 in all experimental groups (n=15–25/group/genotype). F value (14.126), wtHFD (p=0.0001), glut3+/−HFD (p=0.01) vs *wtCD, wtHFD (p=0.01), glut3+/−HFD (p=0.004) vs #glut3+/−CD and glut3+/HFD vs †wtHFD (p=0.0001). B. Body weights at weaning (d21) in male pups (n=810/group/genotype). F value (2.551), glut3+/−HFD vs *wtCD (p=0.01) and glut3+/−HFD vs #glut3+/−CD (p=0.02). Fisher’s PLSD in the case of female pups was as follows, F value (4.22), glut3+/−CD vs *wtCD (p=0.02), wtCD (p=0.02), glut3+/− HFD (p=0.001) vs #glut3+/− CD.
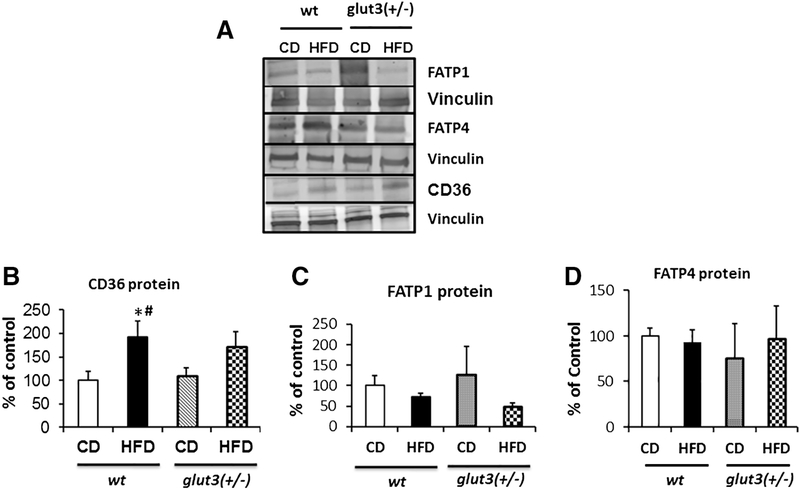
Figure 5 demonstrates changes in gestational day 19 placental fatty acid transporter system. In figure 5A and B, an increase in fatty acid translocase (FAT)/CD36 was observed in response to a high fat diet in the wild type with a trend in glut3+/− mice. In contrast, placental fatty acid transporter protein isoform 1 (FATP1) trended towards a reduction in response to a high fat versus chow diet (figure 5A and C), while no change is seen with FATP4 (figure 5A and D) under the high fat dietary condition in both genotypes.
Figure 5. Placental Fatty acid transporters.
Representative Western blots showing FATP1, FATP4 and CD36 protein bands with vinculin as the internal loading control (A) are in the inset, while quantification is shown below. Fisher’s PLSD is as follows: F value (2.57), wtHFD vs *wtCD (p=0.01), wtHFD vs #glut3+/−CD (p=0.03).
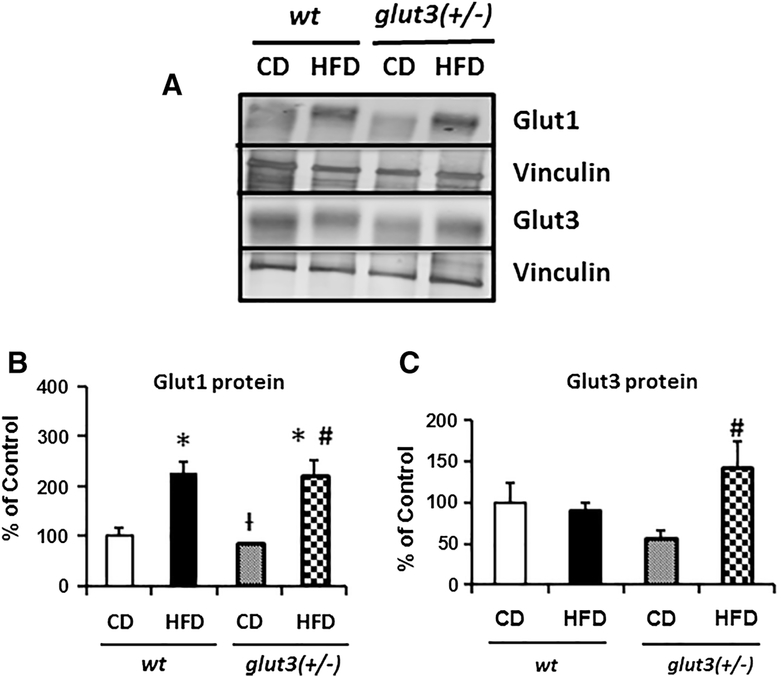
Figure 6 depicts placental glucose transporter protein concentrations. Figure 6A and B reveal an increase in placental Glut1 concentrations in response to a high fat diet in wild type and glut3+/− mice. In contrast in Figure 6A and C, no change was seen in wt placental Glut3 concentrations in response to a high fat diet. However, the glut3+/− placentas revealed an increase in Glut3 concentrations in response to the high fat diet. Thus in glut3+/− mice, high fat diet exposed placentas may have a cumulative effect of increased Glut1 and Glut3 proteins, while the wt may only exhibit the effect of increased Glut1 upon the developing fetus. This is reflected in the PN1 body weights of the offspring from the respective genotypes, with the glut3+/− demonstrating an increase, while the wt expresses a diminution (Figure 4A).
Figure 6. Placental Glucose transporters.
A. Representative Western blots are seen in the inset depicting Glut1 and Glut3 protein bands with vinculin serving as the internal loading control. Below is the graph demonstrating quantification of Glut1 and Glut3 protein (N=8/group/genotype) depicted as a ratio to the vinculin protein and expressed as a percent of the wt ad libitum fed control values. Placental Glut3 protein quantification analysis is as follows: F value (2.9), glut3+/−HFD vs #glut3+/−CD (p=0.006). Placental Glut1 protein analysis is as follows: F value (9.66), wtHFD (p=0.006). glut3+/HFD (p=0.008) vs wtCD, glut3+/−HFD vs glut3+/−CD (p=0.004) and glut3+/−CD vs †wtHFD (p=0.004).
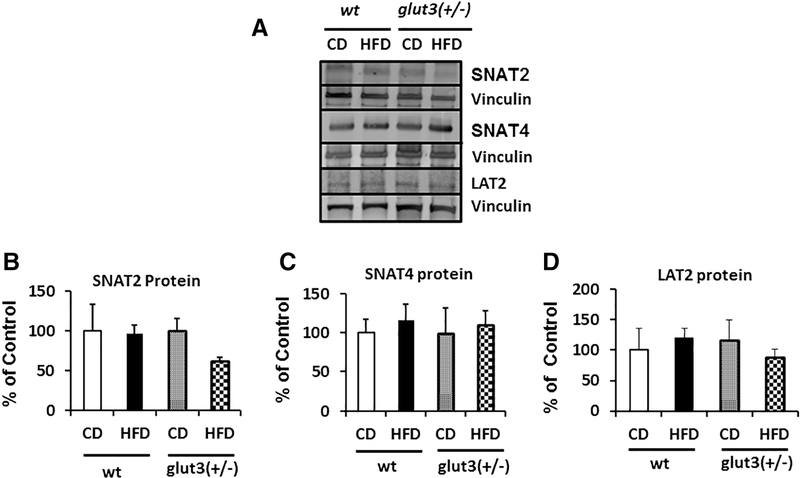
Figure 7 demonstrates placental amino acid transporter protein concentrations. While no change in the placental sodium coupled neutral amino acid transporter (SNAT)2 is effected in response to a high fat diet in wt, a trend towards a reduction was seen in glut3+/− mice in response to a high fat versus chow diet (figure 7A and B). A high fat diet did not change placental SNAT4 protein concentrations in both genotypes (figure 7A and C). In the case of the placental L-type amino acid transporter (LAT)2, a trend towards a reduction was again noted only in glut3+/− mice exposed to a high fat diet (figure 7A and D).
Figure 7. Placental Amino acid transporters.
Detection of SNAT2, SNAT4 and LAT2 proteins by Western Blot analysis (Inset). Below is seen the densitometric quantification of SNATs and LAT2 protein, depicted as a percent of the corresponding CON value. n=6/group/genotype.
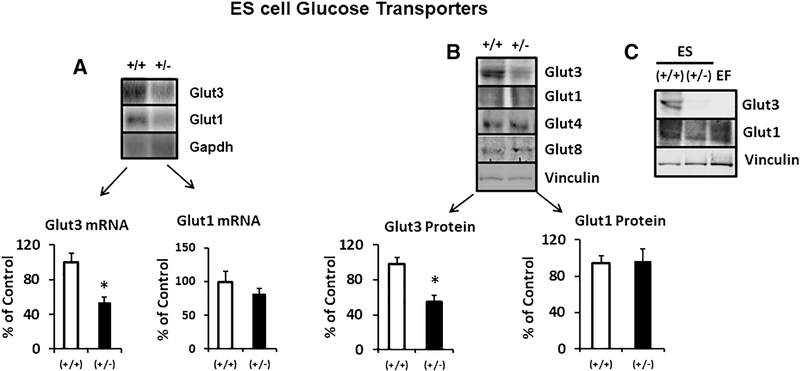
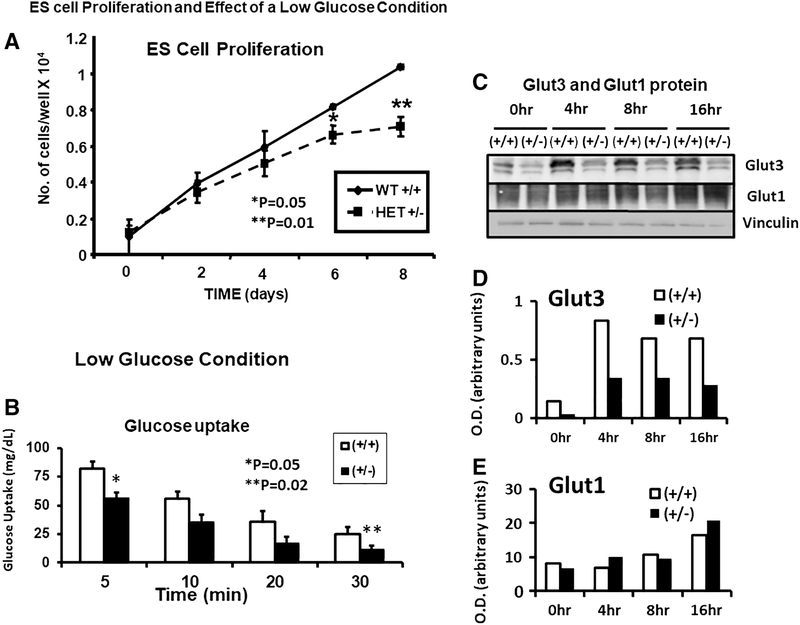
Given that our placental investigations revealed such transporter expression differences between the two genotypes in their response to a high-fat diet, our next set of experiments focused on the early pre-implantation embryonic stage by employing embryonic stem cells (ES cells) of wt and glut3+/− mice (figure 8). We first characterized the expression of Glut1 and Glut3 in ES cells. We confirmed that Glut3 mRNA (figure 8A) and protein (figure 8B) were reduced in glut3+/− when compared to wild type ES cells. No change in Glut1 mRNA (figure 8A) or Glut1, Glut4 and Glut8 proteins was noted (figure 8B). We also ensured that while Glut1 protein was noted in the ES cells and the embryonic fibroblast (EF) feeder cells necessary for culturing and maintaining ES cells, Glut3 protein was specific to only ES cells being absent in EF cells (figure 8C). We then assessed the effect of the glut3+/− genotype on cell survival (figure 9A). Under normal culture conditions, wild type ES cell numbers increased from day 0 to day 8 in a linear manner. In contrast, glut3+/− ES cell numbers began swerving from the wild type cell numbers by day 4, significantly dropping by day 6 and 8. This observation lends support to the importance of Glut3 protein for embryonic growth.
Figure 8. Embryonic stem cell glucose transporters.
A. Glut1 and Glut3 mRNA concentrations in glut3+/+ (wt) and glut3 heterozygous (+/−) ES cells. Glut3 mRNA = *p<0.05 vs glut3+/+ ES cells. B. Glut3, Glut1, Glut4, and Glut8 protein bands seen in glut3+/+ and glut3+/− ES cells. Glut3 protein = *p<0.05 vs glut3+/+ ES cells. n=3/genotype.
Figure 9. Embryonic stem cell growth, glucose uptake and glucose transporters.
A. Growth curves of glut3+/+ and glut3+/− ES cells is shown.*p<0.05. **P<0.01 vs glut3+/+ ES cells. B. Glucose uptake in glut3+/+ and glut3+/− ES cells is shown. Cells were initially grown in Knockout DMEM containing 25mM glucose + LIF, next day this media was removed and the cells washed with PBS twice followed by addition of the same media containing 2.5 mM glucose (low glucose) + 2-deoxy-[14C]glucose. ES cells were collected at different time points (5min, 10min, 20min and 30min) and the glucose uptake measured. *p<0.05, **p<0.02 vs glut3+/+ ES cells. n=3/genotype. C. Glut3 and Glut1 proteins at different and longer time intervals under the same low glucose conditions are depicted with vinculin serving as the internal loading control. Quantification of D. Glut3 and E. Glut1 proteins as a ratio to vinculin is expressed as optical density (O.D.) in arbitrary units.
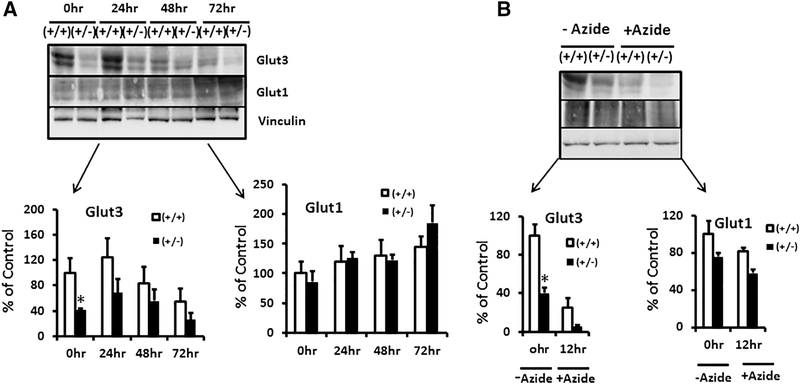
We next examined the effect of specific conditions encountered by preimplantation embryos upon entering the uterus of hyperglycemic/glucose intolerant mothers (figure 9B and C). Per previous reports, pre-implantation embryos experience conditions of low glucose and hypoxia in the presence of maternal hyperglycemia [26]. We therefore examined the time-dependent effect of 5 mM glucose (instead of 25 mM) upon ES cellular glucose uptake (figure 9B) and Glut1 and Glut3 proteins (figure 9C). A time-dependent reduction in glucose uptake is seen in both wild type and glut3+/− ES cells, with the latter being consistently lower than the wild type counterpart (figure 9B). Examination under longer durations of 5 mM glucose exposure increased the Glut3 protein amount in the wt when compared to that of 25 mM (0 time point). However the glut3+/− ES cells that expressed much lower amounts of Glut3 protein, failed to show a similar increase with time (figure 9C – upper panel). This time dependent increase in Glut3 served as a compensatory mechanism to combat the diminishing glucose uptake exhibited by the wild type (glut3+/+) ES cells seen as early as 10 to 30 min of such exposure (figure 9B), but not so in the glut3+/− ES cells (figure 9C – upper panel), explaining the greater reduction in glucose uptake by these ES cells (figure 9B). Glut1 protein on the other hand remained unchanged between the two genotypes perhaps only increasing in both genotypes after 16 hr of exposure to 5 mM glucose (figure 9C – middle panel). Next, we examined the effect of hypoxia (3% vs 20%) (figure 10A), the latter can also be mimicked by sodium azide that inhibits cytochrome c oxidase, which is the last enzyme in the mitochondrial respiratory electron chain (complex IV) (figure 10B). In response to hypoxic exposure, a time-dependent decline in Glut3 protein was noted in wild type and glut3+/− ES cells (figure 10A – upper panel), and in the case of the Glut1 protein, a time dependent trend towards an increase was observed in wild type and glut3+/− genotypes at 72 hr (figure 10A – middle panel). In response to inhibition of complex IV of the mitochondrial respiratory electron chain with sodium azide, while a reduction in Glut3 protein was seen, a less severe reduction in Glut1 protein was evident in wild type and glut3+/− ES cells (figure 10B – upper and middle panels).
Figure 10. Hypoxia and inhibition of oxidative phosphorylation on embryonic stem cells.
A. Effect of hypoxia on Glut1 and Glut3 protein concentrations at different time points (0hr, 24hr, 48hr and 72hrs). n=3/genotype. *p< 0.05 vs glut3+/+ ES cells. B. Sodium azide treatment inhibiting oxidative phosphorylation in ES cells. The insets demonstrate Western blots showing Glut1, Glut3 and vinculin (internal control) protein bands in glut3+/+ and glut3+/− ES cells in presence (+) or absence (-) of sodium azide, while densitometric quantification of the Glut proteins/vinculin protein, depicted as a percent of the corresponding glut3+/+ ES values is depicted below. *p<0.05 vs glut3+/+ ES cells.
Discussion
In the present study we have demonstrated the effect of a high fat diet upon wild type and glut3+/− pre-gestational female phenotype and shown that it leads to obesity due to an increase in white adipose tissue contributing to the overall fat mass. Despite this observed obesity along with an increase in plasma total cholesterol and high density lipoprotein in both genotypes, a reduction in plasma triglycerides with a genotype-specific differential change in free fatty acids was noted. These observations are unlike previous investigations in response to a high fat diet, except that our studies were undertaken in young fertile female mice as opposed to a majority of prior studies in male mice [7, 27–29]. Another investigation conducted in pre-pregnant female and newborn rats previously revealed similar results as we noted in our present study [30, 31]. In fact, during pre-gestation, there is no increase in triglycerides in response to a high fat diet, which was only seen to increase at E20 during pregnancy. Similarly, in the newborn born to a high fat fed rat, triglycerides were decreased. Thus, the response to a high fat diet over an eight week period during the pre-pregnant state as in our present study appears to relay sex-specific differences when compared with previous rat and mouse studies when collectively taken into consideration.
We have previously shown that high murine maternal cholesterol concentrations in response to a western diet upon an LDLR+/− genotype were associated with a higher incidence of aortic atherosclerotic lesions in both the male and female offspring [32], despite normal cholesterol concentrations in the offspring per se. While we did not examine cholesterol levels during pregnancy in the present study, pre-pregnancy elevated plasma cholesterol levels can be extrapolated to persisting during pregnancy. Pre-gestation cholesterol concentrations predict such an elevation during gestation and post-gestation, especially when the high fat diet is continued throughout pregnancy and furthermore during lactation. Although we detected increased high density lipoprotein concentrations, the increasing incidence of atherosclerotic lesions in the offspring despite no change in the total cholesterol concentrations in the offspring reported previously [32], questions the protection afforded by maternal high density lipoprotein concentrations on offspring’s health.
In keeping with the changes in body weight and fat mass, both genotypes reveal glucose intolerance in the high fat exposed groups. Hence pre-pregnancy weight gain in response to a high fat diet is associated with elevated basal glucose concentrations and glucose intolerance, a predictor of gestational diabetes mellitus. However, a key observation was that the female pre-gestational mice in both genotypes were not insulin resistant. Although our previous study employing glut3+/− male mice reared on a chow diet demonstrated obesity, glucose intolerance, insulin resistance and a fatty liver by 911 months of age, a similar phenotype was not seen in age-matched chow-reared female mice [23]. Our present observations in glut3+/− younger female mice on chow diet are similar to older female mice from our previous study [23]. The younger (~3 month old) glut3+/− pre-gestational female mice reared on a chow diet in our present study mimic their age- and sex-matched wild type counterpart in this regard. This demonstrates that the female sex is protective in preventing obesity and its associated complications in the chow-reared glut3+/− genotype. Upon exposure to a high fat diet, these glut3+/− pre-gestational three month old female mice for the most part reflect their age- and sex-matched wild type counterpart. Both wild type and glut3+/− mice become obese during pre-gestation with increased white adipose tissue/fat mass while all other organ weights remain unchanged. However, while the increase in abdominal white adipose tissue weight in response to HFD was similar among the two genotypes, total fat mass by NMR demonstrated a difference, with the wild type showing a greater increase (4-fold) than that of the glut3+/− (2-fold) genotype. Reflecting this pre-gestational obesity, both wild type and glut3+/− female mice also develop glucose intolerance but while the wild type mice remain insulin sensitive, the glut3+/− mice express a tendency towards relative insulin resistance.
Unlike our present results in 4–12 week (~1–3 month) old females, where a high fat diet induced increase in body weight was evident, Schmidt et al exposed male glut3+/− mice to a similar high fat diet (60% kilocalories from fat) and observed no change in body weight, plasma glucose or insulin concentrations from 3 to 12 weeks of age [33]. Thus, on the surface, it appears that even at an early young adult stage, phenotypic sexual dimorphism exists in high fat fed glut3+/− mice which is opposite to what was seen previously in older glut3+/− mice reared on a chow diet [23], or even the age-matched high fat exposed pre-gestational glut3+/− females expressing increased body weight while the males remain resistant. However, unlike our present investigation, Schmidt et al did not assess the fat mass or glucose tolerance in their 3 month old high fat fed glut3+/− male mice [33]. Therefore it is hard to say whether adiposity and glucose intolerance would have been detected in their high fat fed glut3+/− male mice similar to our present findings in female glut3+/− mice.
All gestational high fat dietary exposure studies have revealed that the offspring is born with a reduction in birth weight [9, 34, 35]. In our present investigation, we also observed such a decrease in birth weight of the offspring born to high fat exposed wild type mice. It has been reasoned that such a reduction in birth weight is related to white adipose tissue development occurring postnatally rather than during the fetal stage [36, 37] along with an increase in trans-placental fatty acid and/or glucose transport at the expense of amino acid transport [38–40], a reduction in the latter compromising fetal growth [19, 21, 41]. In contrast to the wild type mice, an increase in the birth weight of the high fat exposed glut3+/− offspring was observed. While the wild type high fat fed offspring’s body weight caught up by PN21 with its chow fed counterpart in males and females, the body weight of the glut3+/− male and female offspring exposed to a high fat diet surpassed the wild type high fat fed counterpart, to be significantly higher than even its genotypic comparator exposed to chow diet. This increase may be related to a higher birth weight and intra-uterine exposure to a relatively insulin resistant maternal metabolic environment. Alternately, the in-utero fetal growth may have occurred at the expense of building maternal total fat mass as seen in HFD exposed glut3+/− female mice NMR studies (only 2-fold increase versus the 4-fold seen in wt mice).
Based on these unique phenotypic observations in the pre-gestational females and the offspring born to them, we reasoned that placental transport mechanisms may underlie some of these genotype-specific effects in the offspring. To this end, we examined all three macronutrient transporter protein isoforms that are predominantly expressed in the late gestation placenta. We chose late gestation, because most of the fetal growth occurs during late gestation. Our experiments revealed that maternal high fat diet led to a trend in downregulating placental FATP1 with no change in FATP4 in both genotypes. In contrast, an upregulation of placental FAT/CD36 particularly in the wild type genotype may contribute to the observed trend towards a reduction in circulating free fatty acids in pre-gestational extrapolated to the gestational state. Further paralleling the reduction in free fatty acids, a reduction in circulating triglyceride concentrations was also encountered in the high fat exposed pre-gestational wild type mice [30, 31]. In contrast, despite a trending increase in FAT/CD36 (although not significant) concentrations in the high fat exposed glut3+/− placentas no change in circulating free fatty acids was encountered. These proteins are membrane-bound and responsible for placental long chain fatty acid uptake towards mediating fetal growth and adiposity.
An increase in placental Glut1 but not Glut3 was observed in wild type mice placed on a high fat diet. Previous investigations in C57/BL6 mice revealed an increase in placental glucose transport paralleling the change in Glut1 [5, 42]. However, our previous investigations in glut1+/− mice demonstrated no effect on trans-placental glucose transport, supporting no major role for placental Glut1 in mediating glucose transport from mother to fetus (Ganguly, Touma et al. 2016). In contrast to our present observations in wild type mice, an increase in both the placental glucose transporter isoforms, namely Glut1 and Glut3 is suggestive of even further compensation with increased intra-placental and thereby trans-placental glucose transport to the developing glut3+/− fetus. This may explain why the glut3+/− offspring exposed to a high fat diet prenatally and during gestation, expressed a higher birth weight (at the expense of building maternal fat mass) than the age-matched wild type counterpart. Further continued exposure to a high fat diet during lactation leads to a further increase in weight gain in the glut3+/− genotype beyond the same genotype being raised on a chow diet. In contrast, the lower birth weight high fat exposed wild type neonatal mice catch up to those reared on chow diet by PN21 prior to weaning. These observations collectively raised the question as to whether a reduction in the Glut3 protein adversely affected glucose uptake and growth in embryonic cells, and if so, how were certain stressful situations encountered by the pre-implantation embryos at conception (e.g. low glucose and hypoxia) handled in the presence of reduced Glut3.
A high fat maternal diet during the pre-gestation period and extending throughout gestation (including the period of conception) has the propensity of affecting early embryonic development and placentation. Previous investigations have revealed that the pre-implantation embryos are generally exposed to a low oxygen environment when they enter the uterus [43, 44]. In addition, maternal obesity is associated with concomitant maternal hyperglycemia [45, 46]. However the pre-implantation blastocysts in response to maternal diabetes generally experience relatively low glucose conditions in the immediate intra-uterine environment, in response to a reduction in glucose transporters (particularly Glut1 and Glut3). Both these conditions of hypoxia and low glucose can disarm mitochondrial metabolism thereby triggering congenital malformations characteristic of pre-existing maternal obesity/diabetes mellitus [26, 45–47]. To mimic these early intra-uterine situations experienced by the pre-implantation embryos of maternal obesity with glucose intolerance, we engaged both wild type and glut3+/− embryonic stem cells and recreated conditions of low glucose, hypoxia and inhibition of mitochondrial complex IV respiratory electron chain (cytochrome c oxidase) in-vitro, and observed a reduction in Glut3 while adequate compensation by Glut1 protein concentrations was not seen in response to either hypoxia or cytochrome C oxidase inhibition. In contrast, low glucose alone enhanced Glut3 protein which attempted to compensate for the reduction in glucose uptake encountered early mainly in wild type, with such increase being compromised in the glut3+/− ES cells. While these observations may not relate directly to the observations during late gestation in placental Glut3 and Glut1 concentrations, it is interesting to note that at both stages, one in early embryonic stem cells and the other in late gestation whole placentas reveal a general tendency towards changes more so in Glut3 rather than in Glut1 protein concentrations, that mediate the effect of glucose on the developing embryo/fetus. Further, it lends support to the importance of Glut3 in embryonic cellular proliferation and growth, perhaps being the underlying mechanism contributing towards fetal growth as well. In the face of such changes, only a trend towards a diminution in placental SNAT2 and LAT2 protein concentrations occurred primarily in the high fat exposed glut3+/− genotype, suggesting the possibility of amino acid deficiencies in the developing fetus, further perpetuating aberrancy in the fetal-placental unit. Our previous studies in mice exposed to a western diet revealed maternal amino acid deficiencies [32].
In conclusion, we have demonstrated the development of obesity and glucose intolerance in pre-gestational young female mice when fed a high fat diet. This perturbed metabolic milieu induces elevated placental FAT/CD36 and Glut1 protein concentrations in wild type and glut3+/− mice, while a compensatory added increase in Glut3 protein concentrations is predominantly seen only in the glut3+/− genotype. These placental changes are associated with birth weight changes and subsequent weight gain seen during the suckling phase. Further, mimicking the hypoxic and low glucose intra-uterine conditions encountered, in response to maternal high fat/glucose intolerance/hyperglycemia conditions, by the compacted pre-implantation embryos, we determined changes particularly in glucose transporter isoforms demonstrating dramatic reduction in Glut3 with an inadequate compensation by Glut1, ultimately affecting glucose uptake and survival of these cells. Our present investigations demonstrate placental macronutrient transporter mechanisms underlying the connection between maternal dietary exposure and the offspring’s immediate health. These mechanisms have the propensity of influencing the offspring’s long term outcome by shaping their adult phenotype.
Highlights:
Pre-gestational high fat diet causes adiposity, dyslipidemia and glucose intolerance in wild type and glut3+/− female mice.
Gestational high fat diet enhances wild type placental CD36 fatty acid transporter and glucose transporter isoform 1 concentrations with diminution of birth weight and postnatal catch-up growth in the offspring.
Gestational high fat diet enhances glut3+/− placental glucose transporter isoforms 1 and 3 concentrations thereby increasing birth weight with postnatal obesity in the offspring.
Glut3+/− embryonic stem (ES) cells versus the wild type express lower glucose uptake and reduced cell growth and survival, demonstrating a lack of compensation with low glucose, hypoxia and inhibition of oxidative phosphorylation.
Acknowledgments
Acknowledgments: This work was supported by NIH HD-41230 and HD-81206 (to SUD).
Abbreviations:
- HFD
High fat diet
- CD
Control diet
- CD36
Cluster of differentiation 36
- FATPs
Fatty acid transporter proteins
- SNATs
Sodium-coupled neutral amino acid transporters
- LAT2
System L amino acid transporter
Footnotes
Publisher's Disclaimer: This is a PDF file of an unedited manuscript that has been accepted for publication. As a service to our customers we are providing this early version of the manuscript. The manuscript will undergo copyediting, typesetting, and review of the resulting proof before it is published in its final citable form. Please note that during the production process errors may be discovered which could affect the content, and all legal disclaimers that apply to the journal pertain.
References
- [1].Accattato F, Greco M, Pullano SA, Care I, Fiorillo AS, Pujia A, et al. Effects of acute physical exercise on oxidative stress and inflammatory status in young, sedentary obese subjects. PLoS One. 2017;12:e0178900. [DOI] [PMC free article] [PubMed] [Google Scholar]
- [2].Alfaradhi MZ, Ozanne SE. Developmental programming in response to maternal overnutrition. Front Genet. 2011;2:27. [DOI] [PMC free article] [PubMed] [Google Scholar]
- [3].Misra A, Singhal N, Khurana L. Obesity, the metabolic syndrome, and type 2 diabetes in developing countries: role of dietary fats and oils. J Am Coll Nutr. 2010;29:289S–301S. [DOI] [PubMed] [Google Scholar]
- [4].Wongchitrat P, Klosen P, Pannengpetch S, Kitidee K, Govitrapong P, Isarankura-Na-Ayudhya C. Highfat diet-induced plasma protein and liver changes in obese rats can be attenuated by melatonin supplementation. Nutr Res. 2017;42:51–63. [DOI] [PubMed] [Google Scholar]
- [5].Jones HN, Woollett LA, Barbour N, Prasad PD, Powell TL, Jansson T. High-fat diet before and during pregnancy causes marked up-regulation of placental nutrient transport and fetal overgrowth in C57/BL6 mice. FASEB J. 2009;23:271–8. [DOI] [PMC free article] [PubMed] [Google Scholar]
- [6].Higgins PB, Bastarrachea RA, Lopez-Alvarenga JC, Garcia-Forey M, Proffitt JM, Voruganti VS, et al. Eight week exposure to a high sugar high fat diet results in adiposity gain and alterations in metabolic biomarkers in baboons (Papio hamadryas sp.). Cardiovasc Diabetol. 2010;9:71. [DOI] [PMC free article] [PubMed] [Google Scholar]
- [7].Gregorio BM, Souza-Mello V, Carvalho JJ, Mandarim-de-Lacerda CA, Aguila MB. Maternal high-fat intake predisposes nonalcoholic fatty liver disease in C57BL/6 offspring. Am J Obstet Gynecol. 2010;203:495 e1–8. [DOI] [PubMed] [Google Scholar]
- [8].Rando OJ, Simmons RA. I'm eating for two: parental dietary effects on offspring metabolism. Cell. 2015;161:93–105. [DOI] [PMC free article] [PubMed] [Google Scholar]
- [9].Sasson IE, Vitins AP, Mainigi MA, Moley KH, Simmons RA. Pre-gestational vs gestational exposure to maternal obesity differentially programs the offspring in mice. Diabetologia. 2015;58:615–24. [DOI] [PMC free article] [PubMed] [Google Scholar]
- [10].Gaillard R Maternal obesity during pregnancy and cardiovascular development and disease in the offspring. Eur J Epidemiol. 2015;30:1141–52. [DOI] [PMC free article] [PubMed] [Google Scholar]
- [11].Starling AP, Brinton JT, Glueck DH, Shapiro AL, Harrod CS, Lynch AM, et al. Associations of maternal BMI and gestational weight gain with neonatal adiposity in the Healthy Start study. Am J Clin Nutr. 2015;101:302–9. [DOI] [PMC free article] [PubMed] [Google Scholar]
- [12].Tennant PW, Rankin J, Bell R. Maternal body mass index and the risk of fetal and infant death: a cohort study from the North of England. Hum Reprod. 2011;26:1501–11. [DOI] [PMC free article] [PubMed] [Google Scholar]
- [13].Santos MM, Baiao MR, de Barros DC, Pinto Ade A, Pedrosa PL, Saunders C. [Pre-pregnancy nutritional status, maternal weight gain, prenatal care, and adverse perinatal outcomes among adolescent mothers]. Rev Bras Epidemiol. 2012;15:143–54. [DOI] [PubMed] [Google Scholar]
- [14].Ismail-Beigi F, Catalano PM, Hanson RW. Metabolic programming: fetal origins of obesity and metabolic syndrome in the adult. Am J Physiol Endocrinol Metab. 2006;291:E439–40. [DOI] [PubMed] [Google Scholar]
- [15].Varadinova MR, Metodieva R, Boyadzhieva N. [Fetal Programming of Metabolic Disorders]. Akush Ginekol (Sofiia).54:32–6. [PubMed] [Google Scholar]
- [16].Dong M, Zheng Q, Ford SP, Nathanielsz PW, Ren J. Maternal obesity, lipotoxicity and cardiovascular diseases in offspring. J Mol Cell Cardiol. 2013;55:111–6. [DOI] [PubMed] [Google Scholar]
- [17].Eckert JJ, Porter R, Watkins AJ, Burt E, Brooks S, Leese HJ, et al. Metabolic induction and early responses of mouse blastocyst developmental programming following maternal low protein diet affecting life-long health. PLoS One. 2012;7:e52791. [DOI] [PMC free article] [PubMed] [Google Scholar]
- [18].Richter VF, Briffa JF, Moritz KM, Wlodek ME, Hryciw DH. The role of maternal nutrition, metabolic function and the placenta in developmental programming of renal dysfunction. Clin Exp Pharmacol Physiol. 2016;43:135–41. [DOI] [PubMed] [Google Scholar]
- [19].Ganguly A, Collis L, Devaskar SU. Placental glucose and amino acid transport in calorie-restricted wild-type and Glut3 null heterozygous mice. Endocrinology. 2012;153:3995–4007. [DOI] [PMC free article] [PubMed] [Google Scholar]
- [20].Ganguly A, McKnight RA, Raychaudhuri S, Shin BC, Ma Z, Moley K, et al. Glucose transporter isoform-3 mutations cause early pregnancy loss and fetal growth restriction. Am J Physiol Endocrinol Metab. 2007;292:E1241–55. [DOI] [PubMed] [Google Scholar]
- [21].Ganguly A, Touma M, Thamotharan S, De Vivo DC, Devaskar SU. Maternal Calorie Restriction Causing Uteroplacental Insufficiency Differentially Affects Mammalian Placental Glucose and Leucine Transport Molecular Mechanisms. Endocrinology. 2016;157:4041–54. [DOI] [PMC free article] [PubMed] [Google Scholar]
- [22].Ganguly A, Chen Y, Shin BC, Devaskar SU. Prenatal caloric restriction enhances DNA methylation and MeCP2 recruitment with reduced murine placental glucose transporter isoform 3 expression. J Nutr Biochem. 2014;25:259–66. [DOI] [PMC free article] [PubMed] [Google Scholar]
- [23].Ganguly A, Devaskar SU. Glucose transporter isoform-3-null heterozygous mutation causes sexually dimorphic adiposity with insulin resistance. Am J Physiol Endocrinol Metab. 2008;294:E1144–51. [DOI] [PubMed] [Google Scholar]
- [24].Rajakumar RA, Thamotharan S, Menon RK, Devaskar SU. Sp1 and Sp3 regulate transcriptional activity of the facilitative glucose transporter isoform-3 gene in mammalian neuroblasts and trophoblasts. J Biol Chem. 1998;273:27474–83. [DOI] [PubMed] [Google Scholar]
- [25].Shin BC, McKnight RA, Devaskar SU. Glucose transporter GLUT8 translocation in neurons is not insulin responsive. J Neurosci Res. 2004;75:835–44. [DOI] [PubMed] [Google Scholar]
- [26].Moley KH, Chi MM, Mueckler MM. Maternal hyperglycemia alters glucose transport and utilization in mouse preimplantation embryos. Am J Physiol. 1998;275:E38–47. [DOI] [PubMed] [Google Scholar]
- [27].Park JH, Yoo Y, Cho M, Lim J, Lindroth AM, Park YJ. Diet-induced obesity leads to metabolic dysregulation in offspring via endoplasmic reticulum stress in a sex-specific manner. Int J Obes (Lond). 2018. [DOI] [PubMed] [Google Scholar]
- [28].Seki Y, Suzuki M, Guo X, Glenn AS, Vuguin PM, Fiallo A, et al. In Utero Exposure to a High-Fat Diet Programs Hepatic Hypermethylation and Gene Dysregulation and Development of Metabolic Syndrome in Male Mice. Endocrinology. 2017;158:2860–72. [DOI] [PMC free article] [PubMed] [Google Scholar]
- [29].Fante T, Simino LA, Reginato A, Payolla TB, Vitoreli DC, Souza M, et al. Diet-Induced Maternal Obesity Alters Insulin Signalling in Male Mice Offspring Rechallenged with a High-Fat Diet in Adulthood. PLoS One. 2016;11:e0160184. [DOI] [PMC free article] [PubMed] [Google Scholar]
- [30].Cerf ME, Herrera E. High Fat Diet Administration during Specific Periods of Pregnancy Alters Maternal Fatty Acid Profiles in the Near-Term Rat. Nutrients.8. [DOI] [PMC free article] [PubMed] [Google Scholar]
- [31].Griffiths PS, Walton C, Samsell L, Perez MK, Piedimonte G. Maternal high-fat hypercaloric diet during pregnancy results in persistent metabolic and respiratory abnormalities in offspring. Pediatr Res.79:278–86. [DOI] [PMC free article] [PubMed] [Google Scholar]
- [32].Bhasin KK, van Nas A, Martin LJ, Davis RC, Devaskar SU, Lusis AJ. Maternal low-protein diet or hypercholesterolemia reduces circulating essential amino acids and leads to intrauterine growth restriction. Diabetes. 2009;58:559–66. [DOI] [PMC free article] [PubMed] [Google Scholar]
- [33].Schmidt S, Richter M, Montag D, Sartorius T, Gawlik V, Hennige AM, et al. Neuronal functions, feeding behavior, and energy balance in Slc2a3+/− mice. Am J Physiol Endocrinol Metab. 2008;295:E1084–94. [DOI] [PubMed] [Google Scholar]
- [34].Panchenko PE, Voisin S, Jouin M, Jouneau L, Prezelin A, Lecoutre S, et al. Expression of epigenetic machinery genes is sensitive to maternal obesity and weight loss in relation to fetal growth in mice. Clin Epigenetics. 2016;8:22. [DOI] [PMC free article] [PubMed] [Google Scholar]
- [35].Hartil K, Vuguin PM, Kruse M, Schmuel E, Fiallo A, Vargas C, et al. Maternal substrate utilization programs the development of the metabolic syndrome in male mice exposed to high fat in utero. Pediatr Res. 2009;66:368–73. [DOI] [PMC free article] [PubMed] [Google Scholar]
- [36].Poulos SP, Hausman DB, Hausman GJ. The development and endocrine functions of adipose tissue. Mol Cell Endocrinol. 2010;323:20–34. [DOI] [PubMed] [Google Scholar]
- [37].Hausman GJ, Wright JT, Jewell DE, Ramsay TG. Fetal adipose tissue development. Int J Obes. 1990;14 Suppl 3:177–85. [PubMed] [Google Scholar]
- [38].Diaz P, Harris J, Rosario FJ, Powell TL, Jansson T. Increased placental fatty acid transporter 6 and binding protein 3 expression and fetal liver lipid accumulation in a mouse model of obesity in pregnancy. Am J Physiol Regul Integr Comp Physiol. 2015;309:R1569–77. [DOI] [PMC free article] [PubMed] [Google Scholar]
- [39].Qiao L, Guo Z, Bosco C, Guidotti S, Wang Y, Wang M, et al. Maternal High-Fat Feeding Increases Placental Lipoprotein Lipase Activity by Reducing SIRT1 Expression in Mice. Diabetes. 2015;64:3111–20. [DOI] [PMC free article] [PubMed] [Google Scholar]
- [40].Sferruzzi-Perri AN, Vaughan OR, Haro M, Cooper WN, Musial B, Charalambous M, et al. An obesogenic diet during mouse pregnancy modifies maternal nutrient partitioning and the fetal growth trajectory. FASEB J. 2013;27:3928–37. [DOI] [PubMed] [Google Scholar]
- [41].Cetin I, Alvino G. Intrauterine growth restriction: implications for placental metabolism and transport. A review. Placenta. 2009;30 Suppl A:S77–82. [DOI] [PubMed] [Google Scholar]
- [42].Rosario FJ, Kanai Y, Powell TL, Jansson T. Increased placental nutrient transport in a novel mouse model of maternal obesity with fetal overgrowth. Obesity (Silver Spring). 2015;23:1663–70. [DOI] [PMC free article] [PubMed] [Google Scholar]
- [43].Checiu M The effect of early hypoxy upon the development of rats and mice. 1. Preimplantation effects. Rom J Morphol Embryol. 1992;38:91–7. [PubMed] [Google Scholar]
- [44].Fischer B, Bavister BD. Oxygen tension in the oviduct and uterus of rhesus monkeys, hamsters and rabbits. J Reprod Fertil. 1993;99:673–9. [DOI] [PubMed] [Google Scholar]
- [45].Guillemette L, Durksen A, Rabbani R, Zarychanski R, Abou-Setta AM, Duhamel TA, et al. Intensive gestational glycemic management and childhood obesity: a systematic review and meta-analysis. Int J Obes (Lond). 2017;41:999–1004. [DOI] [PubMed] [Google Scholar]
- [46].Lindsay KL, Brennan L, Rath A, Maguire OC, Smith T, McAuliffe FM. Gestational weight gain in obese pregnancy: impact on maternal and foetal metabolic parameters and birthweight. J Obstet Gynaecol. 2018:1–6. [DOI] [PubMed] [Google Scholar]
- [47].Block SR, Watkins SM, Salemi JL, Rutkowski R, Tanner JP, Correia JA, et al. Maternal pre-pregnancy body mass index and risk of selected birth defects: evidence of a dose-response relationship. Paediatr Perinat Epidemiol. 2013;27:521–31. [DOI] [PubMed] [Google Scholar]


