Abstract
Cancer cells depend on glucose metabolism via glycolysis as a primary energy source, despite the presence of oxygen and fully functioning mitochondria, in order to promote growth, proliferation and longevity. Glycolysis relies upon NAD+ to accept electrons in the glyceraldehyde-3-phosphate dehydrogenase (GAPDH) reaction, linking the redox state of the cytosolic NAD+ pool to glycolytic rate. The free cytosolic NAD+/NADH ratio is involved in over 700 oxidoreductive enzymatic reactions and as such, the NAD+/NADH ratio is regarded as a metabolic readout of overall cellular redox state. Many experimental techniques that monitor or measure total NAD+ and NADH are unable to distinguish between protein-bound and unbound forms. Yet total NAD+/NADH measurements yield little information, since it is the free forms of NAD+ and NADH that determine the kinetic and thermodynamic influence of redox potential on glycolytic rate. Indirect estimations of free NAD+/NADH are based on the lactate/pyruvate (L/P) ratio at chemical equilibrium, but these measurements are often undermined by high lability. To elucidate the sensitivity of the free NAD+/NADH ratio to changes in extracellular substrate, an in silico model of hepatocarcinoma glycolysis was constructed and validated against in vitro data. Model simulations reveal that over experimentally relevant concentrations, changes in extracellular glucose and lactate concentration during routine cancer cell culture can lead to significant deviations in the NAD+/NADH ratio. Based on the principles of chemical equilibrium, the model provides a platform from which experimentally challenging situations may be examined, suggesting that extracellular substrates play an important role in cellular redox and bioenergetic homeostasis.
Introduction
Cellular bioenergetics describe the processes that generate energy in the form of ATP within the cell, achieved primarily via aerobic and anaerobic glycolysis, pyruvate and fatty acid oxidation, and oxidative phosphorylation within the mitochondria [1,2]. When glycolysis is coupled to oxidative phosphorylation, the NADH reducing equivalents produced in the cytosol by glyceraldehyde-3-phosphate dehydrogenase (GAPDH) are shuttled to the mitochondrial matrix where they are consumed by the respiratory chain. In the absence of oxygen, when mitochondria are unable to recycle the NADH to NAD+, lactate dehydrogenase provides an alternate means of oxidizing NADH to NAD+ to facilitate anaerobic glycolysis [3]. Tumours and highly-proliferating cells can show increased uptake of glucose, favouring glycolytic production of lactate, despite the presence of oxygen and fully functioning mitochondria [4]. The process of aerobic glycolysis under these conditions is also known as the Crabtree Effect, which is inefficient at producing ATP compared to the complete oxidation of glucose coupled to oxidative phosphorylation in terms of stoichiometric conversion of glucose to ATP [5]. However, the glycolytic rate can be considerably higher than oxidative respiration, and it has been suggested that this results in total ATP synthesis that is comparable over any given time, for either route of glucose metabolism [6]. Aerobic glycolysis in tumours and proliferating cells is recognised as an adaptive mechanism to facilitate rapid ATP production, aid survival and allow cells to thrive in the tumour microenvironment, and also to meet the elevated levels of biosynthesis required to support uncontrolled proliferation [7]. In turn, proliferating cells have a higher demand for reducing equivalents, in the form of NADH, which contributes to the NAD+/NADH ratio [8]. Therefore, an inextricable link exists between aerobic glycolytic rate and free NAD+/NADH redox state.
Current in vitro techniques for investigating the NAD+ pool redox state are only capable of measuring total NAD+ and NADH without discriminating between free and protein-bound forms [9]. This is problematic, as only free NAD+/NADH regulate cellular redox state, limiting the insight that can be gleaned from the total NAD+/NADH measurement. Free NAD+/NADH may be estimated or derived via: (i) exploitation of the lactate/pyruvate (L/P) ratio at equilibrium [10]; (ii) using hyperpolarised glucose [11]; or (iii) using genetically encoded sensors (SoNAR) [12]. Estimation of the free NAD+/NADH ratio using the L/P ratio is the most widely used approach, founded on the principles of chemical equilibrium, i.e., when the conversion between pyruvate + NADH and lactate + NAD+ is at equilibrium, the free NAD+/NADH ratio can be calculated by the following equation:
| (1) |
where,
| (2) |
To use this method, the accurate definition of the equilibrium status for the conversion of the L/P ratio is crucial to correctly estimate the NAD+/NADH ratio [9]. Specifically, studies which assume the conversion is at equilibrium, whilst failing to confirm how close it is, can result in estimated ratios that are 1 to 2 orders of magnitude away from the true value. This is because the mass action reaction quotient (Q) at near equilibrium can differ between 1 and 2 orders of magnitude [13–19]. When Q = Keq, the forward and reverse rates of conversion are equal and there is no net loss or gain of lactate. However, when Q < Keq, the reaction favours formation of lactate and similarly, when Q > Keq, the reaction favours formation of pyruvate [9]. In cultured cancer cells, the conversion is predominantly from pyruvate to lactate, due to the rapid disposal of lactate via monocarboxylate transporters (MCTs) located on the plasma membrane [20,21]. This is a function of the high glycolytic rates found in cancer cells, which results in excessive production of pyruvate and NADH that is beyond the metabolic capacity of mitochondrial shuttles and pyruvate dehydrogenase [22]. To utilise the L/P ratio conversion to estimate free NAD+/NADH, one must force chemical equilibrium in vitro by elevating extracellular lactate concentrations between 16 and 22 mM [9]. However, in doing so, glucose consumption is seen to significantly reduce [9], thus demonstrating that the manipulation of extracellular lactate concentrations artificially alters the state of cellular lactate equilibrium while simultaneously perturbing glucose and energy metabolism.
One way of determining glycolytic rate in vitro is by extracellular flux analysis (EFA), which is relatively high throughput and experimentally inexpensive [23–25]. This method quantifies cellular respiration in the form of oxygen consumption rate (OCR) and extracellular acidification rate (ECAR). ECAR can be used as a measure of glycolytic rate when it is assumed that lactic acid, the terminal product of glycolysis, dissociates in the extracellular environment to a proton (H+) and lactate anion at physiological pH. Recently, the significance of respiratory contributions to ECAR has been highlighted, illustrating that the release of CO2 via oxidative phosphorylation can lead to the formation and dissociation of carbonic acid (H2CO3), amplifying and potentially distorting the ECAR output when used to assess glycolytic rate [26]. Fortunately, the proportion of respiratory acidification and glycolytic-only acidification can be easily calculated using the extracellular media buffering power (BP) [27]. This differentiation of acidification sources is necessary, as different cell types under different culture conditions may acidify the extracellular environment almost entirely via glycolysis or respiration [27]. Therefore, glycolytic proton production rate (PPRgly) is considered a more accurate representation of glycolytic rate compared to ECAR [27]. Current in silico models that focus specifically on hepatocellular bioenergetics in combination with EFA, are lacking in metabolic network depth and, as a result, authors tend to mathematically express glycolytic rate as pyruvate-to-lactate flux, rather than proton release into an extracellular environment, omitting respiratory contributions to ECAR altogether [27].
This study describes the construction, parameterisation and validation of an in silico model of hepatocarcinoma cell glycolysis used to investigate: (i) the sensitivity of the NAD+/NADH redox ratio to perturbations in extracellular lactate and glucose concentrations; and (ii) changes to GAPDH and LDH enzyme fluxes during variations in the extracellular substrate. The model described, captures the rapid binding and unbinding between protons and metal ions with all modelled biochemical species. This allows for the computation of the dynamic changes in pH from the total proton stoichiometry, which is crucial when simulating in vitro PPRgly as a function of H+/lactate efflux into an extracellular environment. The model is validated against in vitro hepatocarcinoma EFA and NAD+-ATP data, to confirm the ability of the model to recreate the relationship between the two outputs. The HepG2 cell line was used due to the substantial number of studies that utilise these cells as a hepatic in vitro model for the study of bioenergetic toxicity [26,27]. Furthermore, this immortalized cell line was favoured over primary cells, as cancer cells are renowned for utilising the glycolytic pathway for the generation of cellular energy (ATP) over oxidative phosphorylation as a result of the Warburg effect, facilitating the study of ECAR as a function of glycolytic flux [5,27]. The two-point validation allows for changes in glycolytic rate as a function of NAD+/NADH perturbations to be explored. This approach aims to provide a platform from which aerobic glycolytic flux as a function of experimentally challenging situations may be investigated.
Materials and methods
In silico
Model development
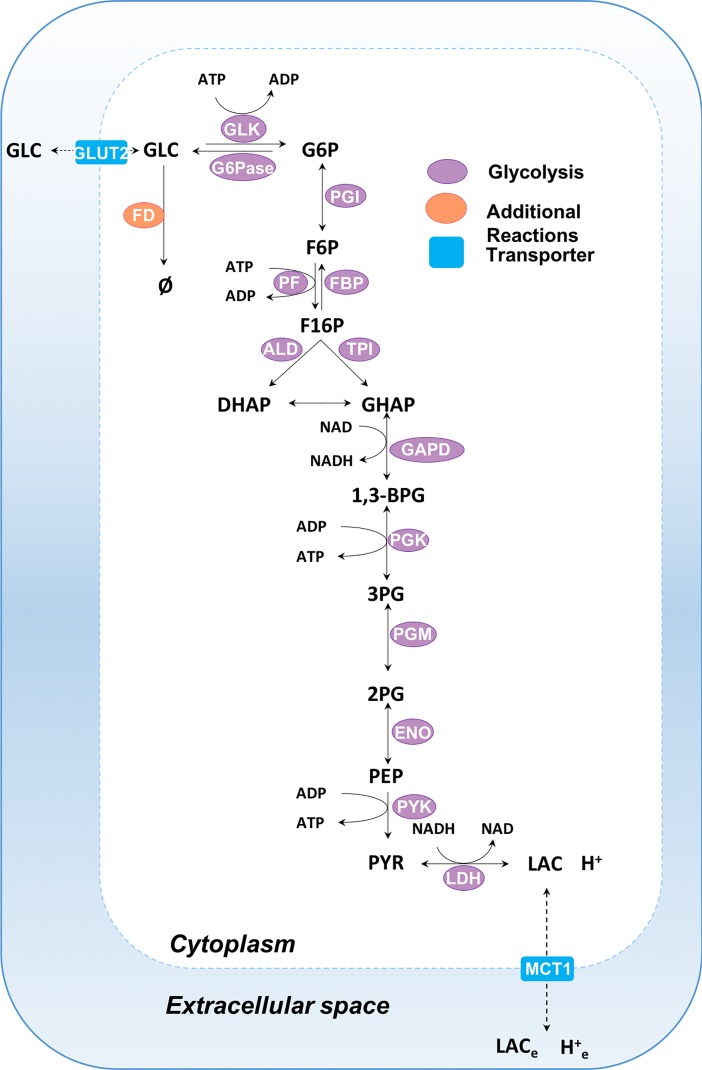
The mathematical model of hepatic glycolysis consists of 26 state variables, 14 enzyme-mediated reactions and two transport fluxes, occurring in two compartments: cytoplasm and extracellular space (Fig 1). Variable and reaction abbreviations are given in Tables 1 and 2 respectively. Reaction and transporter kinetics are modelled using kinetic terms and parameters sourced from the literature, or by fitting to experimental flux data. A comprehensive list of all kinetic terms can be found in the S1 Supporting Information. Flux units for the model are given as mM min-1.
Fig 1. Schematic of the human hepatic bioenergetic model.
The biochemical model comprises two compartments: cytoplasm and extracellular space. Glycolytic enzymes are shown in purple, transporter reactions are depicted as blue rectangles and additional reactions are portrayed in orange. Reaction descriptions can be found in Table 2. See S1 Supporting Information for additional information.
Table 1. Model biochemical reactants including their corresponding abbreviations (Fig 1), allocated compartment and initial concentration.
| Variable | Abbreviation | Compartment | Initial Concentration (mM) |
|---|---|---|---|
| Glucose | GLC | Cytoplasm | 5.000 |
| ATP | ATP | Cytoplasm | 2.800 |
| ADP | ADP | Cytoplasm | 0.800 |
| Glucose-6-phosphate | G6P | Cytoplasm | 0.120 |
| Fructose-6-phosphate | F6P | Cytoplasm | 0.005 |
| Inorganic phosphate | Pi | Cytoplasm | 5.000 |
| Fructose-1,6-phosphate | F16P | Cytoplasm | 0.020 |
| 1,3-bisphospho-glycerate | BPG | Cytoplasm | 0.300 |
| Fructose-2,6-phosphate | F26P | Cytoplasm | 0.004 |
| Dihydroxyacetone-phosphate | DHAP | Cytoplasm | 0.300 |
| Glyceraldehyde-phosphate | GHAP | Cytoplasm | 0.100 |
| NAD | NAD | Cytoplasm | 1.220 |
| NADH | NADH | Cytoplasm | 0.00056 |
| 2-phospho-D-glycerate | PG2 | Cytoplasm | 0.030 |
| 3-phospho-D-glycerate | PG3 | Cytoplasm | 0.270 |
| Phosphoenolpyruvate | PEP | Cytoplasm | 0.150 |
| Pyruvate | PYR | Cytoplasm | 0.100 |
| Lactate | LAC | Cytoplasm | 0.500 |
| Protons | H | Cytoplasm | 6.8 (pH) |
| Magnesium ions | Mg | Cytoplasm | 5.000 |
| Potassium ions | K | Cytoplasm | 8.000 |
| Glucose | GLCe | Extracellular | 5.000 |
| Lactate | LACe | Extracellular | 0.000 |
| Protons | He | Extracellular | 7.4 (pH) |
| Magnesium ions | Mge | Extracellular | 0.000 |
| Potassium ions | Ke | Extracellular | 0.000 |
Extracellular variables are distinguished from cytoplasm variables using subscript “e”.
Table 2. Model enzyme-mediated reactions including abbreviations and descriptions (Fig 1).
| Reaction | Abbreviation | Description |
|---|---|---|
| Glucokinase | GLK | GLC + ATP → ADP + G6P + H |
| Glucose-6-phosphatase | G6Pase | G6P + H2O →G6P+ Pi |
| Phosphoglucose isomerase | PGI | G6P ⇋ F6P |
| Phosphofructokinase | PFK | F6P + ATP → F16P + ADP + H |
| Fructose-1,6-bisphosphatase | FBP1 | F16P + H2O → F6P + Pi |
| Aldolase | ALD | F6P ⇋ DHAP + GAPH |
| Triosephosphate isomerase | TPI | DHAP ⇋ GAPH |
| Glyceraldehyde-3-Phosphate dehydrogenase | GAPDH | GAPH + Pi + NAD+⇋ BPG + NADH + H |
| Phosphoglycerate kinase | PGK | BPG + 2 ADP ⇋ PG3 + 2 ATP |
| Phosphoglycerate mutase 1 | PGM | PG3 ⇋ PG2 |
| Enolase / phosphopyruvate hydratase | ENO | PG2 ⇋ PEP |
| Pyruvate Kinase | PYK | PEP + 2 ADP + H ⇋ PYR + 2 ATP |
| Lactate dehydrogenase | LDH | PYR + NADH + H ⇋ LAC + NAD |
| Glucose Storage (Glycogenolysis) | FD | GLC → Ø |
| Glut-2-transporter | GLUT2 | GLCe ⇋ GLC |
| Monocarboxylate transporter 1 | MCT1 | LAC+ H⇋ LACe + He |
Single-headed reaction arrows indicate irreversible reactions and double arrows indicate reversible reactions. Full details of each reaction / transporter along with their corresponding parameter values can be found in the S1 Supporting Information.
Modelling pH-dependent enzyme kinetics and reaction equilibria: BISEN
The hepatic glycolysis model was constructed in MATLAB, utilising the Biochemical Simulation Environment (BISEN) suite [28]. BISEN is an open-source tool that assists in generating sets of differential equations for simulating biochemical systems, accounting for dynamic proton and metal ion buffering, thermodynamics and reaction equilibria. Detailed instructions on how to use BISEN have been previously published [28]. Briefly, the state variables refer to the biochemical reactants within the model which are the sum of its interconvertible biochemical species. For example, ATP is a reactant that represents the sum of its related species: ATP4-, HATP3-, MgATP2- etc. By accounting for the rapid interconversion of all species with metal ions and protons, the differences in state depending upon the pH can be modelled, whilst accounting for a complete proton stoichiometry. Each biochemical equation has its own associated equilibrium constant and the standard-state free energy of reaction, ΔrG0, that is independent of pH yet dependent upon changes in temperature and ionic strength. Overall, this allows favorability of a reaction to change as a result of a pH change [29].
Kinetic equations and parameters
Transporter and glycolysis enzyme reaction equations, as well as initial parameter estimates, are all sourced from the literature (Table 2), predominantly from a comprehensive model of human hepatic glucose metabolism from Koenig et al. [30]. Additional reaction equations and parameters are based on experimental data from the literature or described here in this paper. All literature sourced parameter values can be found in the S1 Supporting Information. For model alignment with experimental data, certain model parameters were adjusted using unconstrained nonlinear optimization (Nelder-Mead simplex algorithm), starting with an initial literature-based parameter estimate. All rate equations and parameters are liver specific and can be found in the S1 Supporting Information along with their corresponding references.
Model simulations
Model simulations were produced via integration of the resulting ordinary differential equations (ODEs) (S1 Supporting Information) using the variable order stiff solver ode15s (MATLAB). Compartment volumes were also set to mimic EFA by assigning the cytoplasm / intracellular volume as the volume occupied by the 2.5 × 10⁴ cells seeded per well, and the extracellular volume as 200 μl for the total extracellular volume of each well used in the EFA.
In silico–in vitro PPRgly coupling
In silico PPRgly was simulated as a function of the MCT1 transport flux, JMCT1, expressed in mM min-1. Conversion from in silico transport flux of mM min-1 to the in vitro PPRgly pmol min-1 / μg protein measurement was accomplished using Eq 3. Note, this conversion equation also includes normalization for experimental protein content, where PNF is the protein normalization factor.
| (3) |
In vitro
Materials
All extracellular flux analysis consumables were purchased from Seahorse Biosciences (North Billerica, MA, USA). HepG2 cells were purchased from the European Collection of Cell Cultures (ECACC, Salisbury, UK). Dulbecco’s modified media, Phosphate Buffered Saline (PBS) and Rat tail Collagen I were purchased from Life Technologies (Paisley, UK). All other reagents were purchased from Sigma Aldrich (Dorset, UK).
Cell culture
HepG2 cells were maintained in DMEM high-glucose media (glucose 25 mM) supplemented with foetal bovine serum (10% v/v), L-glutamine (2 mM), sodium pyruvate (1 mM) and HEPES (1 mM). Cells were incubated at 37°C under humidified air containing 5% CO2. Cells were used up to passage 17.
Extracellular flux analysis assay
HepG2 cells were collected on the day of the experiment by trypsinisation and then washed thrice with serum- and glucose-free media. The cells were then plated onto a collagen coated (50 μg/ml in acetic acid 0.02 M) XFe 96-well cell culture microplates (2.5 × 10⁴ cells/well) overnight in 100 μl of high glucose (25 mM) cell culture media. Before analysis, culture medium was removed from all wells and replaced with 175 μl of unbuffered glucose free Seahorse Assay media, supplemented with sodium pyruvate (1%v/v) and L-glutamate (1% v/v), pre-warmed to 37°C. Cells were then incubated in a CO2 free incubator at 37°C for 1 h. Before rate measurement, the XFe96 Instrument (Seahorse biosciences, North Billerica, MA) mixed the assay media in each well for 10 min, allowing the oxygen partial pressure to equilibrate. The oxygen consumption rate (OCR) and extracellular acidification rate (ECAR) were measured simultaneously thrice, establishing a baseline rate. For each measurement there was a 3 min mix followed by 3 min wait time to restore normal oxygen tension and pH in the transient microenvironment surrounding the cells. Glucose injections (0.1–25 mM) of 25 μl occurred at the end of the basal measurement cycles at 16 min, followed by 10 further measurements. The overall assay duration was 95 min for each of the n = 4 experimental repeats.
BCA protein quantification assay
Post extracellular flux analysis, assay medium was removed from all wells before the addition of 50 μl of Somatic cell ATP releasing agent (Sigma-Aldrich) to each well and the plate was carefully shaken (1 min, 300 RPM). A standard curve was prepared using a BCA stock (2 mg BCA/ml in ATP releasing agent). Working reagent (WR) was prepared by adding 50 parts bicinchoninic acid to 1 part copper sulphate. 5 μl of cell lysate was plated into a clear 96 well plate followed by addition of 200 μl of WR before incubation (37°C, for 30 min). The absorbance was then measured at 580 nm on a Labsystems Multiskan plate reader. Protein content was then extrapolated from the standard curve. Protein concentrations were then used to normalise the extracellular flux data, giving overall rates of ECAR and OCR as mpH min-1 well protein-1 and pmol min-1 well protein-1, respectively.
Buffering power
EFA assay media buffering capacity was measured at 37 oC using a pH probe. Hydrochloric acid (HCl) (0.1 M) was charged in 6 x 20 μl aliquots to 10 ml of assay media, while changes in pH were recorded. Media buffering power was calculated from the gradient of the line of best fit after plotting the change in pH vs nmol H+ added per 2 μl [31].
PPRgly calculations
PPRgly was calculated from the ECAR measurements following the methodology of Mookerjee et. al (26,27). Briefly, ECAR was measured in units of mpH/min/well protein-1, representing respiratory and glycolytic contributions to acidification. The total proton production rate, PPRtot (pmol H+/min/μg protein), was calculated using Eq (4).
| (4) |
The respiratory contributions to PPR, PPRresp (pmol H+/min/μg protein), were calculated using Eq 5, where pK1 is the overall pKa for CO2(aq) + H2O → HCO3- = 6.093, max H+/O2 = 1 is the derived acidification for the metabolic transformation of glucose oxidation, the average total amount of oxygen consumption, denoted OCRtot, is equal to 17.78 pmol O2/min/μg protein for 5 mM over 10 measurements and non-respiratory oxygen consumption denoted OCRrot, is equal to 5.17 pmol O2/min/μg protein. Thus,
| (5) |
Finally, using Eq (6), PPRgly was calculated by subtracting respiratory acidification contributions from the total proton production rate:
| (6) |
Statistical analysis
Statistical significance was ascertained using Prism 5 software via a one-way ANOVA, with values expressed as a mean ± standard deviation (S.D) taken from four independent experiments (n = 4 experimental repeats).
Results and discussion
Extracellular flux analysis
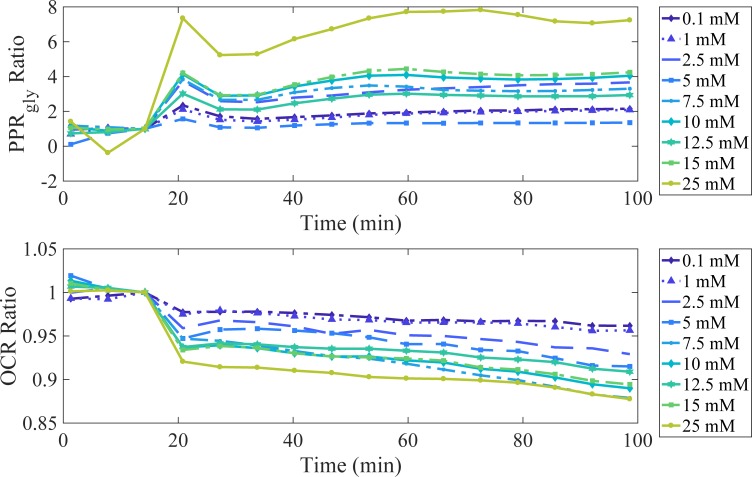
The effects of changes in extracellular glucose concentration (0–25 mM) on PPRgly and OCR for HepG2 cells were examined (Fig 2).
Fig 2. The effect of extracellular glucose on PPRgly and OCR.
HepG2 cells were exposed to serial concentrations of glucose (0.1 to 25 mM) at t = 16 minutes. PPRgly and OCR values are normalised by the values obtained prior to glucose exposure and are expressed as the PPRgly and OCR ratios compared to zero glucose added. Measurements are an average of n = 4 experimental repeats.
Prior to EFA, the cells were starved for 60 minutes in glucose-free media. Glucose was reintroduced after 16 minutes of EFA, stimulating increases in PPRgly ratio and decreases in OCR, for all concentrations of glucose (Fig 2). These results suggest that the introduction of extracellular glucose increases glycolytic energy metabolism, while diminishing respiratory energy production. An increase in glycolytic energy metabolism, facilitates ATP generation from glucose at a faster rate than oxidative phosphorylation. The ability of carcinoma cell lines, including HepG2, to exhibit this phenomena is well characterized and has been reported previously [4,32]. It is common practice to use high-glucose (25 mM) during routine cell culture. Fig 2 highlights how a high-glucose extracellular environment can influence cellular energy metabolism, illustrating that 25 mM glucose can yield up to a 7-fold increase in glycolytic-based energy metabolism when compared to a physiologically relevant extracellular glucose concentration (5 mM). In this instance, while glycolytic-based metabolism is primarily responsible for energy production, deducting respiratory contributions to extracellular acidification is an essential and facile endeavor for the sake of understanding the cellular bioenergetic output.
Sensitivity analysis
Testing the sensitivity of a metabolic model with respect to its parameters is a crucial way of assessing its robustness. Variables that are most sensitive to parameter perturbation can be identified by measuring subsequent changes in time-course simulations and accordingly, any measurements or fluctuations in processes represented by these parameters must be carefully considered. Sensitivity analysis may be presented in many forms depending upon the state of the system. For this model, the relative change of the jth variable with respect to a -99% to +400% change in the ith parameter was measured (Eq 7). Vj is defined as the jth variable over time. More specifically, is the jth variable with its base value; is the jth variable with a perturbed value; with ival ϵ [-99,400%] of its base value, ibase. Mean Vj(t) is denoted as the mean value of the jth variable over the time course t ϵ [0,300] min. Thus, our sensitivity metric, X, is defined:
| (7) |
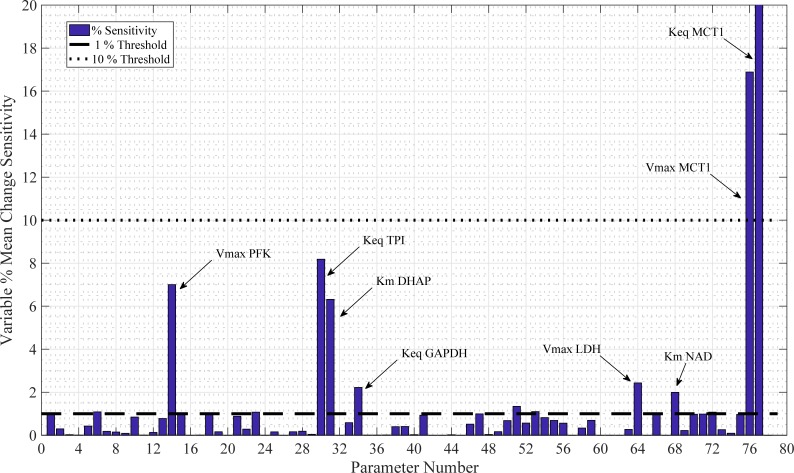
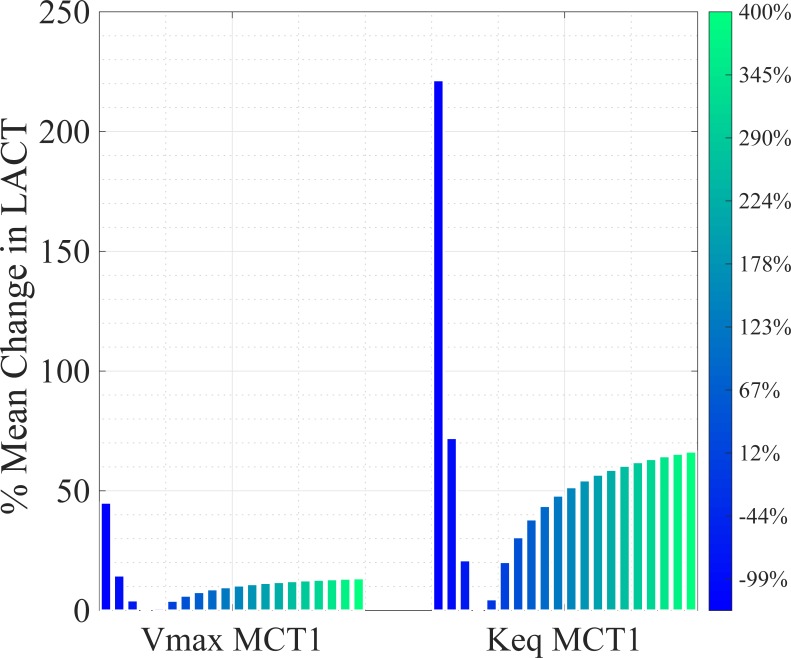
A value of X = 1 would signify that the absolute, relative change in the mean of the variable over the time course is the same as the absolute, relative change in parameter. A parameter is classed as mildly sensitive (MS) if X is between 1 and 10. A parameter is sensitive (S) if X > 10. The sensitivity analysis results for the model are given in Fig 3. This analysis identified 8 key sensitive parameters: phosphofructokinase (PFK) Vmax (MS); triosephosphate isomerase (TPI) Keq (MS); dihydroxy-acetone phosphate (DHAP) Km (MS); glyceraldehyde dehydrogenase (GAPDH) Keq (MS); Km NAD+ (MS); lactate dehydrogenase (LDH) Vmax (MS); MCT1 Keq (S); and MCT1 Vmax (S). The two most sensitive parameters with respect to lactate, Keq and Vmax for the MCT1 transporter, are plotted as a % mean change of its initial value in Fig 4. With two out of three MCT1 transporter parameters registering as sensitive, parameter selection for this enzyme-mediated reaction must be carefully considered, especially when MCT1 transporter flux is to be used for simulating PPRgly.
Fig 3. Sensitivity analysis.
78 model parameters were varied between -99% to +400% of their default values to identify the maximum mean change in any variable and provide a measure of sensitivity, X, relative to parameter change variation. The 8 most sensitive parameters are annotated.
Fig 4. Sensitive model parameters illustrating changes in intracellular lactate concentration.
% mean changes in intracellular lactate concentration as a function of sensitive parameter manipulation are shown compared to their initial steady state condition. Lactate is more susceptible to changes in the equilibrium constant, Keq, than to the Vmax of MCT1 co-transporter kinetics.
Fig 4 shows the effects of changes in Vmax MCT1 and Keq MCT1 on intracellular lactate concentrations. The initial parameter was altered from -99% to +400% in 21 iterations, as shown with the 21 bars for each plot. Evidently, intracellular lactate concentration is more sensitive to the MCT1 equilibrium constant than the Vmax. However, both parameters satisfy the sensitive criteria threshold X > 10 (Fig 3).
Model parameterisation: Cytoplasmic lactate content
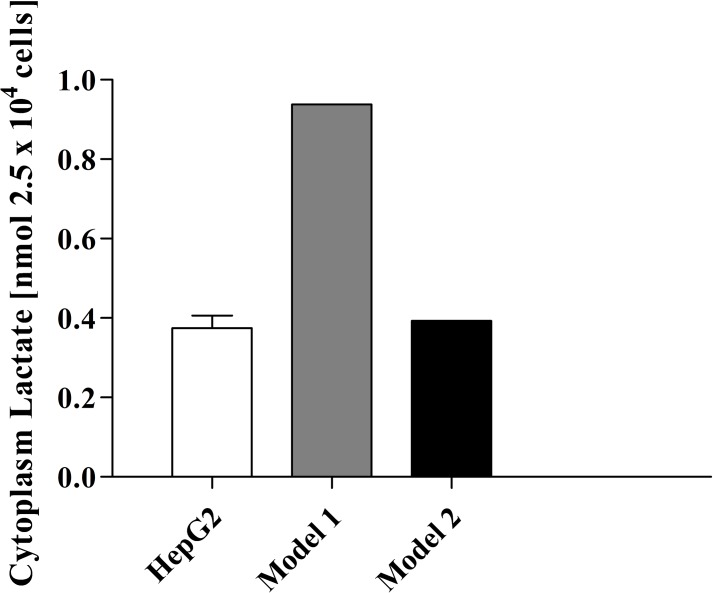
To accurately choose the values for the identified sensitive parameters, the model was fitted to in vitro intracellular lactate concentration. Liu et al. measured the intracellular lactate concentration of HepG2 cells during their study on the effects of miR-122 on pyruvate kinase [33]. Their data was used for comparison of the model simulations of the cytoplasm concentration of lactate over an extended time course of 48 h. Parameter adjustments were performed using unconstrained nonlinear optimization as described in the methods section, such that MCT1 Vmax and MCT1 Keq values were adjusted from 33 mM min-1 and 1, to 2.0×10⁻³ mM min-1 and 1.15×10² respectively (equilibrium constants are unitless) in Fig 5. Steady state cytoplasmic levels of lactate in the model, prior to parameter adjustment, were approximately three times higher than in vitro amounts. A minor adjustment to the MCT1 Vmax parameter provided a more comparable in vitro–in silico intracellular steady state concentration of lactate, while simultaneously leaving other variable and flux steady state concentrations largely unaltered.
Fig 5. Intracellular lactate concentration after 48 h: Model intracellular lactate concentration was aligned with experimental data from HepG2 cells after 48 h.
Model 1 simulation represents the lactate concentration pre-parameter adjustment with all model parameters obtained from the literature. Model 2 simulation represents post-parameter adjustment.
Model validation: Simulating EFA PPRgly and the NAD+/ATP relationship
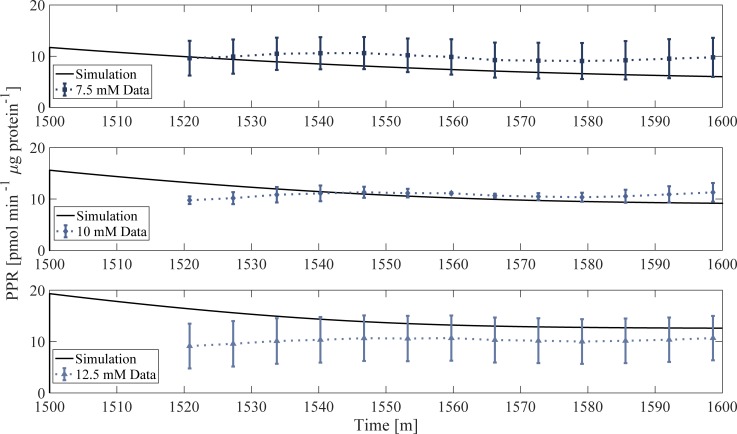
EFA PPRgly experimental data not used for the original parameterisation was used to validate the model. The in vitro experiment consists of a 1440-min (24 h) incubation in a high glucose environment (25 mM), followed by extracellular lactate and glucose removal during a 60-min incubation in unbuffered media prior to EFA. Glucose is reintroduced at t = 1500 min after the end of the glucose-free incubation, followed by 80 min of measurements. The model replicated the EFA analysis data by generating the corresponding PPRgly profile for 7.5, 10 and 12.5 mM of glucose, using the MCT1 flux term (Fig 6). The model output was normalized to the average protein content of the respective wells. The simulated PPRgly is in good accordance with experimental observations, with the model being able to accurately simulate PPRgly using the MCT1 flux only, suggesting that lactate/H+ is likely responsible for glycolytic extracellular acidification, which is in good agreement with the literature [34–36]. Furthermore, these simulations implement the cell incubation and media change features that occur prior to EFA, demonstrating the model’s ability to simulate extracellular changes that cannot be measured experimentally, and predict how the system responds to such perturbations. Simulation of the in vitro data inclusive of the incubation prior to EFA analysis provides confidence in the robustness of the model and its output with respect to glycolytic rate.
Fig 6. Model validation.
Model simulation of PPRgly (solid line) compared to in vitro PPRgly data normalized to protein content. PPRgly data was taken from EFA results (Fig 2) followed by adjusting each ECAR measurement for respiratory contributions. Prior to t = 1440 min, the model is simulated to steady state with extracellular glucose concentration of 25 mM (not shown). At t = 1440 min, extracellular glucose and lactate is removed to replicate in vitro procedure. At t = 1500 min, glucose is reintroduced at 5 mM allowing comparison to experimental data.
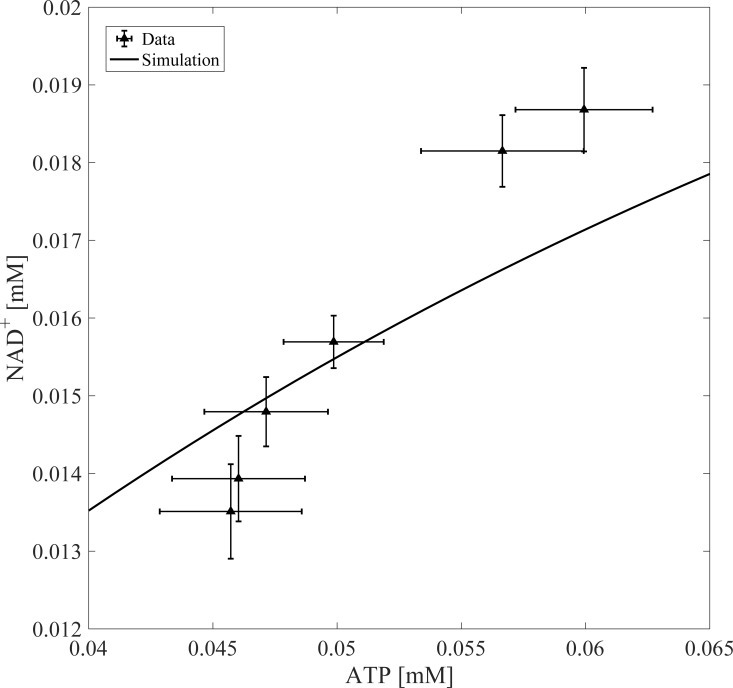
Fig 7 shows further model validation by comparing in silico NAD+/ATP ratio outputs with experimental data [37]. NAD+ concentration in the cytoplasm depends on ATP concentration in liver cells such that linear increases in ATP lead to linear increases in NAD+ [37]. Model simulations mirror the experimentally observed positive correlation between ATP and NAD+. Note, the experimental data used in this section of model validation represents estimated NAD+ using the L/P derivation method, which may explain the slight discrepancy between the model output and the data. Overall, the model’s ability to simulate glycolytic rate, while capturing the essential dynamics between ATP and NAD+ concentration, demonstrates model fidelity with respect to the simulation of these two experimental outputs.
Fig 7. Model validation.
Model output was validated by simulating changes in NAD+ as a function of ATP perturbations. The model was run to steady state before perturbing ATP concentrations. Experimental data was taken from Devin et. al [37].
Model predictions
NAD+/NADH redox state is sensitive to extracellular lactate and glucose concentration
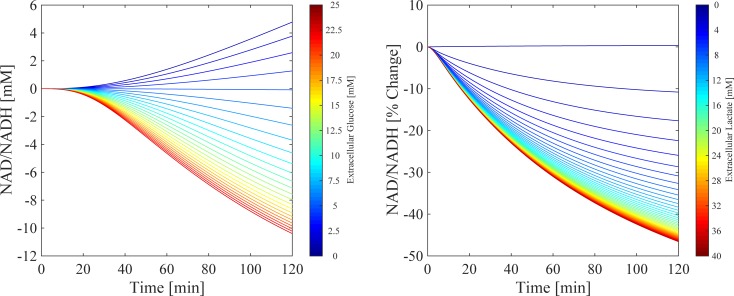
The model predictions for the sensitivity of the NAD+/NADH ratio during changes in extracellular substrates (glucose and lactate) are shown in Fig 8. Fig 8A shows the dynamic NAD+/NADH time-course profiles for an experimentally relevant range of extracellular glucose concentrations over a 120-min simulation. The model was first run to steady state (not shown), followed by perturbations from 0 to 25 mM of extracellular glucose. Each line represents the percentage change in the NAD+/NADH ratio compared to no change in extracellular glucose (black dashed line), where the initial conditions for the unperturbed simulations were 4.9 mM for extracellular glucose and 0.0012 mM for extracellular lactate. When extracellular glucose concentration is less than 5 mM, the model predicts a continuous increase in the NAD+/NADH ratio up to a maximum change of 4.8% at 120 min. Conversely, for concentrations of glucose greater than 5 mM, the model predicts a decrease in the NAD+/NADH ratio with a maximum decrease of 10.4% at 25 mM after 120 min. These model outputs suggest that, during hypoglycaemic conditions (< 5 mM), the model favours hepatic glucose production as opposed to utilisation, which would lead to a reduction in the concentration in NADH. During elevated glucose exposure (> 5 mM), the model output predicts increased glycolytic glucose utilisation, which is well documented experimentally (for every molecule of glucose metabolised via glycolysis, there is a net gain in 2 × NADH molecules) [38]. Therefore, as extracellular glucose concentrations increase, the glycolytic rate and NADH concentration increases, leading to a reduction in the NAD+/NADH ratio. The opposite is predicted when glucose is less than 5 mM.
Fig 8. Extracellular substrate perturbations.
Simulations of the resulting changes in NAD+/NADH ratio as a function of perturbations in extracellular glucose (A, 0 to 25mM) and lactate (B, 0 to 40 mM). Each simulation represents the percentage change in NAD+/NADH compared to an unperturbed simulation (black dashed line) over a 120-min period, with the perturbation of extracellular substrate occurring at 0 min. Time therefore represents time post-perturbation.
Fig 8B illustrates the dynamic time-course outputs in NAD+/NADH during perturbations in extracellular lactate concentration from 0 to 40 mM over a 120-min simulation, representing the typical concentration range within a tumour microenvironment [39]. Following the initial steady state, each line represents the post-perturbation percentage change in the NAD+/NADH ratio compared to no change in extracellular lactate (black dashed line). As the concentration of extracellular lactate increases, the model predicts a continuous percentage decrease in the NAD+/NADH with a maximum decrease of 44.2% at 120 min. From a chemical equilibrium perspective, increases in extracellular lactate will promote uptake of lactate via the MCT1 which will in turn, alter Q to favour the conversion of lactate to pyruvate (when Q > Keq) [40]. An increase in the conversion of lactate to pyruvate means an increase in NADH and therefore a decrease in the NAD+/NADH ratio. Ultimately, simulations suggest that an increase in both extracellular substrates will favour the reduction of the NAD+/NADH ratio by increasing the concentration of NADH though induction of glycolysis during elevated extracellular glucose, and by alteration of the pyruvate to lactate conversion through Q during elevated extracellular lactate exposure.
Extracellular glucose and lactate influences NAD+/NADH through GAPDH and LDH fluxes
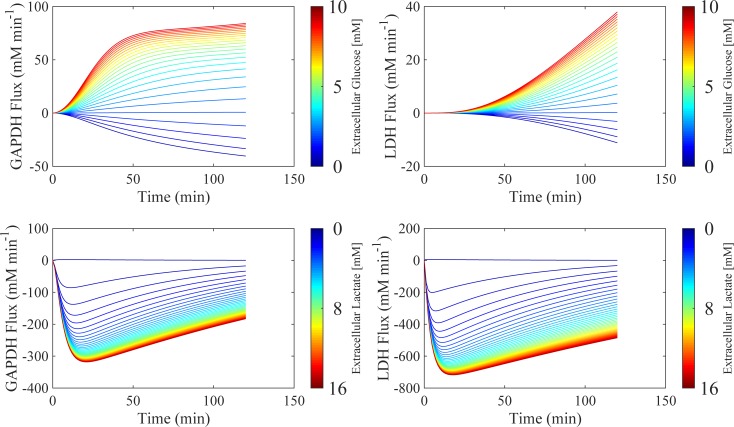
Glycolytic regulation of cytosolic NAD+/NADH is maintained through two key enzymes: GAPDH and LDH. Perturbations in the reaction fluxes of these enzymes directly affects the NAD+/NADH ratio within the model. Therefore, the sensitivity of these key enzymes towards changes in the extracellular substrate environment was investigated. Fig 9 shows the resulting simulated changes in reaction fluxes for GAPDH and LDH during perturbations in extracellular glucose (0 to 25 mM, top panel) and extracellular lactate (0 to 40 mM, bottom panel) during a 120-minute simulation. Each line represents the percentage change in the enzyme flux compared to no change in extracellular glucose (black dashed line), using the same initial conditions as in Fig 8.
Fig 9. Extracellular substrate perturbations.
Simulations of the resulting changes in GAPDH and LDH flux as a function of perturbations in extracellular glucose (0 to 25mM, top row panels) and lactate (0 to 40 mM, bottom row panels). Each simulation represents the percentage change in GAPDH and LDH flux compared to an unperturbed simulation (black dashed line) over a 120-min period, with the perturbation of extracellular substrate occurring at 0 min. Time therefore represents time post-perturbation.
Simulations predict that for elevated extracellular glucose (> 5 mM), GAPDH and LDH enzyme fluxes increase up to a maximum of 84% and 37% respectively. During diminished extracellular glucose concentrations (< 5mM), the model predicts negative GAPDH and LDH fluxes, with a maximum decrease of -40% and -8.8% respectively. Negative reaction fluxes illustrate a switch in metabolic directionality whereby the reverse reaction governed by each enzyme is favoured. Consequently, when extracellular glucose concentration is high (> 5 mM), the model predicts increased formation of NADH through accelerated GAPDH flux, and increased NAD+ formation through accelerated LDH flux. While both NADH and NAD+ production is elevated, GAPDH is predicted to be more sensitive to extracellular glucose than LDH, with simulations suggesting that GAPDH flux is more than twice as fast as LDH. This results in a net increase in NADH, corresponding to the decreased NAD+/NADH ratio seen in Fig 8.
The bottom panel in Fig 9 shows how changes in extracellular lactate concentration affects GAPDH and LDH reaction flux. For all increased concentrations of extracellular lactate, simulations predict negative reaction fluxes for GAPDH, with a maximum change of 318% after 120 minutes. For the same changes in extracellular lactate concentration, the model also predicts a negative reaction flux for LDH, with a maximum of 716% over 120 minutes. Negative enzyme flux profiles suggest favouring of the production of NAD for GAPDH accompanied by the favouring of production of NADH for LDH. Overall, during increases in extracellular lactate concentration, the model predicts that there will again be a net increase in NADH concentration, given the differences in sensitivity between GAPDH and LDH.
It is unsurprising that increased extracellular lactate stimulates an increase in the reverse LDH flux, as tumour cells growing under aerobic conditions can utilise lactate as an energy source by uptake followed by conversion back to pyruvate, also known as metabolic symbiosis [39]. Lactate as an energy source in this instance spares glucose, making it more readily available for hypoxic tumour cells, with oxidative tumour cells preferring lactate as a source of metabolic fuel [41]. Furthermore, model predictions are in good accordance with the literature, which suggests that oxidation of lactate to pyruvate under these circumstances sustains NADH production in order to mitigate tumour oxidative stress [42]. While glycolytic regulation in general is complex, GAPDH is recognised as an important regulatory enzyme in living cancer cells, suggesting that GAPDH exhibits the most positive control on glycolytic flux according to metabolic control analysis [43]. GAPDH within the glycolytic pathway is regulated by ATP and NAD+, and with respect to aerobic glycolysis, GAPDH is highly expressed, emphasising its role in supporting the elevated demand for glycolysis [44]. Model simulations predict that the NAD+/NADH ratio may be manipulated through changes in GAPDH and LDH flux, as a function of perturbations in extracellular glucose and lactate.
Model considerations and applications
The model presented here extends the mathematical/computational representation of in vitro EFA with regards to glycolytic rate. Other models such as the MITOsym, provide an outstanding computational representation of EFA, boasting inclusion of both oxidative and respiratory-based bioenergetic processes [45]. However, the MITOsym model is a significantly reduced representation of the bioenergetic portrait, aimed at capturing the key aspects of mitochondrial function in a whole cell environment [45]. In doing so, NADH is not explicitly modelled, but instead inferred from utilisation of pyruvate. Moreover, glycolysis itself is captured through a reduced set of ODEs, with ECAR computed using pyruvate-to-lactate flux (representative of LDH) [45]. Here, glycolytic rate is modelled using the glycolytic pathway in its entirety, including dynamic proton and metal ion buffering, thermodynamics and reaction equilibria. In doing so, the model is able to represent glycolytic rate specifically in the form that EFA measures it, i.e. PPRgly, using the MCT1 proton-lactate efflux process (Fig 6). Moreover, NAD+/NADH in this model is explicitly represented, capturing the relationship between NAD+ and ATP (Fig 7). Therefore, the model presented here is better suited for simulating and investigating glycolytic rate in the form of PPRgly. However, a caveat of this model is that it does not include TCA or oxidative metabolism and therefore its output is limited to represent non-oxidative energy metabolism only. Furthermore, while Ca2+ is present as a variable in the model, the omission of mitochondrial metabolism limits the models ability to explicitly capture other important regulators of the cytosolic NAD+/NADH ratio, for example, how the translation of cytosolic Ca2+ transients by the mitochondria results in transmission of NADH from the mitochondria itself to the cytosol [46]. The model predicts that the availability of extracellular substrates influences the NAD+/NADH ratio, particularly extracellular lactate (Fig 8). This is informative as in vitro derivation of the NAD+/NADH ratio by forcing chemical equilibrium using elevated concentrations of extracellular lactate could therefore lead to spurious estimations. Moreover, simulations predict that changes in GAPDH and LDH flux, as a function of perturbations in extracellular substrate, significantly influence glycolytic rate and the NAD+/NADH ratio (Fig 9). Indeed, the relationship between these enzymes and glycolytic rate is strengthened in Fig 3, where the parameters Keq GAPDH and Vmax LDH score as mildly sensitive with respect to PPRgly. The relationship between extracellular substrate and NAD+/NADH could be exploited, using the model to assist the design of experiments whereby extracellular substrates are deliberately manipulated to yield variance in the NAD+/NADH ratio. Such methods could perhaps be used to mimic inter-individual variation, metabolic disorders or cellular metabolic variations. At the very least, these simulations, which are in accordance with literature and in vitro outputs [10,41–43], suggest that the composition of extracellular substrates during cancer cell culture should be considered carefully due to their potential influence on the cellular free NAD+/NADH ratio and bioenergetic function.
Conclusions
In this study, the sensitivity of the cytosolic free NAD+/NADH ratio towards perturbations in extracellular glucose and lactate was assessed using an in silico model of hepatocarcinoma glycolytic flux. The model predicts that the NAD+/NADH ratio is particularly sensitive to changes in extracellular lactate whereby elevated concentrations, comparable to those found in a tumour microenvironment, can result in a decrease in the NAD+/NADH ratio of up to 44.2% after 2 hours. The model was used to investigate how changes in extracellular glucose and lactate influence cancer bioenergetics through GAPDH and LDH flux, predicting that GAPDH and LDH are most sensitive to glucose and lactate respectively. Maximal changes in the enzyme fluxes of 318% and 716% for GAPDH and LDH are achieved, when extracellular glucose and lactate concentrations are 25 mM and 40 mM respectively. Overall, the model can be used to simulate experimentally challenging situations, such as circumventing the need to artificially alter the state of lactate equilibrium during estimation of the cytosolic free NAD+/NADH, while providing a platform from which experimental design of extracellular substrate manipulation can be assisted.
Supporting information
(DOCX)
Zip file containing EFA data.
(ZIP)
Zip file containing complete model code for simulation.
(ZIP)
Zip file containing html versions of model code.
(ZIP)
Acknowledgments
We thank Dr Carol Jolly (University of Liverpool) for advice and setup of the extracellular flux analysis assay and cell culture.
Data Availability
All relevant data are within the manuscript and its Supporting Information files.
Funding Statement
J.L. acknowledges funding support from the EPSRC Liverpool Centre for Mathematics in Healthcare (EP/N014499/1), https://epsrc.ukri.org. The funders had no role in study design, data collection and analysis, decision to publish, or preparation of the manuscript. R.A.K. acknowledges funding support from a BBSRC Industry Case Partnership with GSK (BB/L502273/2), https://bbsrc.ukri.org, https://www.gsk.com. GSK provided support in the form of salaries for author A.H., but did not have any additional role in the study design, data collection and analysis, decision to publish, or preparation of the manuscript. The specific roles of these authors are articulated in the ‘author contributions’ section.
References
- 1.Gaude E, Schmidt C, Gammage PA, Dugourd A, Blacker T, Chew SP, et al. NADH Shuttling Couples Cytosolic Reductive Carboxylation of Glutamine with Glycolysis in Cells with Mitochondrial Dysfunction. Mol Cell [Internet]. 2018. February 15;69(4):581–593.e7. Available from: 10.1016/j.molcel.2018.01.034 [DOI] [PMC free article] [PubMed] [Google Scholar]
- 2.Bezawork-Geleta A, Wen H, Dong L, Yan B, Vider J, Boukalova S, et al. Alternative assembly of respiratory complex II connects energy stress to metabolic checkpoints. Nat Commun [Internet]. 2018;9(1):2221 Available from: 10.1038/s41467-018-04603-z [DOI] [PMC free article] [PubMed] [Google Scholar]
- 3.Rossignol R, Gilkerson R, Aggeler R, Yamagata K, Remington SJ, Capaldi RA. Energy Substrate Modulates Mitochondrial Structure and Oxidative Capacity in Cancer Cells. Cancer Res [Internet]. 2004. February 1;64(3):985 LP-993. Available from: http://cancerres.aacrjournals.org/content/64/3/985.abstract [DOI] [PubMed] [Google Scholar]
- 4.Warburg O. On the origin of cancer cells. Science (80-) [Internet]. 1956;123(3191):309–14. Available from: https://www.scopus.com/inward/record.uri?eid=2-s2.0-12444279265&partnerID=40&md5=e7bbcaa4dd8617b018ad0268ff3bc7b3 [DOI] [PubMed] [Google Scholar]
- 5.Vander Heiden MG, Cantley LC, Thompson CB. Understanding the Warburg Effect: The Metabolic Requirements of Cell Proliferation. Science [Internet]. 2009;324(5930):1029–33. Available from: http://www.ncbi.nlm.nih.gov/pmc/articles/PMC2849637/ [DOI] [PMC free article] [PubMed] [Google Scholar]
- 6.Liberti M V, Locasale JW. The Warburg Effect: How Does it Benefit Cancer Cells? Trends Biochem Sci [Internet]. 2018. February 18;41(3):211–8. Available from: 10.1016/j.tibs.2015.12.001 [DOI] [PMC free article] [PubMed] [Google Scholar]
- 7.Diaz-Ruiz R, Uribe-Carvajal S, Devin A, Rigoulet M. Tumor cell energy metabolism and its common features with yeast metabolism. Biochim Biophys Acta. 2009/08/18. 2009;1796(2):252–65. 10.1016/j.bbcan.2009.07.003 [DOI] [PubMed] [Google Scholar]
- 8.DeBerardinis RJ, Mancuso A, Daikhin E, Nissim I, Yudkoff M, Wehrli S, et al. Beyond aerobic glycolysis: Transformed cells can engage in glutamine metabolism that exceeds the requirement for protein and nucleotide synthesis. Proc Natl Acad Sci [Internet]. 2007. December 4;104(49):19345 LP-19350. Available from: http://www.pnas.org/content/104/49/19345.abstract [DOI] [PMC free article] [PubMed] [Google Scholar]
- 9.Sun F, Dai C, Xie J, Hu X. Biochemical Issues in Estimation of Cytosolic Free NAD/NADH Ratio. Song L, editor. PLoS One [Internet]. 2012. May 3;7(5):e34525 Available from: http://www.ncbi.nlm.nih.gov/pmc/articles/PMC3343042/ 10.1371/journal.pone.0034525 [DOI] [PMC free article] [PubMed] [Google Scholar]
- 10.Williamson DH, Lund P, Krebs HA. The redox state of free nicotinamide-adenine dinucleotide in the cytoplasm and mitochondria of rat liver. Biochem J [Internet]. 1967. May;103(2):514–27. Available from: http://www.ncbi.nlm.nih.gov/pmc/articles/PMC1270436/ [DOI] [PMC free article] [PubMed] [Google Scholar]
- 11.Christensen CE, Karlsson M, Winther JR, Jensen PR, Lerche MH. Non-invasive in-cell determination of free cytosolic [NAD+]/[NADH] ratios using hyperpolarized glucose show large variations in metabolic phenotypes. J Biol Chem. 2014. January;289(4):2344–52. 10.1074/jbc.M113.498626 [DOI] [PMC free article] [PubMed] [Google Scholar]
- 12.Zhao Y, Wang A, Zou Y, Su N, Loscalzo J, Yang Y. In vivo monitoring of cellular energy metabolism using SoNar, a highly responsive sensor for NAD+/NADH redox state. Nat Protoc [Internet]. 2016. June 30;11:1345 Available from: 10.1038/nprot.2016.074 [DOI] [PubMed] [Google Scholar]
- 13.Zhang Q, Wang S-Y, Nottke AC, Rocheleau J V, Piston DW, Goodman RH. Redox sensor CtBP mediates hypoxia-induced tumor cell migration. Proc Natl Acad Sci U S A. 2006. June;103(24):9029–33. 10.1073/pnas.0603269103 [DOI] [PMC free article] [PubMed] [Google Scholar]
- 14.Schwartz JP, Passonneau J V, Johnson GS, Pastan I. The effect of growth conditions on NAD+ and NADH concentrations and the NAD+:NADH ratio in normal and transformed fibroblasts. J Biol Chem. 1974. July;249(13):4138–43. [PubMed] [Google Scholar]
- 15.Siess EA, Brocks DG, Lattke HK, Wieland OH. Effect of glucagon on metabolite compartmentation in isolated rat liver cells during gluconeogenesis from lactate. Biochem J. 1977. August;166(2):225–35. [DOI] [PMC free article] [PubMed] [Google Scholar]
- 16.Sauer LA, Dauchy RT. Regulation of lactate production and utilization in rat tumors in vivo. J Biol Chem. 1985. June;260(12):7496–501. [PubMed] [Google Scholar]
- 17.Sistare FD, Haynes RCJ. The interaction between the cytosolic pyridine nucleotide redox potential and gluconeogenesis from lactate/pyruvate in isolated rat hepatocytes. Implications for investigations of hormone action. J Biol Chem. 1985. October;260(23):12748–53. [PubMed] [Google Scholar]
- 18.Fantin VR, St-Pierre J, Leder P. Attenuation of LDH-A expression uncovers a link between glycolysis, mitochondrial physiology, and tumor maintenance. Cancer Cell. 2006. June;9(6):425–34. 10.1016/j.ccr.2006.04.023 [DOI] [PubMed] [Google Scholar]
- 19.Katz A, Sahlin K. Effect of decreased oxygen availability on NADH and lactate contents in human skeletal muscle during exercise. Acta Physiol Scand. 1987. September;131(1):119–27. 10.1111/j.1748-1716.1987.tb08213.x [DOI] [PubMed] [Google Scholar]
- 20.Halestrap AP, Price NT. The proton-linked monocarboxylate transporter (MCT) family: structure, function and regulation. Biochem J. 1999. October;343 Pt 2:281–99. [PMC free article] [PubMed] [Google Scholar]
- 21.Halestrap AP. The monocarboxylate transporter family—Structure and functional characterization. IUBMB Life. 2012. January;64(1):1–9. 10.1002/iub.573 [DOI] [PubMed] [Google Scholar]
- 22.Curi R, Newsholme P, Newsholme EA. Metabolism of pyruvate by isolated rat mesenteric lymphocytes, lymphocyte mitochondria and isolated mouse macrophages. Biochem J. 1988. March;250(2):383–8. [DOI] [PMC free article] [PubMed] [Google Scholar]
- 23.Divakaruni AS, Paradyse A, Ferrick DA, Murphy AN, Jastroch M. Chapter Sixteen—Analysis and Interpretation of Microplate-Based Oxygen Consumption and pH Data In: Murphy AN, Chan DCBT-M in E, editors. Mitochondrial Function [Internet]. Academic Press; 2014. p. 309–54. Available from: http://www.sciencedirect.com/science/article/pii/B9780128014158000163 [DOI] [PubMed] [Google Scholar]
- 24.Technologies A. Publications with Seahorse XF Data. 2017; Available from: http://www.agilent.com/publications-database/
- 25.Beeson CC, Beeson GC, Schnellmann RG. A high-throughput respirometric assay for mitochondrial biogenesis and toxicity. Anal Biochem. 2010. September;404(1):75–81. 10.1016/j.ab.2010.04.040 [DOI] [PMC free article] [PubMed] [Google Scholar]
- 26.Mookerjee SA, Goncalves RLS, Gerencser AA, Nicholls DG, Brand MD. The contributions of respiration and glycolysis to extracellular acid production. Biochim Biophys Acta. 2015. February;1847(2):171–81. 10.1016/j.bbabio.2014.10.005 [DOI] [PubMed] [Google Scholar]
- 27.Mookerjee SA, Brand MD. Measurement and Analysis of Extracellular Acid Production to Determine Glycolytic Rate. J Vis Exp [Internet]. 2015. December 12;(106):53464 Available from: http://www.ncbi.nlm.nih.gov/pmc/articles/PMC4692795/ [DOI] [PMC free article] [PubMed] [Google Scholar]
- 28.Vanlier J, Wu F, Qi F, Vinnakota KC, Han Y, Dash RK, et al. BISEN: Biochemical Simulation Environment. Bioinformatics [Internet]. 2009. March 15;25(6):836–7. Available from: 10.1093/bioinformatics/btp069 [DOI] [PMC free article] [PubMed] [Google Scholar]
- 29.Vinnakota K, Kemp ML, Kushmerick MJ. Dynamics of muscle glycogenolysis modeled with pH time course computation and pH-dependent reaction equilibria and enzyme kinetics. Biophys J. 2006/04/18. 2006;91(4):1264–87. 10.1529/biophysj.105.073296 [DOI] [PMC free article] [PubMed] [Google Scholar]
- 30.Konig M, Bulik S, Holzhutter H-G. Quantifying the contribution of the liver to glucose homeostasis: a detailed kinetic model of human hepatic glucose metabolism. PLoS Comput Biol. 2012;8(6):e1002577 10.1371/journal.pcbi.1002577 [DOI] [PMC free article] [PubMed] [Google Scholar]
- 31.Mookerjee SA, Brand MD. Measurement and Analysis of Extracellular Acid Production to Determine Glycolytic Rate. J Vis Exp [Internet]. 2015;(106):53464 Available from: http://www.ncbi.nlm.nih.gov/pmc/articles/PMC4692795/ [DOI] [PMC free article] [PubMed] [Google Scholar]
- 32.Kamalian L, Chadwick AE, Bayliss M, French NS, Monshouwer M, Snoeys J, et al. The utility of HepG2 cells to identify direct mitochondrial dysfunction in the absence of cell death. Toxicol Vitr [Internet]. 2015;29(4):732–40. Available from: http://www.sciencedirect.com/science/article/pii/S0887233315000284 [DOI] [PubMed] [Google Scholar]
- 33.Liu AM, Xu Z, Shek FH, Wong KF, Lee NP, Poon RT, et al. miR-122 targets pyruvate kinase M2 and affects metabolism of hepatocellular carcinoma. PLoS One. 2014/01/28. 2014;9(1):e86872 10.1371/journal.pone.0086872 [DOI] [PMC free article] [PubMed] [Google Scholar]
- 34.Kato Y, Ozawa S, Miyamoto C, Maehata Y, Suzuki A, Maeda T, et al. Acidic extracellular microenvironment and cancer. Cancer Cell Int. 2013. September;13(1):89 10.1186/1475-2867-13-89 [DOI] [PMC free article] [PubMed] [Google Scholar]
- 35.Abrahams M, Eriksson H, Björnström K, Eintrei C. Effects of propofol on extracellular acidification rates in primary cortical cell cultures: application of silicon microphysiometry to anaesthesia. BJA Br J Anaesth [Internet]. 1999. September 1;83(3):467–9. Available from: 10.1093/bja/83.3.467 [DOI] [PubMed] [Google Scholar]
- 36.Dietl K, Renner K, Dettmer K, Timischl B, Eberhart K, Dorn C, et al. Lactic acid and acidification inhibit TNF secretion and glycolysis of human monocytes. J Immunol. 2009/12/23. 2010;184(3):1200–9. 10.4049/jimmunol.0902584 [DOI] [PubMed] [Google Scholar]
- 37.Devin A, Guérin B, Rigoulet M. Cytosolic NAD+ content strictly depends on ATP concentration in isolated liver cells. FEBS Lett [Internet]. 1997;410(2):329–32. Available from: http://www.sciencedirect.com/science/article/pii/S0014579397006121 [DOI] [PubMed] [Google Scholar]
- 38.Magistretti PJ, Allaman I. A Cellular Perspective on Brain Energy Metabolism and Functional Imaging. Neuron [Internet]. 2015;86(4):883–901. Available from: http://www.sciencedirect.com/science/article/pii/S0896627315002597 [DOI] [PubMed] [Google Scholar]
- 39.Romero-Garcia S, Moreno-Altamirano MMB, Prado-Garcia H, Sánchez-García FJ. Lactate Contribution to the Tumor Microenvironment: Mechanisms, Effects on Immune Cells and Therapeutic Relevance. Front Immunol [Internet]. 2016. February 16;7:52 Available from: http://www.ncbi.nlm.nih.gov/pmc/articles/PMC4754406/ [DOI] [PMC free article] [PubMed] [Google Scholar]
- 40.Jackson VN, Halestrap AP. The kinetics, substrate, and inhibitor specificity of the monocarboxylate (lactate) transporter of rat liver cells determined using the fluorescent intracellular pH indicator, 2’,7’-bis(carboxyethyl)-5(6)-carboxyfluorescein. J Biol Chem. 1996/01/12. 1996;271(2):861–8. [DOI] [PubMed] [Google Scholar]
- 41.Sonveaux P, Vegran F, Schroeder T, Wergin MC, Verrax J, Rabbani ZN, et al. Targeting lactate-fueled respiration selectively kills hypoxic tumor cells in mice. J Clin Invest. 2008. December;118(12):3930–42. 10.1172/JCI36843 [DOI] [PMC free article] [PubMed] [Google Scholar]
- 42.Feron O. Pyruvate into lactate and back: from the Warburg effect to symbiotic energy fuel exchange in cancer cells. Radiother Oncol. 2009. September;92(3):329–33. 10.1016/j.radonc.2009.06.025 [DOI] [PubMed] [Google Scholar]
- 43.Shestov AA, Liu X, Ser Z, Cluntun AA, Hung YP, Huang L, et al. Quantitative determinants of aerobic glycolysis identify flux through the enzyme GAPDH as a limiting step. Elife. 2014. July;3. [DOI] [PMC free article] [PubMed] [Google Scholar]
- 44.Gholami AM, Hahne H, Wu Z, Auer FJ, Meng C, Wilhelm M, et al. Global proteome analysis of the NCI-60 cell line panel. Cell Rep. 2013. August;4(3):609–20. 10.1016/j.celrep.2013.07.018 [DOI] [PubMed] [Google Scholar]
- 45.Yang Y, Nadanaciva S, Will Y, Woodhead JL, Howell BA, Watkins PB, et al. MITOsym®: A Mechanistic, Mathematical Model of Hepatocellular Respiration and Bioenergetics. Pharm Res [Internet]. 2015;32(6):1975–92. Available from: 10.1007/s11095-014-1591-0 [DOI] [PMC free article] [PubMed] [Google Scholar]
- 46.Marcu R, Wiczer BM, Neeley CK, Hawkins BJ. Mitochondrial matrix Ca2+ accumulation regulates cytosolic NAD+/NADH metabolism, protein acetylation, and sirtuin expression. Mol Cell Biol [Internet]. 2014. August;34(15):2890–902. Available from: https://www.ncbi.nlm.nih.gov/pubmed/24865966 10.1128/MCB.00068-14 [DOI] [PMC free article] [PubMed] [Google Scholar]
Associated Data
This section collects any data citations, data availability statements, or supplementary materials included in this article.
Supplementary Materials
(DOCX)
Zip file containing EFA data.
(ZIP)
Zip file containing complete model code for simulation.
(ZIP)
Zip file containing html versions of model code.
(ZIP)
Data Availability Statement
All relevant data are within the manuscript and its Supporting Information files.


