Abstract
BACKGROUND. Chronic obstructive pulmonary disease (COPD) is characterized by airway remodeling. Characterization of airway changes on computed tomography has been challenging due to the complexity of the recurring branching patterns, and this can be better measured using fractal dimensions.
METHODS. We analyzed segmented airway trees of 8,135 participants enrolled in the COPDGene cohort. The fractal complexity of the segmented airway tree was measured by the Airway Fractal Dimension (AFD) using the Minkowski-Bougliand box-counting dimension. We examined associations between AFD and lung function and respiratory morbidity using multivariable regression analyses. We further estimated the extent of peribronchial emphysema (%) within 5 mm of the airway tree, as this is likely to affect AFD. We classified participants into 4 groups based on median AFD, percentage of peribronchial emphysema, and estimated survival.
RESULTS. AFD was significantly associated with forced expiratory volume in one second (FEV1; P < 0.001) and FEV1/forced vital capacity (FEV1/FVC; P < 0.001) after adjusting for age, race, sex, smoking status, pack-years of smoking, BMI, CT emphysema, air trapping, airway thickness, and CT scanner type. On multivariable analysis, AFD was also associated with respiratory quality of life and 6-minute walk distance, as well as exacerbations, lung function decline, and mortality on longitudinal follow-up. We identified a subset of participants with AFD below the median and peribronchial emphysema above the median who had worse survival compared with participants with high AFD and low peribronchial emphysema (adjusted hazards ratio [HR]: 2.72; 95% CI: 2.20–3.35; P < 0.001), a substantial number of whom were not identified by traditional spirometry severity grades.
CONCLUSION. Airway fractal dimension as a measure of airway branching complexity and remodeling in smokers is associated with respiratory morbidity and lung function change, offers prognostic information additional to traditional CT measures of airway wall thickness, and can be used to estimate mortality risk.
TRIAL REGISTRATION. ClinicalTrials.gov identifier: NCT00608764.
FUNDING. This study was supported by NIH K23 HL133438 (SPB) and the COPDGene study (NIH Grant Numbers R01 HL089897 and R01 HL089856). The COPDGene project is also supported by the COPD Foundation through contributions made to an Industry Advisory Board comprised of AstraZeneca, Boehringer Ingelheim, Novartis, Pfizer, Siemens, Sunovion and GlaxoSmithKline.
Keywords: Pulmonology
Keywords: COPD
Introduction
Airflow obstruction in chronic obstructive pulmonary disease (COPD) is a result of both emphysema and airway disease (1, 2). Advances in computed tomographic (CT) imaging have enabled localization and quantification of structural changes in lung parenchyma, resulting in improved phenotyping of COPD (3, 4). CT emphysema is associated with respiratory morbidity and change in lung function, as well as with mortality (5–8). Although equally important, airway disease has been harder to characterize, and the presence and severity of airway remodeling have been variously quantified using measurements from the segmental and subsegmental airways. These include airway wall measurements such as bronchial diameter, airway wall area, airway wall thickness, and the tortuosity of airway branches (9–11). These measurements describe the morphology of individual branches or specific generations and, in serving as surrogates of overall airway remodeling, assume that the airway tree geometry follows Euclidean relationships that can be represented in integer dimensions. However, the airway tree possesses a complex self-repeating geometry that is specific for each individual, and this branching pattern is represented better in fractional dimensions (12, 13).
Fractal geometry is the study of structures that seem chaotic but exhibit a hierarchal self-similar pattern (12). Using airway casts, Weibel demonstrated that fractal geometry is useful in characterizing the complex self-repeating airway branching patterns that are necessary for efficient gas exchange (13). Fractal dimensions have been used previously in several applications to explain regional ventilation (14), pulmonary vessel branching and blood flow patterns (15, 16), pulmonary arterial hypertension (17, 18), emphysema grouping in the lungs (19), and to quantify airway remodeling in digitized airway casts in asthmatics (20). It is likely that the same branching patterns that enhance efficient airflow and gas transfer in healthy individuals are associated with increased turbulence, airflow obstruction, and impaired airflow distribution in the setting of perturbations in the branching patterns. Using data from CT scans obtained from smokers with and without COPD, we hypothesized that the airway fractal dimension (AFD) provides a precise summative measurement of the morphological changes in the airways in COPD, and that airway fractals are associated with respiratory morbidity, lung function decline, and all-cause mortality.
Results
Participants.
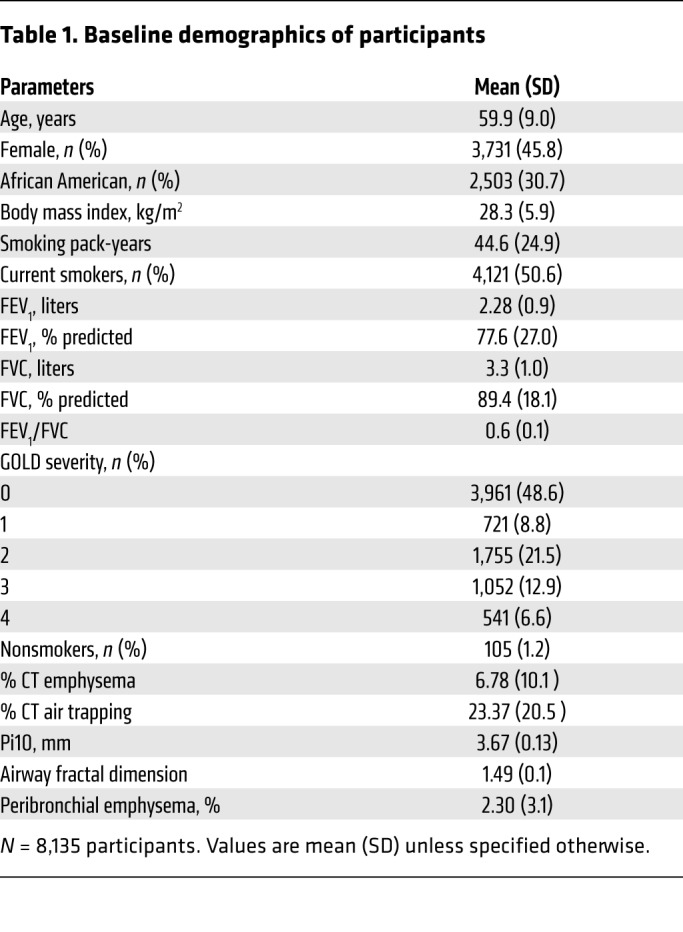
We measured AFD in the 8,135 participants from the Genetic Epidemiology of COPD (COPDGene) cohort for whom we had complete airway segmentations. Characteristics of subjects are shown in Table 1. Participants included 105 (1.2%) lifetime nonsmokers (i.e., they had never smoked), 3,961 (48.6%) without airflow obstruction (Global Initiative for Obstructive Lung Disease [GOLD] stage 0), and 721 (8.8%), 1,755 (21.5%), 1,052 (12.9%), and 541 (6.6%) with GOLD stages 1 to 4, respectively. The study participants included 4,121 (52.6%) active smokers and 2,503 (30.7%) African Americans. The mean AFD was 1.56 (SD 0.07) for nonsmokers, and 1.52 (0.09), 1.50 (0.08), 1.46 (0.08), 1.45 (0.07), and 1.45 (0.07) for GOLD stages 0 through 4, respectively (trend test, P < 0.0001).
Table 1. Baseline demographics of participants.
AFD and lung function.
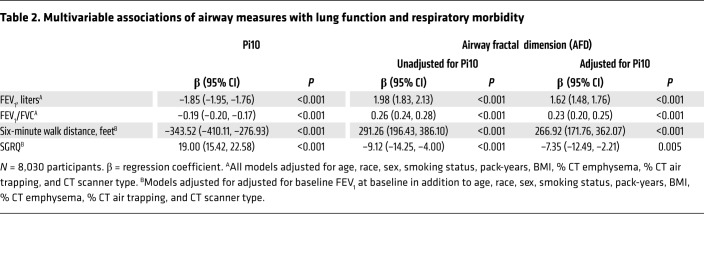
AFD correlated significantly with FEV1 (r = 0.35; P < 0.001) and FEV1/FVC (r = 0.26; P < 0.001). After adjustment for age, race, sex, smoking status, pack-years of smoking, BMI, percentage of CT emphysema (% CT emphysema), percentage of CT air trapping (% CT air trapping), Pi10 (square root of the wall area of a hypothetical airway with a lumen perimeter of 10 mm), and CT scanner type, AFD remained significantly associated with FEV1 (adjusted β: 1.62; 95% CI: 1.48–1.76; P < 0.001) as well as with FEV1/FVC (adjusted β: 0.23; 95% CI: 0.20–0.25; P < 0.001) (Table 2, and Supplemental Table 4).
Table 2. Multivariable associations of airway measures with lung function and respiratory morbidity.
AFD and respiratory morbidity.
AFD was significantly associated with respiratory quality of life measured by Saint George’s Respiratory Questionnaire (SGRQ) (adjusted β: –7.35; 95% CI: –12.49 to –2.21; P = 0.005) after adjustment for age, race, sex, smoking status, pack-years, BMI, FEV1 at baseline, % CT emphysema, % CT air trapping, Pi10, and CT scanner type. Similarly, AFD was also significantly associated with 6-minute walk distance (6 MWD) (adjusted β: 266.92; 95% CI: 171.76–362.07; P < 0.001) (Table 2).
AFD and exacerbations.
We had follow-up data for exacerbations on 5,761 participants (median: 6.6 years; range: 0.2–9.5 years). After adjustment for age, sex, race, BMI, FEV1, pack-years of smoking, current smoking status, and emphysema, AFD was associated with the total number of exacerbations (incidence risk ratio [IRR]: 0.17; 95% CI: 0.10–0.29; P < 0.001) and with severe exacerbations (IRR: 0.20; 95% CI: 0.10–0.41; P < 0.001).
AFD and FEV1 change.
We had follow-up spirometry for 3,948 participants for a median duration of 64 months (interquartile range [IQR]: 60–68 months). In models evaluating associations with change in FEV1 after 5-year follow-up with adjustment for age, race, sex, BMI, smoking status, pack-years of smoking, % CT emphysema, FEV1 at baseline, and CT scanner type, Pi10 was not associated with FEV1 change (adjusted β: –2.04; 95% CI: –17.76–13.66; P = 0.798) but AFD was associated with FEV1 change (adjusted β: –31.55; 95% CI: –52.74 to –10.36; P = 0.003). This relationship between AFD and FEV1 change held true in combined models that included adjustment for Pi10 (adjusted β: –33.41; 95% CI: –54.28 to –12.55; P = 0.001).
Mild disease.
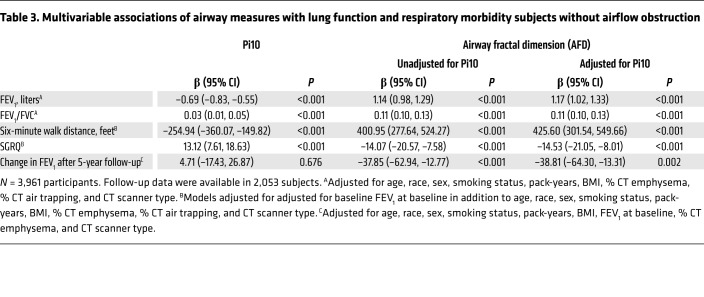
We assessed the value of AFD separately in subjects at risk for COPD but without airflow obstruction on spirometry (GOLD stage 0; n = 3,961). We found AFD was similarly associated with FEV1, FEV1/FVC, SGRQ, and 6 MWD (all P < 0.001) (Table 3). In addition, the inverse relationship between AFD and lung function decline was also seen in 2,053 participants with GOLD 0 on follow-up (adjusted β: –38.81; 95% CI: –64.30 to –13.31; P = 0.002) (Table 3).
Table 3. Multivariable associations of airway measures with lung function and respiratory morbidity subjects without airflow obstruction.
Survival.
Survival data was available in 7,154 participants for a median duration of 80 months (IQR: 71–88 months). In the entire cohort, 980 (13.7%) patients died over the period of follow-up, 188 (2.6%), 52 (0.7%), 236 (3.2%), 242 (3.3%), and 262 (3.6%) were in GOLD stages 0 through 4, respectively. After adjusting for age, race, sex, BMI, and pack-years of smoking, both Pi10 (adjusted HR: 15.74; 95% CI: 10.37–23.91; P < 0.001; Akaike information criterion [AIC]: 15,913.24) and AFD (adjusted HR: 0.04; 95% CI: 0.02–0.10; P < 0.001; AIC: 16,512.2) were significantly associated with mortality in subjects with COPD. In combined models with addition of Pi10 to the AFD model, AFD was still independently associated with mortality in COPD (adjusted HR: 0.14; 95% CI: 0.06–0.29; P < 0.001; AIC: 15,888.36).
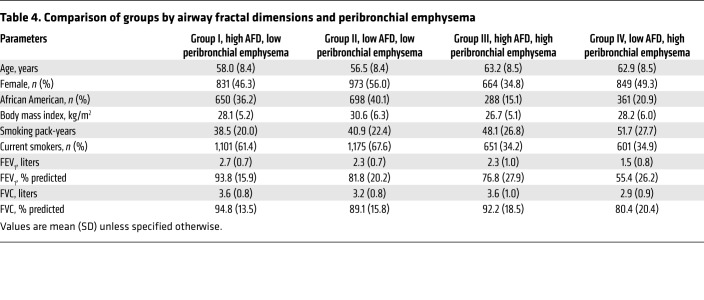
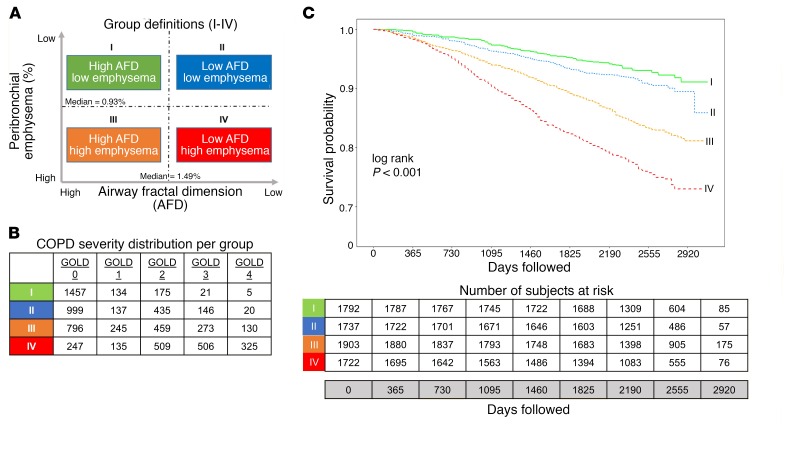
Table 4 shows baseline data for the 4 groups based on AFD and percentage of peribronchial emphysema. Figure 1A shows the 4 groups, and Figure 1B shows the distribution of participants by GOLD stage across the groups. Figure 1C shows survival curves for these groups. In groups I through IV, 122 (6.8%), 150 (8.6%), 309 (16.2%), and 399 (23.1%) participants died, respectively. Of note, a substantial proportion of participants in group IV had GOLD 0 (247; 14.3%) and GOLD 1 (135; 7.8%) disease. After adjustment for age, race, sex, and pack-years of smoking, the HRs for participants in groups II, III, and IV were 1.36 (95% CI: 1.07–1.73; P = 0.011), 1.69 (95% CI: 1.36–2.10; P < 0.001), and 2.72 (95% CI: 2.20–3.35; P < 0.001), respectively, compared with participants in group I.
Table 4. Comparison of groups by airway fractal dimensions and peribronchial emphysema.
Figure 1. Airway Fractal Dimension, Peribronchial Emphysema, and Survival.
(A) Group definitions based on median values of AFDs and percentage of peribronchial emphysema (PBE) estimated in 8,030 COPD subjects. Participants were stratified into high and low above the median for each metric. (B) Distribution of severity of airflow obstruction by GOLD criteria in each group. (C) Kaplan-Meier survival curves for the 4 groups based on AFD and percentage of peribronchial emphysema.
AFD: influence of airway narrowing and airway loss.
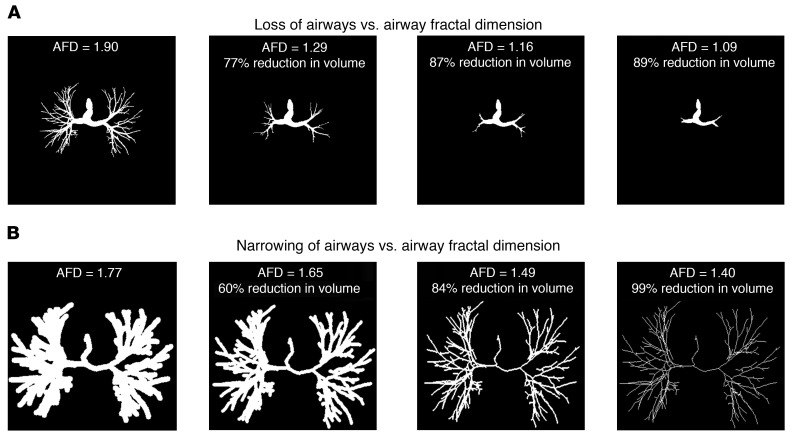
AFD is likely affected by multiple pathologic processes, including airway narrowing and airway loss, in addition to changes in branching angles and airway tortuosity, with major contributions from airway narrowing and airway loss. Total airway count is progressively reduced in subjects with increasing disease severity, and this loss is seen early in the disease process (21, 22). We ran simulation analyses where we progressively decreased the total intraluminal volume of the airways in a representative subject (Figure 2). As loss of airway branches cannot follow strict percentage volume loss to parallel the simulation of airway narrowing, a trend in loss of volume that parallels airway narrowing is shown in Figure 2. We found that for a given decrease in intraluminal volume, AFD is more significantly affected by loss of airways than by narrowing of airways. This influence of loss of airways is unlikely to be captured by Pi10, which relies on measurements of existing airways.
Figure 2. Impact of loss versus narrowing of airways on AFD.
Panel showing change in AFD sequentially with loss of small airway branches (A) and with progressive narrowing of airways (B). Changes shown are by simulation in a representative subject’s airways. The 3D images are projected as 2D for representation.
Discussion
In a cohort of smokers, we demonstrated that the fractal dimension of the airway tree, a measure of airway branching complexity and remodeling, is significantly associated with airflow obstruction and respiratory morbidity as well as with lung function decline after adjustment for traditional measures of airway narrowing. We also showed that a significant number of smokers without airflow obstruction, who would be considered to have mild or no disease by traditional classification schema, can be identified to have high mortality risk based on grouping using fractal dimensions and peribronchial emphysema.
Airway remodeling in cigarette smokers involves a complex combination of airway wall changes, luminal narrowing, and eventual attrition of airways (21, 23, 24). A number of imaging metrics are used to quantify these changes, including airway wall thickness, percentage of wall area, or the summary measures of the square roots of the wall areas of hypothetical airways with internal perimeters 10 mm and 15 mm (Pi10 and Pi15) (9, 25). Although these airway metrics have strong associations with lung function and respiratory morbidity (10, 26, 27), these classic geometrical measurements are limited to dimensions averaged over a few generations of segmental and subsegmental bronchi. They assume that changes in some generations of airways are reflective of changes throughout the airway tree, and do not capture the complex morphological changes in the airway tree, which is highly irregular with rough surfaces and self-similar bifurcations at each generation. As fractals show self-similarity, they may better reflect the stochastic airway luminal narrowing and branching changes throughout the airways.
Airway fractal dimensions have considerable clinical implications. The branching angles and tortuosity impact airflow dynamics, as well as smoke and drug deposition (28–30). Weibel theorized that the fractal nature of airway branching enables the large central airways with a cross-sectional area of 5 cm2 to bifurcate and eventually connect with the alveoli with a total surface area of 130 m2 (13). Although this fractal nature is vital for efficient gas flow and diffusion, abnormalities induced by narrowing and loss of airways, and changes in curvature and branching angles, can impact outcomes in disease. Even mild asymmetries in the branching patterns of successive generations can create large variations in ventilation at the terminal segments, resulting in inefficiency of gas exchange (15, 16). Indeed, exhaled aerosol patterns demonstrate fractal behavior, suggesting an influence of fractal patterns on airflow and particle deposition (31). Although branching morphogenesis is initiated early in utero during embryogenesis, the patterns might influence deposition of cigarette smoke and other environmental agents, and potentiate a series of events marked by lung injury and further impact on fractals. It is postulated that there is a clock mechanism for airway branching in the developmental period that is key in timing the rate of embryonic airway bud extension and thus the inter-branch distance (32). Once emphysema has set in, it likely plays a role in changing the fractals as a result of peribronchial emphysema exerting mechanical effects. Emphysema adjacent to the airways can change the branching angle by pushing the airways away from the area of emphysema, especially if this is associated with local air trapping due to poor elastic recoil. For example, emphysema present within the arc of a branch point may widen the branching angle, whereas emphysema that is laterally present may cause the branching angle to narrow. In addition, the presence of emphysema adjacent to the airways may also predispose the airways to collapse, due to the untethering of airways (33, 34).
Our finding of the importance of AFD in participants without overt airflow obstruction is of particular clinical importance. Multiple recent studies have shown that approximately half the subjects at risk for COPD but without airflow obstruction on spirometry have evidence for structural disease on CT (35, 36). The strong associations of AFD with respiratory quality of life and functional capacity support these earlier studies. In addition, AFD can be used to predict disease progression measured by lung function decline as well as mortality in these subjects. Studies of mild disease show that airway loss occurs early in COPD, findings that likely explain the loss of fractal dimension (22).
AFD has been previously measured on silicone rubber airway casts made from autopsy samples of asthmatic airways, and fatal asthmatics had lower fractal dimensions compared with those with nonfatal asthma and controls without asthma (20). Casts from the fatal asthma cases showed substantial remodeling with tapering of segments and irregularity of airways and ridges. Casts from nonfatal asthma were visually not different compared with controls, but AFD was substantially lower in these cases compared with controls (20). In contrast to these studies on airway casts, our results extend the application of fractal analysis to noninvasive CT image reconstruction of airway trees to quantify airway remodeling in COPD. We found that AFD was lower in those with COPD compared with normal participants of roughly similar age, and there was a progressive decrease in AFD with worsening disease stages (P < 0.001). A reduction in AFD reflects either a loss of the complex branching pattern, perhaps due to loss of airways, or a progressive narrowing of the airways. Recent studies have demonstrated this loss of airways in vitro as well as on CT images, and this loss of airways has an impact on clinical outcomes (21, 23, 37). This loss of complexity has also been shown in emphysema progression in mice using fractal analysis (33, 38). In this study, we found that AFD provides additional prognostic information over that provided by current Euclidean-based measures of airway remodeling.
We also found that fractal dimensions can be used to stratify mortality risk in smokers, and this risk stratification provides information that is different from the traditional spirometry-based severity grading. Indeed, a substantial number of participants in groups III and IV had GOLD 0 or 1 disease. Although both groups III and IV were characterized by a higher-than-median percentage of peribronchial emphysema, the additional mortality risk seen in group IV suggests that low AFD is associated with the worst survival rates. The discordance between low AFD groups and mild GOLD stages with differences in outcomes suggests that AFD provides prognostic information that is different from that provided by GOLD alone. Although the reasons for this association remain to be investigated, it could be the culmination of the adverse influence of low AFD and its implications towards airflow dynamics, cigarette smoke and other particle deposition, inefficiencies in ventilation and gas exchange, and perhaps deposition of inhaled medications as well. These findings, in combination with the association between AFD and lung function decline, suggest that low AFD is associated with greater risk of disease progression.
Our study has a number of strengths. The COPDGene study is a cohort of well-characterized participants that included healthy controls as well as smokers with a wide spectrum of disease severity. We showed the utility of this novel measure independent of traditional measures of airway narrowing. Participants were extensively phenotyped with stringent quality control for spirometry and CT. Our study also has a few limitations. We used cubes to fill the airways and measure AFD, whereas the use of other shapes such as 3D triangles could result in slightly different AFD values. However, box counting with cubes has been previously used and provides robust values for AFD. As AFD is a global measure of airway branching complexity, minor alterations in airway structure may be missed; however, these early changes are also likely to be missed using existing metrics that measure geometric averages. All airway measures can be affected by the volume of acquisition, the display field of view, and spatial resolution of CTs, and more efforts are being made to standardize CT acquisition protocols to minimize these factors. Three-dimensional CT resolution is continuing to increase and will drive improvements in AFD accuracy in the future by enabling the use of smaller cube sizes. We did not adjust outcomes for medication data, but no medication has been shown to alter disease outcomes such as lung function decline and mortality. Finally, we calculated all-cause mortality, as mortality causes have not been adjudicated.
Conclusions.
We found that the fractal dimension of the airway tree as a measure of airway remodeling in smokers is associated with respiratory morbidity, including exacerbations as well as lung function decline, and informs mortality risk beyond that inferred from airway wall thickness. Fractal dimensions may prove useful for phenotyping patients by providing a unique CT signature for modeling particle deposition and targeting drug delivery devices.
Methods
Participants.
We included participants enrolled in the Genetic Epidemiology of COPD (COPDGene) study, which is a large multicenter clinical trial involving nonsmokers and current and former smokers between ages 45 and 80 years with a smoking history of at least 10 pack-years; details of this study have been previously published (39). We included 10,300 participants at baseline and the first 5,000 participants who returned for a follow-up visit after approximately 5 years (CONSORT diagram in Supplemental Figure 1; supplemental material available online with this article; https://doi.org/10.1172/JCI120693DS1). At baseline and at follow-up, participants underwent extensive phenotypic characterization including demographics, CT imaging, and pre- and postbronchodilator spirometry. The presence of airflow obstruction was confirmed when the postbronchodilator ratio of the FEV1/FVC was less than 0.70. The GOLD recommendations were used to classify the severity of airflow obstruction (1). All participants performed a 6 MWD test to assess functional capacity, and the SGRQ was used to assess disease-specific impact on quality of life (40). Acute exacerbations were defined using a modified version of the Epidemiology Standardization Project questionnaire (American Thoracic Society–Division of Lung Disease-78) (41, 42). Exacerbations were defined as worsening in respiratory status with increase in dyspnea, cough, or sputum production that lasted at least 48 hours and required the use of either antibiotics and/or systemic steroids. Those exacerbations that resulted in hospitalization were categorized as severe exacerbations. Lung function change was assessed by the annualized change in FEV1 from enrollment to follow-up. We also obtained data on all-cause mortality on longitudinal follow-up. All participants provided written informed consent prior to enrollment and the COPDGene study protocol was approved by the University of Alabama at Birmingham Institutional Review Board (IRB) for Human Use (F070712014), and the IRBs of all 21 participating study centers (details in Supplemental Material).
CT imaging.
We analyzed volumetric CT scans acquired at baseline using multi-detector CT scanners at full inspiration (total lung capacity [TLC]). Voxels less than or equal to −950 Hounsfield units (HU) on inspiratory scans were labelled as regions with emphysema and voxels less than or equal to −856 HU on expiratory scans were labelled as regions of air trapping. Apollo Software (VIDA Diagnostics, Inc.) was used to segment the lungs and to reconstruct the 3D airway tree up to the sixth generation from the inspiratory CT image using an automated region-growing algorithm (43, 44). Completeness of the airway tree was visually assessed and manual corrections were performed in the case of discrepancies. Airway wall remodeling was quantified by estimating Pi10 (9, 25).
Airway fractal dimension.
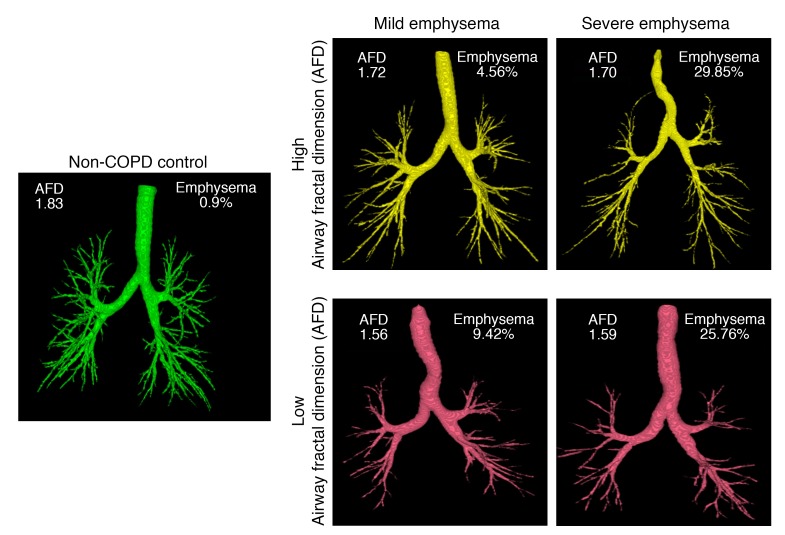
The fractal complexity of the segmented airway luminal tree was measured by the AFD using the Minkowski-Bougliand box-counting dimension (also known as Kolmogorov dimension) (13, 45). Details are provided in the Supplemental Material, and in Supplemental Figure 2. Briefly, the segmented airway tree was converted to a binary image for processing. Cubes of progressively increasing side length “s” (initial value of s = 1; increasing in powers of 2 to a maximum encompassing the image size) were iteratively overlaid over the binary airway mask and the number of cubes “N” overlapping with the airway were identified at each iteration. The number of cubes required to cover the airway is related to the size of the cube by an inverse power law. The slope of the least-squares best-fit regression line between the log N and log 1/s was computed to derive the AFD. The greater the complexity of how the branches fill space, the greater the AFD. Figure 3 shows representative examples of the AFD of subjects with varying severity of emphysema. All fractal computations were performed using MATLAB software (Math Works).
Figure 3. Segmented airway tree and AFD in representative participants who are nonsmoking and healthy, or with combinations of different degrees of AFD and emphysema.
Simulation of airway loss.
As AFD can be affected by airway narrowing and loss of airways, both processes commonly seen in COPD, we simulated these processes in a representative subject’s airways. The change in AFD in the case of airway loss was estimated by iteratively cutting down distal branches with specific lumen diameter per iteration (Figure 2). Similarly, in the case of airway narrowing, a distance map was initially calculated on the airway mask and an iterative binary thinning algorithm was implemented to simulate airway narrowing.
Peribronchial emphysema.
As airway branching angles can potentially be affected by emphysema adjacent to the airways with resultant mechanical forces, and this can influence the AFD, we further quantified the percentage of peribronchial emphysema within 5 mm of the airway tree (Supplemental Figure 3).
Grouping of COPD subjects using AFD and percentage of peribronchial emphysema.
As AFD can be influenced by innate airway geometry, airway remodeling, and peribronchial emphysema, we divided participants into 4 groups based on median AFD and median percentage of peribronchial emphysema estimated from all subjects in the cohort, after excluding never-smokers (Figure 1A). Groups I and III are composed of participants with AFD greater than the median and with percentage of peribronchial emphysema lower and higher than the median, respectively. Groups II and IV are composed of participants with AFD lower than the median and with low and high percentage of peribronchial emphysema, respectively.
Statistics.
The parametric Pearson’s test was used to calculate correlations between AFD and lung function. Univariate and multivariable regression analyses were performed to test associations between AFD and respiratory morbidity (SGRQ and 6 MWD), FEV1/FVC, FEV1, and FEV1 change, after adjustment for age, race, sex, smoking status, pack-years of smoking, BMI, % CT emphysema, % CT air trapping, Pi10, and CT scanner type. All models were also adjusted for baseline FEV1 except in estimating the associations for FEV1 and FEV1/FVC. Multivariable models for FEV1 change included baseline FEV1 in addition to the above-mentioned variables. Using the aforementioned groups based on combinations of dichotomized AFD and percentage of peribronchial emphysema, we compared mortality rates using Kaplan-Meier survival analysis with log-rank test. To enable comparisons between the various radiological parameters and their associations with outcomes, we “normalized” the CT parameters by scaling and centering them by (value-mean)/SD. Thus, a 1 unit increase in a normalized metric is 1 SD. These results are presented separately in the Supplemental Material. The association between AFD and exacerbations were assessed using negative binomial regression models with adjustment for age, race, sex, BMI, pack-years of smoking, current smoking status, FEV1, and emphysema. The Cox proportional hazards model was used to calculate adjusted HRs for each group compared with group I as reference, after adjustment for age, race, sex, and pack-years of smoking. A 2-sided P value less than 0.05 was considered significant for all analyses. All analyses were performed using Statistical Package for the Social Sciences (SPSS V 24.0, SPSS) and R statistical software (V 3.2).
Author contributions
Study concept and design: SB, ASKP, SEG, and SPB. Acquisition, analysis, or interpretation of data: SB, ASKP, SEG, JMR, EAH, JDN, HPN, MLKH, GRW, RSJE, MTD, and SPB. Drafting of the manuscript: SB, ASKP, SEG, and SPB. Critical revision of the manuscript for important intellectual content: All authors. Statistical analysis: SB and SPB. Study supervision: All authors.
Supplementary Material
Acknowledgments
This study was supported by National Heart, Lung, and Blood Institute (NHLBI) grant K23HL133438 to SPB. The COPDGene study is supported by NIH grants R01 HL089897 and R01 HL089856. MKH is supported by K24 HL138188. Additional funding grants are: NIH R01HL130883 and R01HL126838 (to EAH); NIH R01HL116473 and R01HL122464 (to GRW); NIH R01HL116473, R01HL116931 and R21HL140422 (to RSJE); K24 HL138188 (to MLKH); Department of Defense Award W81XWH-15-1-0705 (to MTD). The COPDGene project is also supported by the COPD Foundation through contributions made to an Industry Advisory Board comprised of AstraZeneca, Boehringer Ingelheim, Novartis, Pfizer, Siemens, Sunovion, and GlaxoSmithKline. See Supplemental Acknowledgments for details of COPDGene Investigators.
Version 1. 09/26/2018
In-Press Preview
Version 2. 10/29/2018
Electronic publication
Version 3. 11/01/2018
Correction made in Figure 2, panel B.
Version 4. 12/03/2018
Print issue publication
Funding Statement
This study was supported by NHLBI grant K23HL133438 to SPB. The COPDGene study is supported by NIH Grant Numbers R01 HL089897 and R01 HL089856. MKH is supported by K24 HL138188. The COPDGene project is also supported by the COPD Foundation through contributions made to an Industry Advisory Board comprised of AstraZeneca, Boehringer Ingelheim, Novartis, Pfizer, Siemens, Sunovion and GlaxoSmithKline.
Footnotes
Role of funding source: The funding source had no role in the design of this study, the analyses and interpretation of the data, or the decision to submit results.
Conflict of interest: SPB received research funds to his institute from ProterixBio during the course of the study. EAH is a founder and shareholder of VIDA Diagnostics, a company commercializing lung image analysis software developed, in part, at the University of Iowa. JMR owns stocks from VIDA Diagnostics, Inc., and received personal fees from Science24Seven and Boehringer Ingelheim. RSJE received consulting fees from Boehringer Ingelheim and is co-owner of Quantitative Imaging Solutions. GRW received grants from Boehringer Ingelheim and BTG Interventional Medicine; consults for Boehringer Ingelheim, Genentech, PulmonX, Regeneron, Toshiba, and GlaxoSmithKline; co-owns Quantitative Imaging Solutions, advises for ModoSpira; and received grants and consulting fees from Janssen Pharmaceuticals. GRW’s spouse works for Biogen, which is focused on developing therapies for fibrotic lung disease. MKH received personal fees from GlaxoSmithKline, Boehringer Ingeheim, and AstraZeneca, and non-financial support from Novartis and Sunovion. MTD received personal fees and other from Boehringer Ingeheim, GlaxoSmithKline, AstraZeneca, and Boston Scientific; other from Novartis, Yungjin, PneumRx/BTG, and Pulmonx; and personal fees from Genentech. JDN received grants from Siemens Healthineers and Hoffman La-Roche, and personal fees from VIDA Diagnostics, Inc. JDN has a software patent issued (US14690391).
License: Copyright 2018, American Society for Clinical Investigation.
Reference information: J Clin Invest. 2018;128(12):5374–5382.https://doi.org/10.1172/JCI120693.
See the related Commentary at Seeing the forest for the trees: fractal dimensions measure COPD airway remodeling.
Contributor Information
Sandeep Bodduluri, Email: sbodduluri@uabmc.edu.
Abhilash S. Kizhakke Puliyakote, Email: akizhakkepuliyakote@ucsd.edu.
Sarah E. Gerard, Email: sarah-gerard@uiowa.edu.
Joseph M. Reinhardt, Email: joe-reinhardt@uiowa.edu.
Eric A. Hoffman, Email: eric-hoffman@uiowa.edu.
John D. Newell, Jr., Email: john-newell@uiowa.edu.
Hrudaya P. Nath, Email: hnath@uabmc.edu.
MeiLan K. Han, Email: mrking@umich.edu.
George R. Washko, Email: GWASHKO@PARTNERS.ORG.
Raúl San José Estépar, Email: RSANJOSE@BWH.HARVARD.EDU.
Mark T. Dransfield, Email: mdrans99@uab.edu.
Surya P. Bhatt, Email: sbhatt@uabmc.edu.
References
- 1.Vogelmeier CF, et al. Global strategy for the diagnosis, management, and prevention of chronic obstructive lung disease 2017 report. GOLD Executive Summary. Am J Respir Crit Care Med. 2017;195(5):557–582. doi: 10.1164/rccm.201701-0218PP. [DOI] [PubMed] [Google Scholar]
- 2.Hogg JC. Pathophysiology of airflow limitation in chronic obstructive pulmonary disease. Lancet. 2004;364(9435):709–721. doi: 10.1016/S0140-6736(04)16900-6. [DOI] [PubMed] [Google Scholar]
- 3.Han MK, et al. Chronic obstructive pulmonary disease phenotypes: the future of COPD. Am J Respir Crit Care Med. 2010;182(5):598–604. doi: 10.1164/rccm.200912-1843CC. [DOI] [PMC free article] [PubMed] [Google Scholar]
- 4.Hoffman EA, Lynch DA, Barr RG, van Beek EJ, Parraga G, IWPFI Investigators Pulmonary CT and MRI phenotypes that help explain chronic pulmonary obstruction disease pathophysiology and outcomes. J Magn Reson Imaging. 2016;43(3):544–557. doi: 10.1002/jmri.25010. [DOI] [PMC free article] [PubMed] [Google Scholar]
- 5.Gietema HA, Edwards LD, Coxson HO, Bakke PS, ECLIPSE Investigators Impact of emphysema and airway wall thickness on quality of life in smoking-related COPD. Respir Med. 2013;107(8):1201–1209. doi: 10.1016/j.rmed.2013.04.016. [DOI] [PubMed] [Google Scholar]
- 6.Grydeland TB, et al. Quantitative computed tomography measures of emphysema and airway wall thickness are related to respiratory symptoms. Am J Respir Crit Care Med. 2010;181(4):353–359. doi: 10.1164/rccm.200907-1008OC. [DOI] [PubMed] [Google Scholar]
- 7.Johannessen A, et al. Mortality by level of emphysema and airway wall thickness. Am J Respir Crit Care Med. 2013;187(6):602–608. doi: 10.1164/rccm.201209-1722OC. [DOI] [PubMed] [Google Scholar]
- 8.Vestbo J, et al. Changes in forced expiratory volume in 1 second over time in COPD. N Engl J Med. 2011;365(13):1184–1192. doi: 10.1056/NEJMoa1105482. [DOI] [PubMed] [Google Scholar]
- 9.Coxson HO. Quantitative computed tomography assessment of airway wall dimensions: current status and potential applications for phenotyping chronic obstructive pulmonary disease. Proc Am Thorac Soc. 2008;5(9):940–945. doi: 10.1513/pats.200806-057QC. [DOI] [PMC free article] [PubMed] [Google Scholar]
- 10.Mair G, et al. Airway dimensions in COPD: relationships with clinical variables. Respir Med. 2010;104(11):1683–1690. doi: 10.1016/j.rmed.2010.04.021. [DOI] [PubMed] [Google Scholar]
- 11.Nakano Y, et al. Computed tomographic measurements of airway dimensions and emphysema in smokers. Correlation with lung function. Am J Respir Crit Care Med. 2000;162(3 Pt 1):1102–1108. doi: 10.1164/ajrccm.162.3.9907120. [DOI] [PubMed] [Google Scholar]
- 12. Mandelbrot BB. The Fractal Geometry of Nature. New York, NY; Times Books: 1983.
- 13.Weibel ER. Fractal geometry: a design principle for living organisms. Am J Physiol. 1991;261(6 Pt 1):L361–L369. doi: 10.1152/ajplung.1991.261.6.L361. [DOI] [PubMed] [Google Scholar]
- 14.Altemeier WA, McKinney S, Glenny RW. Fractal nature of regional ventilation distribution. J Appl Physiol. 2000;88(5):1551–1557. doi: 10.1152/jappl.2000.88.5.1551. [DOI] [PubMed] [Google Scholar]
- 15.Glenny RW, Robertson HT. Fractal properties of pulmonary blood flow: characterization of spatial heterogeneity. J Appl Physiol. 1990;69(2):532–545. doi: 10.1152/jappl.1990.69.2.532. [DOI] [PubMed] [Google Scholar]
- 16.Glenny RW, Robertson HT. Fractal modeling of pulmonary blood flow heterogeneity. J Appl Physiol. 1991;70(3):1024–1030. doi: 10.1152/jappl.1991.70.3.1024. [DOI] [PubMed] [Google Scholar]
- 17.Boxt LM, Katz J, Liebovitch LS, Jones R, Esser PD, Reid L. Fractal analysis of pulmonary arteries: the fractal dimension is lower in pulmonary hypertension. J Thorac Imaging. 1994;9(1):8–13. doi: 10.1097/00005382-199424000-00002. [DOI] [PubMed] [Google Scholar]
- 18.Moledina S, et al. Fractal branching quantifies vascular changes and predicts survival in pulmonary hypertension: a proof of principle study. Heart. 2011;97(15):1245–1249. doi: 10.1136/hrt.2010.214130. [DOI] [PubMed] [Google Scholar]
- 19.Mishima M, et al. Complexity of terminal airspace geometry assessed by lung computed tomography in normal subjects and patients with chronic obstructive pulmonary disease. Proc Natl Acad Sci U S A. 1999;96(16):8829–8834. doi: 10.1073/pnas.96.16.8829. [DOI] [PMC free article] [PubMed] [Google Scholar]
- 20.Boser SR, Park H, Perry SF, Ménache MG, Green FH. Fractal geometry of airway remodeling in human asthma. Am J Respir Crit Care Med. 2005;172(7):817–823. doi: 10.1164/rccm.200411-1463OC. [DOI] [PubMed] [Google Scholar]
- 21.Kirby M, et al. Total airway count on computed tomography and the risk of chronic obstructive pulmonary disease progression. Findings from a population-based study. Am J Respir Crit Care Med. 2018;197(1):56–65. doi: 10.1164/rccm.201704-0692OC. [DOI] [PubMed] [Google Scholar]
- 22.Koo HK, et al. Small airways disease in mild and moderate chronic obstructive pulmonary disease: a cross-sectional study. Lancet Respir Med. 2018;6(8):591–602. doi: 10.1016/S2213-2600(18)30196-6. [DOI] [PubMed] [Google Scholar]
- 23.Hogg JC, et al. The nature of small-airway obstruction in chronic obstructive pulmonary disease. N Engl J Med. 2004;350(26):2645–2653. doi: 10.1056/NEJMoa032158. [DOI] [PubMed] [Google Scholar]
- 24.McDonough JE, et al. Small-airway obstruction and emphysema in chronic obstructive pulmonary disease. N Engl J Med. 2011;365(17):1567–1575. doi: 10.1056/NEJMoa1106955. [DOI] [PMC free article] [PubMed] [Google Scholar]
- 25.Patel BD, et al. Airway wall thickening and emphysema show independent familial aggregation in chronic obstructive pulmonary disease. Am J Respir Crit Care Med. 2008;178(5):500–505. doi: 10.1164/rccm.200801-059OC. [DOI] [PubMed] [Google Scholar]
- 26.Kim V, et al. Airway wall thickness is increased in COPD patients with bronchodilator responsiveness. Respir Res. 2014;15:84. doi: 10.1186/s12931-014-0084-3. [DOI] [PMC free article] [PubMed] [Google Scholar]
- 27.Washko GR, et al. Computed tomographic measures of airway morphology in smokers and never-smoking normals. J Appl Physiol. 2014;116(6):668–673. doi: 10.1152/japplphysiol.00004.2013. [DOI] [PMC free article] [PubMed] [Google Scholar]
- 28.Bauer K, Brücker C. The influence of airway tree geometry and ventilation frequency on airflow distribution. J Biomech Eng. 2015;137(8):081001. doi: 10.1115/1.4030621. [DOI] [PubMed] [Google Scholar]
- 29.Hofmann W. Modeling techniques for inhaled particle deposition: the state of the art. J Aerosol Med. 1996;9(3):369–388. doi: 10.1089/jam.1996.9.369. [DOI] [PubMed] [Google Scholar]
- 30.Sauret V, Halson PM, Brown IW, Fleming JS, Bailey AG. Study of the three-dimensional geometry of the central conducting airways in man using computed tomographic (CT) images. J Anat. 2002;200(Pt 2):123–134. doi: 10.1046/j.0021-8782.2001.00018.x. [DOI] [PMC free article] [PubMed] [Google Scholar]
- 31.Xi J, Si XA, Kim J, Mckee E, Lin EB. Exhaled aerosol pattern discloses lung structural abnormality: a sensitivity study using computational modeling and fractal analysis. PLoS ONE. 2014;9(8):e104682. doi: 10.1371/journal.pone.0104682. [DOI] [PMC free article] [PubMed] [Google Scholar]
- 32.Warburton D. Developmental biology: order in the lung. Nature. 2008;453(7196):733–735. doi: 10.1038/453733a. [DOI] [PMC free article] [PubMed] [Google Scholar]
- 33.Anderson AE, Foraker AG. Relative dimensions of bronchioles and parenchymal spaces in lungs from normal subjects and emphysematous patients. Am J Med. 1962;32:218–226. doi: 10.1016/0002-9343(62)90291-7. [DOI] [PubMed] [Google Scholar]
- 34.Copeland CR, et al. Paratracheal paraseptal emphysema and expiratory central airway collapse in smokers. Ann Am Thorac Soc. 2018;15(4):479–484. doi: 10.1513/AnnalsATS.201709-713OC. [DOI] [PMC free article] [PubMed] [Google Scholar]
- 35.Regan EA, et al. Clinical and radiologic disease in smokers with normal spirometry. JAMA Intern Med. 2015;175(9):1539–1549. doi: 10.1001/jamainternmed.2015.2735. [DOI] [PMC free article] [PubMed] [Google Scholar]
- 36.Woodruff PG, et al. Clinical significance of symptoms in smokers with preserved pulmonary function. N Engl J Med. 2016;374(19):1811–1821. doi: 10.1056/NEJMoa1505971. [DOI] [PMC free article] [PubMed] [Google Scholar]
- 37.Diaz AA, et al. Airway count and emphysema assessed by chest CT imaging predicts clinical outcome in smokers. Chest. 2010;138(4):880–887. doi: 10.1378/chest.10-0542. [DOI] [PMC free article] [PubMed] [Google Scholar]
- 38.Suki B, et al. Mechanical failure, stress redistribution, elastase activity and binding site availability on elastin during the progression of emphysema. Pulm Pharmacol Ther. 2012;25(4):268–275. doi: 10.1016/j.pupt.2011.04.027. [DOI] [PubMed] [Google Scholar]
- 39.Regan EA, et al. Genetic epidemiology of COPD (COPDGene) study design. COPD. 2010;7(1):32–43. doi: 10.3109/15412550903499522. [DOI] [PMC free article] [PubMed] [Google Scholar]
- 40.Jones PW, Quirk FH, Baveystock CM. The St George’s Respiratory Questionnaire. Respir Med. 1991;85 Suppl B:25–31; discussion 33. doi: 10.1016/s0954-6111(06)80166-6. [DOI] [PubMed] [Google Scholar]
- 41.Ferris BG. Epidemiology Standardization Project (American Thoracic Society) Am Rev Respir Dis. 1978;118(6 Pt 2):1–120. [PubMed] [Google Scholar]
- 42.Wells JM, et al. Pulmonary arterial enlargement and acute exacerbations of COPD. N Engl J Med. 2012;367(10):913–921. doi: 10.1056/NEJMoa1203830. [DOI] [PMC free article] [PubMed] [Google Scholar]
- 43.Lo P, et al. Extraction of airways from CT (EXACT’09) IEEE Trans Med Imaging. 2012;31(11):2093–2107. doi: 10.1109/TMI.2012.2209674. [DOI] [PubMed] [Google Scholar]
- 44.Tschirren J, Hoffman EA, McLennan G, Sonka M. Intrathoracic airway trees: segmentation and airway morphology analysis from low-dose CT scans. IEEE Trans Med Imaging. 2005;24(12):1529–1539. doi: 10.1109/TMI.2005.857654. [DOI] [PMC free article] [PubMed] [Google Scholar]
- 45.Dubuc B, Quiniou JF, Roques-Carmes C, Tricot C, Zucker SW. Evaluating the fractal dimension of profiles. Phys Rev A Gen Phys. 1989;39(3):1500–1512. doi: 10.1103/PhysRevA.39.1500. [DOI] [PubMed] [Google Scholar]
Associated Data
This section collects any data citations, data availability statements, or supplementary materials included in this article.


