Abstract
Acute myeloid leukemia (AML) and myelodysplastic syndromes (MDS) are associated with disease-initiating stem cells that are not eliminated by conventional therapies. Transcriptomic analysis of stem and progenitor populations in MDS and AML demonstrated overexpression of STAT3 that was validated in an independent cohort. STAT3 overexpression was predictive of a shorter survival and worse clinical features in a large MDS cohort. High STAT3 expression signature in MDS CD34+ cells was similar to known preleukemic gene signatures. Functionally, STAT3 inhibition by a clinical, antisense oligonucleotide, AZD9150, led to reduced viability and increased apoptosis in leukemic cell lines. AZD9150 was rapidly incorporated by primary MDS/AML stem and progenitor cells and led to increased hematopoietic differentiation. STAT3 knockdown also impaired leukemic growth in vivo and led to decreased expression of MCL1 and other oncogenic genes in malignant cells. These studies demonstrate that STAT3 is an adverse prognostic factor in MDS/AML and provide a preclinical rationale for studies using AZD9150 in these diseases.
Keywords: Hematology, Stem cells
Keywords: Hematopoietic stem cells, Signal transduction
Introduction
Myelodysplastic syndromes (MDS) and acute myeloid leukemia (AML) are malignant hematopoietic stem cell disorders that arise from a population of aberrant stem cells residing within the hematopoietic stem and progenitor cell (HSPC) compartments (1–6). Precisely defined qualitative and quantitative alterations in HSPCs have recently been demonstrated in MDS and AML. FACS analysis using rigorous lineage depletion revealed that phenotypic long-term hematopoietic stem cell (LT-HSC), short-term HSC (ST-HSC), and granulocyte-monocyte progenitor (GMP) compartments are expanded in high-risk MDS and AML, and they have been shown to contain leukemia-initiating activity in various models. These aberrant HSPCs have been shown to persist through cytotoxic chemotherapy and expand at the time of relapse (3, 7). Thus, curative strategies need to target these disease-initiating and relapse-causing stem and progenitor compartments.
We have previously demonstrated that the transcription factor signal transducer and activator of transcription 3 (STAT3) is overexpressed in marrow-derived MDS CD34+ cells (7, 8). The Janus kinase (JAK)/STAT pathway, especially STAT3, has been an attractive therapeutic target in many cancer stem cell models, but has been hard to selectively inhibit therapeutically. AZD9150 is a generation 2.5 antisense oligonucleotide (ASO) that is a specific inhibitor of STAT3. It has previously demonstrated efficacy and safety in heavily pretreated lymphoma and solid-tumor patients (9). Therapeutic antisense technology has greatly advanced since its inception 20 years ago and is approved for clinical use in various indications. This includes approvals of generation 2.0 ASOs for usage in homozygous familial hypercholesterolemia (Kynamro) and infantile spinomuscular atrophy (Spinraza) (10, 11). Generation 2.0 ASOs are incorporated predominantly in liver, kidney, and adipose tissue when delivered systemically. To achieve potent activity in extrahepatic tissues, including tumors, a next-generation ASO chemistry was developed. Generation 2.5 ASOs have higher affinity and greater intrinsic potency compared with generation 2.0 and previous ASOs owing to an 8′–10′ phosphorothioate-modified deoxynucleotide “gap” flanked on either end with 2–3 cEt nucleotides (12, 13). Furthermore, AZD9150 targets nucleotide sequences that are found only in the human STAT3 gene and are not present in the murine STAT3 gene, underscoring the specificity of the drug (9, 14).
In this study, we demonstrate that STAT3 is significantly overexpressed in highly purified AML and MDS LT-HSCs, ST-HSCs, and GMPs compared with healthy controls and is associated with poor prognosis. Functional studies show that inhibition of STAT3 with AZD9150 can inhibit leukemic growth in vitro and in vivo. These data indicate that the STAT3 pathway is frequently aberrantly activated in AML and MDS stem cells and that ASO-mediated inhibition of STAT3 can serve as a novel way to impair MDS/AML stem cells.
Results
STAT3 is overexpressed in MDS and AML HSPCs and is associated with an adverse prognosis.
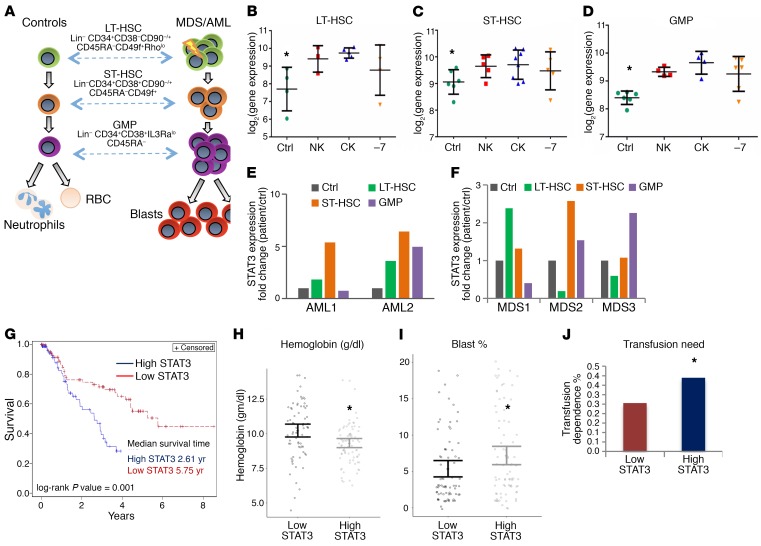
Leukemia and myelodysplasia disease-initiating cells, including preleukemic stem cells, reside in the lineage-negative, phenotypic stem and progenitor compartments. To determine STAT3 expression levels in highly purified AML and MDS stem and progenitor cells, we examined gene expression profiles generated from FACS-sorted LT-HSCs, ST-HSCs, and GMPs from 12 MDS/AML samples with normal karyotype, deletion of chromosome 7, and complex karyotype (Figure 1A) (Gene Expression Omnibus [GEO], GSE35008 and GSE35010). We observed that STAT3 was significantly overexpressed in HSC and GMP populations, across normal karyotype, complex karyotype, and deletion of chromosome 7 cases (Figure 1, B–D). These results were validated in an independent cohort of samples by quantitative PCR (qPCR). Two AML, 3 MDS, and 2 healthy control samples were sorted and analyzed and were confirmed to have significant upregulation of STAT3 in at least 1 of the 3 disease-initiating populations examined in each disease sample when compared with controls (Figure 1, E and F).
Figure 1. STAT3 is overexpressed in MDS and AML HSCs and progenitors and is associated with worse prognosis.
(A–D) Gene expression data from sorted MDS/AML bone marrow samples were compared with data from healthy controls (Ctrl) and revealed significantly increased STAT3 expression in LT-HSCs (Lin–, CD34+, CD38–, CD90–, n = 12 MDS/AML, healthy control [HC] = 4), ST-HSCs (Lin–, CD34+, CD38–, CD90), and GMPs (Lin–, CD34+, CD38+, CD90+, CD123+) (P < 0.001, FDR < 5%). (E and F) Cytogenetic abnormalities are depicted as: NK, normal karyotype; CK, complex karyotype; –7, deletion of chromosome 7. “Ctrl” refers to healthy control sorted populations. qPCR on an independent cohort of sorted cells from controls and MDS and AML samples reveals increased expression of STAT3 in MDS/AML HSCs (LT/ST) and GMPs. (G) Survival of 183 MDS patients was correlated with STAT3 expression in marrow-derived CD34+ cells. Patients with higher STAT3 levels (greater than median) had a median survival of 2.6 years compared with 5.8 years for the group with lower STAT3 (log-rank P < 0.01). (H–J) Patients with high STAT3 expression also had significantly reduced mean hemoglobin levels, a higher blast percentage, and increased transfusion dependence. Test of proportions, *P < 0.05.
We next evaluated STAT3 overexpression for prognostic impact in a large cohort of MDS CD34+ cells and observed that samples with higher expression (greater than median expression) had a significantly worse prognosis compared with low STAT3 expressers (median overall survival of 2.61 years in high-STAT3 cases vs. 5.75 years in low-STAT3 cases, log-rank P value = 0.001) (Figure 1G). Patients with high STAT3 were found to present with worse disease phenotype, manifesting with lower hemoglobin levels (Figure 1H) and a higher percentage of transfusion dependence (40% for high-STAT3 vs. 30% for low-STAT3 cases, P < 0.05) (Figure 1J). These patients also had a significantly higher percentage of myeloblasts in the marrow (Figure 1I), demonstrating STAT3 as an adverse prognostic factor in MDS. A multivariate analysis using International Prognostic Scoring System (IPSS) score as a variable was also conducted and demonstrated that high STAT3 was an independent adverse prognostic factor (P = 0.02, multivariate Cox proportional model).
Gene expression signature of MDS HSPCs with high STAT3 is similar to known preleukemic stem cell profiles and includes many important functional pathways.
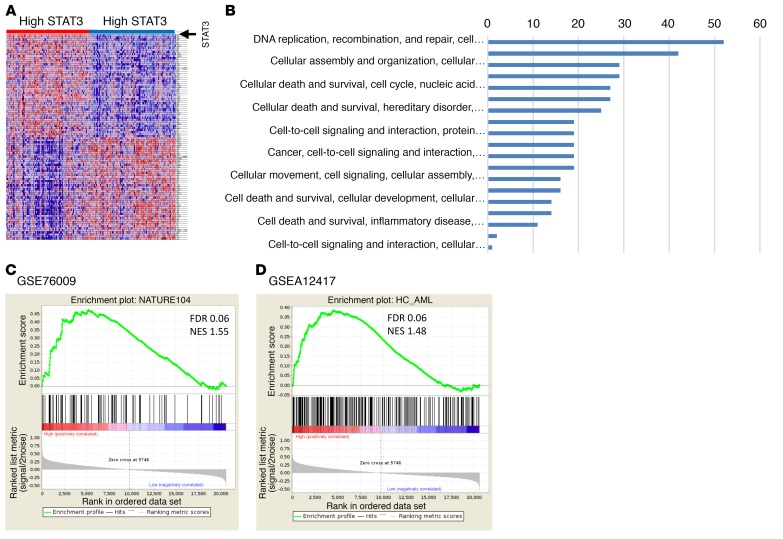
To determine the molecular pathways that were differentially activated in MDS HSPCs with high expression of STAT3, we identified 413 differentially expressed genes (with 312 more abundant and 101 less abundant transcripts) in samples with higher STAT3 levels (using median STAT3 expression as cutoff in a cohort of 183 MDS CD34+ samples, FDR < 0.1) (Figure 2A). Pathway analysis revealed significant dysregulation of pathways involved in DNA replication, gene expression, and cell death and survival in high-STAT3 samples, and also included many genes that play important roles in molecular leukemogenesis (Figure 2B and Supplemental Table 2; supplemental material available online with this article; https://doi.org/10.1172/JCI120156DS1). Next, we tested whether the high STAT3 expression signature had any overlap with known preleukemic stem cell gene expression signatures. Gene set enrichment analysis (GSEA) with 2 recently published preleukemic stem cell signatures, GSE76009 (15) and GSEA12417 (16), revealed highly significant enrichment, demonstrating that HSPCs from high-STAT3 MDS patients have a transcriptomic profile similar to known preleukemic and leukemia-initiating cell populations (Figure 2, C and D). Furthermore, we evaluated for correlation of high STAT3 expression with mutational subgroups in 100 samples on which targeted sequencing had been conducted (17). We observed that high STAT3 expression was significantly associated with TP53 (12.5% in high-STAT3 group vs. 0% in low-STAT3 group, P = 0.03) and STAG2 (18% in high-STAT3 group vs. 2% in low-STAT3 group, P = 0.03).
Figure 2. Important functional pathways are dysregulated in MDS CD34+ samples with high expression of STAT3.
(A) Gene expression profiles from samples with low and high STAT3 were compared, and differentially expressed transcripts were identified (FDR < 0.1). (B) Significantly dysregulated pathways are shown. (C and D) The gene signature of high-STAT3 MDS cases is similar to previously published preleukemic stem cell signatures (ref. 15, C; ref. 16, D). Gene set enrichment analysis (GSEA) plots show significant enrichment of 2 recent preleukemic gene expression signatures.
AZD9150 selectively inhibits STAT3, decreases proliferation, and activates apoptosis in leukemic cells.
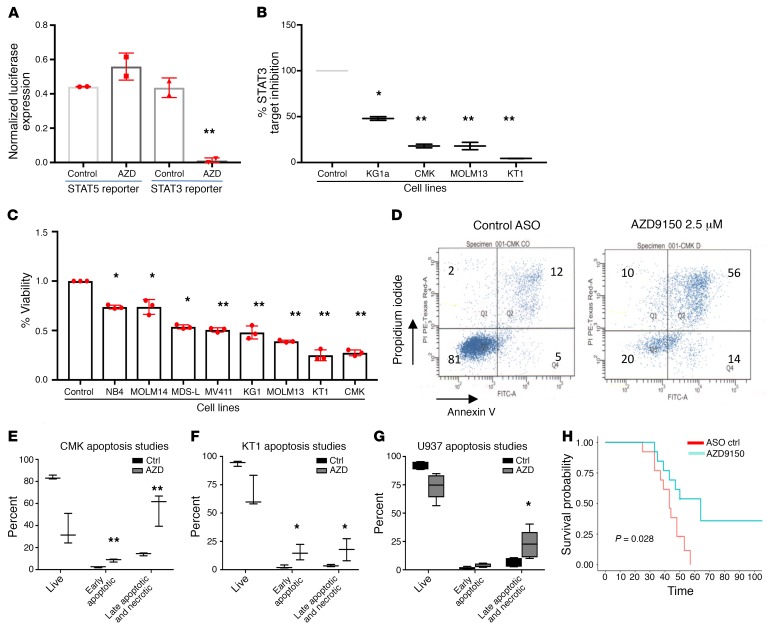
AZD9150 is a next-generation, constrained ethyl-modified ASO (generation 2.5) targeting STAT3 that has been shown to be safe for human use in a phase I trial in solid tumors (9). We determined that AZD9150 elicits specific target inhibition of STAT3 in hematopoietic cells without affecting STAT5 when compared with a structural analog control oligonucleotide in reporter assays (Figure 3A). AZD9150 was also able to significantly reduce STAT3 mRNA levels in several leukemic cell lines (Figure 3B). To determine the functional effects of STAT3 inhibition, we next treated several leukemia and MDS-derived cell lines with AZD9150. In contrast to cells treated with nontargeting control (NTC) oligonucleotide, AZD9150 treatment led to significantly decreased viability in all cell lines examined (Figure 3C), and the inhibition observed was found to be dose dependent (Supplemental Figure 3). This decrease in viable cells was accompanied by increased apoptosis (Figure 3, D–G). Next, we treated one of the tested cell lines, CMK, with AZD9150 or the NTC and xenografted them in immunodeficient nonobese diabetic scid γ (NSG) mice. We observed that mice with AZD9150-treated leukemia cells showed a significantly improved median survival of 64 days compared with 43 days for the controls (P = 0.028) (Figure 3H), demonstrating that STAT3 inhibition mediated by ASO leads to impaired leukemic cell growth ex vivo as well as in vivo.
Figure 3. AZD9150 specifically inhibits STAT3 and decreases viability and induces apoptosis in leukemic cell lines.
(A) To demonstrate specific inhibition of STAT3-mediated gene expression, we treated the CMK cell lines transfected with STAT3- and STAT5-binding luciferase constructs with AZD9150 (2.5 μM) and control. A decrease in STAT3-mediated luciferase expression was observed, while no change in STAT5-mediated gene expression was seen. (B) qPCR of 4 leukemic cell lines transfected with AZD9150 (10 μM) showed a decreased expression of STAT3. (C) Multiple leukemic cells lines were transfected with AZD9150 (10 μM) and inactive structural analog control (10 μM). AZD9150 resulted in a significant decrease in viable cells. (D) Representative flow cytometry plots show increased apoptosis with AZD9150 treatment (5 μM) compared with the control oligonucleotide (5 μM). (E–G) Increased apoptosis was seen in multiple leukemic cell lines after AZD9150 transfection as compared with controls. (H) NOD-SCID mice were injected with CMK cells transfected with AZD9150 (10 μM) and the control oligonucleotide (10 μM). The 2 cohorts were followed over time for survival, and it was noted that the drug-treated mice had an improved median survival of 64 days compared with 43 days for the control oligonucleotide (P = 0.028). *P ≤ 0.05, **P ≤ 0.005.
AZD9150 is rapidly incorporated by primary MDS/AML stem and progenitor cells and leads to STAT3 inhibition.
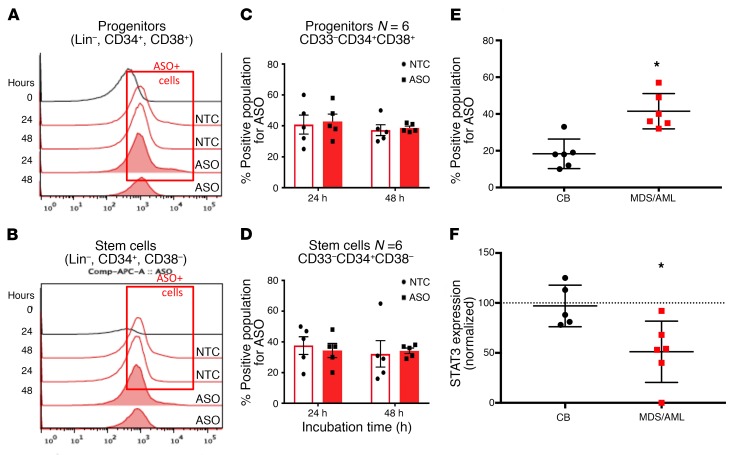
The increased potency of generation 2.5 ASOs over previous ASO chemistries enables the delivery of a sufficient amount of ASO to cells in culture or in vivo without the need for any type of delivery vehicle (9, 18). Thus, we evaluated the ability of AZD9150 formulated in saline to be incorporated by primary stem and progenitor cells. We exposed MDS/AML (n = 8) and healthy cord blood (n = 5) stem and progenitor cells to AZD9150 and the control oligonucleotide in liquid culture and performed intracellular flow cytometry with antibodies against the ASO backbone. We observed rapid uptake of ASOs (AZD9150 identified as ASO, control oligonucleotide identified as NTC) by both stem (Lin–, CD34+CD38–) and progenitor (Lin–, CD34+CD38+) cells (Figure 4, A–D). The MDS/AML HSPC samples showed a greater uptake when compared with control cells derived from healthy cord blood (Figure 4E). Moreover, when STAT3 expression was evaluated after 24 hours of exposure to AZD9150, we determined a significant reduction in expression in MDS/AML samples compared with healthy controls (Figure 4F). These data demonstrate rapid uptake and on-target effects by AZD9150 in primary stem and progenitor cells. AZD9150 incorporation into TP53-mutated MDS/AML stem cells leads to increased apoptosis in stem and progenitor populations in a dose-dependent manner in comparison with healthy controls (Supplemental Figure 5). Additionally, STAT3 inhibition with AZD9150 also led to decreased replating efficiency of primary patient AML samples in colony assays, further demonstrating efficacy against MDS/AML stem and progenitor fractions (Supplemental Figure 1).
Figure 4. AZD9150 is rapidly incorporated by primary MDS/AML stem and progenitor cells and leads to STAT3 inhibition.
MDS/AML–derived stem and progenitor cells were treated with AZD9150 (2.5 μM, 10 μM) and then assessed for uptake of the oligonucleotide after assessment by intracellular flow cytometry with antibody against the oligonucleotide backbone. (A–D) Both progenitors and stem cells incorporated AZD9150 by 24 hours. (E) The uptake was greater in MD/AML stem cells compared with cord blood controls. (F) STAT3 expression as measured by qPCR was significantly decreased in MDS/AML stem cells (n = 6) compared with cord blood (CB) stem cell controls (n = 6) after treatment with AZD9150. (Two-tailed t test for all, *P < 0.05.)
AZD9150 treatment leads to enhanced differentiation from primary MDS stem and progenitor cells.
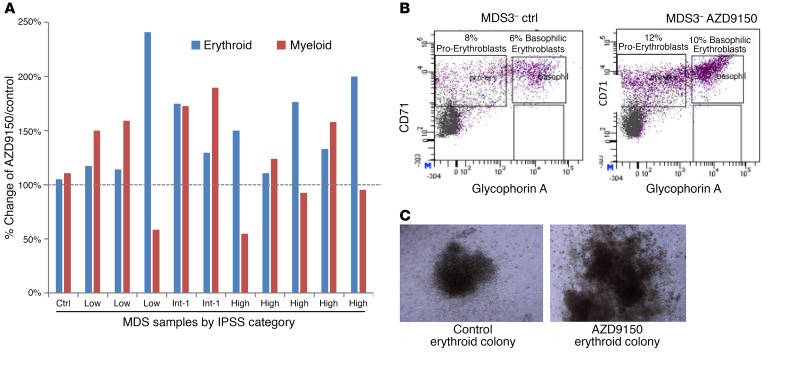
MDS and AML stem and progenitor cells are characterized by arrested as well as dysplastic differentiation (19, 20). We treated a number of primary MDS patient samples with AZD9150 and control and grew them in methylcellulose assays supplemented with cytokines. Cells were harvested after 14 days and assessed for erythroid and myeloid differentiation by flow cytometry. We observed an increase in erythroid as well as myeloid differentiation as measured by various glycophorin A and CD11b differentiation markers, respectively, in most of the drug-treated samples compared with control (Figure 5, A–C). Furthermore, examination of the colonies revealed larger and more differentiated colonies after treatment with AZD9150 (Figure 5, B and C). Treatment of healthy controls with AZD9150 did not lead to any significant decreases in erythroid and myeloid colonies nor in megakaryocytic colonies (Figure 5 and Supplemental Figure 4).
Figure 5. AZD9150 treatment leads to enhanced differentiation from primary MDS stem and progenitor cells.
AZD9150 treatment leads to enhanced differentiation from primary MDS stem and progenitor cells. (A) Clonogenic assays from primary MDS mononuclear cell samples (n = 10) were performed, and cells were harvested after 14 days and assessed for differentiation by flow cytometry. An increase in erythroid (glycophorin A) and myeloid (CD11b) differentiation was seen in samples compared with controls. (B) A representative flow plot shows increased erythroid differentiation with an increase in the proerythroblasts and basophilic erythroblasts after AZD9150 treatment (10 μM). (C) The drug-treated colonies were also larger in size at the same magnification. Original magnification, 10×.
AZD9150 leads to decreased leukemic engraftment in primary MDS/AML xenografts.
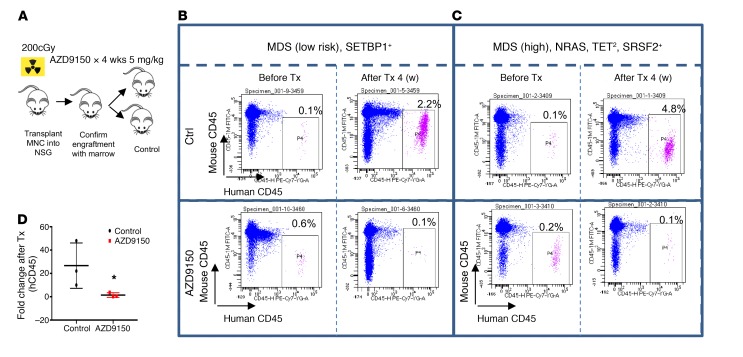
In vivo administration of ASOs with similar backbones can lead to significant uptake in spleen, liver, and tumor tissues (Supplemental Figure 2), and so we wanted to determine the efficacy of AZD9150 against primary MDS/AML xenografts. Peripheral blood– or bone marrow–derived mononuclear cells (MNCs) from MDS/AML patients were transplanted into irradiated NSG mice. After confirmation of engraftment by serial bone marrow samples, the cohort was split and treated with either drug at a dose of 50 mg/kg or control oligonucleotide at the same dose for 4 weeks (Figure 6A). AZD9150 treatment led to decreased MDS/AML burden in xenografted mice as compared with control (Figure 6B). This was seen in both low-risk MDS patients (Figure 6C) and high-risk MDS cases (Figure 6D). Since AZD9150 is a specific inhibitor of only human STAT3, these data demonstrate inhibition against human xenografted cells in vivo.
Figure 6. AZD9150 leads to decreased leukemic engraftment in primary MDS/AML xenografts.
(A) MDS patient-derived xenografts (n = 3) were prepared by transplantation of peripheral blood or BM mononuclear cells (MNCs) into irradiated NSG mice. After confirmation of engraftment by serial bone marrow samples, the cohort was split and treated with either drug at a dose of 50 mg/kg or control oligonucleotide at the same dose for 4 weeks. (B) A low-risk MDS patient analyzed after 4 weeks of treatment shows improved engraftment in the control-treated mice but a loss of graft in AZD9150-treated mice, as demonstrated by the human CD45 antibody. (C) A high-risk MDS patient with similarly improved graft in control compared with AZD9150-treated mice. *P < 0.05 by t test. Fold change of human CD45 in drug-treated mice was greatly reduced in comparison with control (n = 3).
AZD9150-treated leukemic cells show downregulation of MCL1 and other oncogenic genes.
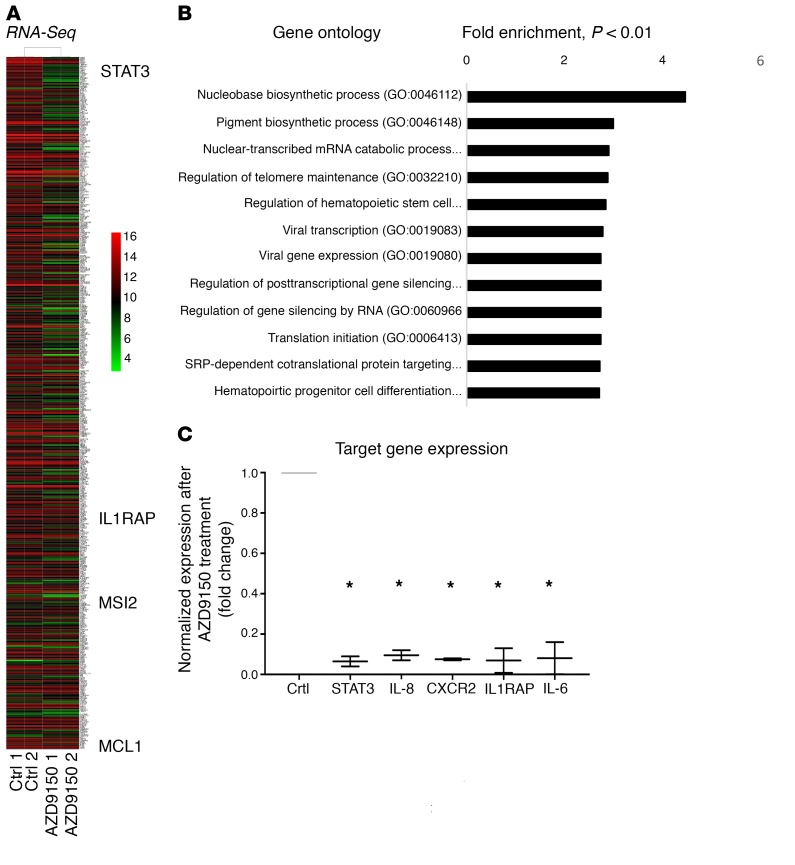
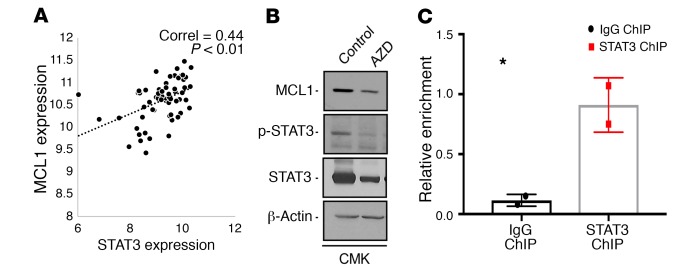
To determine the downstream genes affected by STAT3 knockdown by AZD9150, we treated CMK leukemia cells and performed RNA-Seq analysis after 24 hours. We observed differential expression of numerous genes after AZD9150 treatment that belonged to many important oncogenic and regulatory pathways (Figure 7, A and B, and Supplemental Table 3). Differentially downregulated genes included known leukemogenic cell genes such as IL-1 receptor accessory protein (IL1RAP) and Musashi 2 (MSI2) and antiapoptotic myeloid leukemia cell differentiation (MCL1) transcripts (refs. 16, 21–23; and Figure 7A). Validation by qPCR showed significant downregulation of STAT3 along with the known leukemia stem cell genes IL8, CXCR2, and IL1RAP after treatment with AZD9150 (Figure 7C). Since we observed significant induction of apoptosis after AZD9150 treatment, we next evaluated MCL1 as a downstream target of STAT3 in leukemic cells. Gene expression analysis in a large MDS CD34+ transcriptomic data set showed a strong correlation between MCL1 and STAT3 expression in 183 sorted MDS CD34+ samples (Figure 8A). Furthermore, we observed decreased levels of MCL1 and STAT3 protein levels after AZD9150 treatment (Figure 8B). Finally, chromatin immunoprecipitation using an antibody against STAT3 revealed enrichment of MCL1 promoter (Figure 8C), demonstrating MCL1 to be an important STAT3-regulated gene in leukemia cells.
Figure 7. STAT3 downregulation by AZD9150 leads to downregulation of oncogenic and stem cell–associated genes.
(A) RNA-Seq analysis shows that treatment of CMK leukemia cells with AZD9150 (10 μM) and control (10 μM) for 24 hours leads to differential expression of various transcripts, including the known leukemia stem cell drivers IL1RAP, MSI2, and MCL1. (B) Important gene pathways are regulated by STAT3 in CMK leukemia cells as analyzed by gene ontology analysis. (C) qPCR validation demonstrates downregulation of STAT3, IL-8, CXCR2, and IL1RAP by AZD9150 treatment. *P < 0.05.
Figure 8. STAT3 downregulation by AZD9150 leads to downregulation of MCL1.
(A) Positive correlation between MCL1 and STAT3 expression is seen in 183 MDS CD34+ samples. MCL1 protein downregulation is seen after treatment of leukemia cells with AZD9150. (B) Western blot showing downregulation of MCL1, phospho-STAT3, and total STAT3 in AZD9150-treated CMK cells compared with the control. (C) STAT3 ChIP for MCL1 promoter region in CMK cells shows enrichment when compared with IgG control (P = 0.03, n = 2). *P < 0.05 by two-tailed t test.
Discussion
STAT3 has been an important oncogenic target in hematologic malignancies, but translating the utility of STAT3 inhibition from the bench to the bedside has proved to be challenging (8, 24, 25). The development of ASOs has also been marred in the past by poor target engagement, inadequate biologic activity, and significant off-target toxicities (26). However, progress has been made in recent years, and targeting of transcription factors and other gene products with ASOs is becoming an important clinical tool for the treatment of multiple diseases, with several drugs having already made their way into the clinic (11). AZD9150 is a generation 2.5 specific inhibitor of the human STAT3 and overcomes the problems faced by the earlier generations of oligonulceotides (9).
We have shown that a high proportion of immature HSPCs harbor karyotypic abnormalities, and demonstrate that STAT3 is significantly upregulated in HSPCs derived from MDS and AML patients. Interestingly, we found higher intracellular levels of AZD9150 in malignant stem cells, potentially due to higher amounts of STAT3 mRNA inside these cells. We also show that high STAT3 expression correlates strongly with an adverse prognosis and is associated with worse overall survival, reduced mean hemoglobin levels, an increased transfusion burden, and an increased percentage of blasts in MDS. These effects are potentially mediated by high STAT3 levels that lead to dysregulated cellular pathways that are crucial for the processes of proliferation and survival. The gene expression profiling of MDS CD34+ cells we performed was reflective of this hypothesis. Based on our data, targeting and inhibiting STAT3 in MDS/AML stem cells can potentially inhibit disease-initiating cells and induce durable remissions in these difficult-to-treat patients.
In our subsequent experiments, we demonstrate that AZD9150 is able to specifically inhibit STAT3 and induce apoptosis in multiple leukemic cell lines, including the MDS-L cell line (27). Primary MDS/AML–derived HSPCs were able to incorporate the ASOs readily. Interestingly, the diseased stem cell populations had a greater uptake of the ASOs compared with the healthy stem cells and also demonstrated a greater inhibition of STAT3. This finding is of translational relevance and will aid clinical development of AZD9150 in MDS and AML. Our experiments with primary patient samples demonstrate that AZD9150 is able to relieve differentiation blocks in MDS/AML stem cells and improve erythroid and myeloid colony growth. We also observed induction of apoptosis in leukemia cell lines. Differentiation and apoptotic effects could be related to heterogeneity of the samples examined. Cytopenias in patients with MDS lead to significant morbidity and mortality due to the need for high transfusion support and the increased risk of serious infections (28, 29). If an improvement in erythroid and myeloid differentiation translates into an increased hemoglobin and neutrophil count, this may be of great clinical benefit for the MDS patient population.
Transcriptomic analysis demonstrated that STAT3 expression can differentially regulate several important leukemic drivers that include IL1RAP, MSI2, CXCR2, IL8, and MCL1. We observed a strong correlation between MCL1 and STAT3 expression levels with decreased expression of MCL1 noted after treatment with AZD9150. MCL1 is a multidomain antiapoptotic protein belonging to the BCL2 family, which regulates the intrinsic apoptosis pathway important to regulating the processes of cell survival and death. It also plays an important role in mediating chemotherapy resistance (30). MCL1 appears to be critical for the survival of human AML cells, as it has been reported that the removal of MCL1 without the blockade of BCXL, BCL2, or BCLW ameliorated AML in a murine model and inhibited transformed AML cells in culture (31). Selective small-molecule inhibitors of MCL1 are in early development. However, several such compounds have been reported to have significant off-target activity or lack the reported cellular effects (32, 33). Downregulation of MCL1 with AZD9150 can lead to induction of apoptosis and provides a preclinical rationale for testing AZD9150 as a single agent or in combination with other agents in the treatment of MDS and AML.
Methods
Supplemental Methods are available online with this article; https://doi.org/10.1172/JCI120156DS1
Patient samples, cell lines, and reagents.
Specimens were obtained from patients diagnosed with MDS and AML after IRB approval by the Albert Einstein College of Medicine (Supplemental Table 1). The AML cell lines KG1a, KT-1, CMK, MOLM13, MOLM14, NB4, MV411, MDS-L, and U937 were obtained from ATCC and were grown in RPMI supplemented with 10% FBS and 1% penicillin/streptomycin. AZD9150 (antisense STAT3 oligonucleotide) and a nontargeting antisense oligonucleotide (ntASO) that has the same length, backbone, and base modifications as AZD9150 were provided by AstraZeneca and Ionis Pharmaceuticals Inc. For in vitro studies, AZD9150 and ntASO were dissolved in PBSS as a 4.6 mmol/l stock solution, respectively, and frozen in aliquots at –20°C. For in vivo experiments, AZD9150 and ntASO were formulated in PBS, stored at 4°C, and freshly made every week.
Cell viability assays.
Cell lines and primary samples were incubated at concentrations of 1–10 μM of AZD9150. AZD9150 and control ntASO were introduced into the cell lines by electroporation with Amaxa Cell Line Nucleofector (Lonza Inc.). Primary samples were treated by free uptake in media. Cells and drug were incubated for 24, 48, and 72 hours. Viability was assessed by addition of CellTiter-Blue (Promega) and measured via Fluostar Omega Microplate reader (BMG Labtech).
Cell lysis and immunoblotting.
Cells were lysed in phosphorylation lysis buffer as previously described (34). Immunoblotting was performed as previously described (34).
Multiparameter high-speed FACS of stem and progenitor cells.
Processing and sorting of hematopoietic stem and progenitor cells was performed as previously described (16). Briefly, mononuclear cells (MNCs) were isolated from bone marrow aspirates and peripheral blood samples by density gradient centrifugation and then subjected to immunomagnetic enrichment of CD34+ cells (Miltenyi Biotec). CD34+ cells were stained with PE-Cy5 (Tri-Color)–conjugated monoclonal antibodies against lineage antigens (CD2 [RPA-2.10], CD3 [UCHT1], CD4 [S3.5], CD7 [6B7], CD8 [3B5], CD10 [CB-CALLA], CD11b [VIM12], CD14 [TueK4], CD19 [HIB19], CD20 [2H7], CD56 [MEM-188], and glycophorin A [CLB-ery-1(AME-1)]), as well as fluorochrome-conjugated antibodies against CD34 (581/CD34, class III epitope), CD38 (HIT2), CD90 (5E10), CD45RA (MEM-56), and CD123 (6H6). Cells were sorted with a 5-laser FACSAria II Special Order System flow cytometer (Becton Dickinson). Based on established surface marker characterization, we distinguished and sorted LT-HSCs (Lin–, CD34+, CD38–, CD90+), ST-HSCs (Lin–, CD34+, CD38–, CD90–), and GMPs (Lin–, CD34+, CD38+, CD123+, CD45RA+) (35). Flow cytometry data were analyzed with BD FACSDiva (Becton Dickinson) and FlowJo (Tree Star) software. After sorting, RNA was extracted with the RNeasy Micro Kit (Qiagen).
RNA amplification and qPCR.
To measure STAT3 and STAT3 target gene expression upon ASO treatment, qPCR was used. Briefly, total RNA was isolated from cells after treatment as indicated using the RNeasy Micro Kit (Qiagen) according to the manufacturer’s recommendation. RNA quantity and quality were assessed using a Nanodrop 1000 (Thermo Fisher Scientific). One microgram of total RNA was reverse-transcribed using the iScript cDNA Synthesis Kit (Bio-Rad). qPCR reactions were performed with the SYBR Green PCR Master Mix (Life Technologies) using validated gene-specific primers (Supplemental Table 4). Transcript levels of genes of interest were normalized to a housekeeping gene (GAPDH) using the Pfaffl method (36).
Clonogenic assays.
For clonogenic assays, primary patient samples and healthy controls were plated in methylcellulose (Stem Cell Technologies H4435) in 35-mm dishes and incubated with the AZD9150 and control at 10 μM. Colonies were counted after 14–17 days in culture. FACS analysis for differentiation was done on colonies.
Apoptosis analysis.
Apoptosis analysis was performed using annexin V and propidium iodide (Thermo Fischer Scientific). In brief, 1 × 10⁶ AML cells were incubated at varying doses of AZD9150 and ntASO. After 48 hours, the cells were harvested and washed with PBS and binding buffer. They were then incubated with 5 µl of annexin V for 15 minutes protected from light. Binding buffer was then added after another wash followed by 5 µl of propidium iodide. The cell mixture was then incubated on ice at 2°C–8°C and analyzed by flow cytometry using a FACSAria II Special Order System (BD Biosciences).
Preparation of primary hematopoietic cells.
Cord blood and patient-derived peripheral blood specimens were collected from patients with MDS and AML (see Supplemental Table 1 for patient details). MNCs were isolated by density gradient centrifugation using Ficoll-Hypaque (GE Healthcare) as published before (7). CD34+ HSPCs were isolated by immunomagnetic sorting according to the manufacturer’s recommendation (MicroBead Kit human, Miltenyi Biotec) and cultured in serum-free growth medium (StemSpan, StemCell Technologies) supplemented with 10 ng/ml recombinant human IL-3 (PeproTech), 25 ng/ml recombinant human IL-6, 50 ng/ml recombinant human stem cell factor (Gemini), 40 μg/ml human low-density lipoprotein (Sigma-Aldrich), and Primocin (InvivoGen) at 37°C and 5% CO2. Cells were treated with 10 μM of a NTC oligonucleotide or ASO at the indicated concentrations for 24 and 48 hours.
Flow cytometric analysis of primary hematopoietic cells.
We used cell surface marker detection to identify various hematopoietic cell populations as done before (16, 37). Upon culture, primary cells were collected, washed once with 1× PBS (GE Healthcare Life Sciences), and subsequently stained with PE-conjugated monoclonal antibody against human CD34 (581, 1:50; BioLegend), PE-Cy7–conjugated anti–human CD38 (HIT2, 1:50; eBioscience), PE-conjugated anti–human CD33 (WM-53, 1:50; eBioscience), PE-Cy5–conjugated anti–human CD10 (eBioCB-CALLA, 1:50; eBioscience), and Pacific Orange–conjugated anti–human CD4 (MCD0430, 1:50; Life Technologies) for 20 minutes at 4°C. Data were acquired using an ARIA II Special Order System device (BD Biosciences). Data analysis was performed using FlowJo version 10 (Tree Star).
Quantification of intracellular ASO uptake.
Validation of cellular uptake of the ASO was performed using an antibody raised against the ASO backbone and intracellular FACS analysis. Briefly, cultured primary cells were fixed with 1× Lyse/Fix Buffer (BD Biosciences) prewarmed to 37°C. Cells were then permeabilized with Perm Buffer III (BD Biosciences) for 30 minutes on ice. Cells were then incubated with 4% mouse serum (Thermo Fisher Scientific) to minimize unspecific binding of the antibody, after which 0.1 μg of an unconjugated anti-STAT3-ASO polyclonal antibody (provided by Ionis Pharmaceuticals Inc.) in 100 μl PBS 1× (per 1 × 10⁶ cells) was added. Cells were incubated for 20 minutes at 4°C and washed afterward once with 1× PBS. Cells were then stained with an APC-labeled donkey anti-rabbit secondary antibody (Jackson ImmunoResearch) along with a FITC-conjugated anti–human p-STAT3 (serine 727) (49/p-Stat3, 1:50; BD Biosciences) and a PE-conjugated anti–human p-STAT3 (tyrosine 705) (4/p-Stat3, 1:50; BD Biosciences). Data acquisition was performed using an LSR II device (Becton Dickinson); data analysis was accomplished using BD FACSDiva (Becton Dickinson) or FlowJo version 10 (Tree Star) software package.
Patient database and survival data and correlation with STAT3 gene expression.
Gene expression data from 183 MDS CD34+ samples and 17 controls were obtained from GEO (GSE19429) (38). Gene expression data on sorted LT-HSCs, ST-HSCs, and GMPs from MDS/AML patients and healthy controls were deposited in the GEO database (GSE35008 and GSE35010). Gene set enrichment analysis (GSEA) was performed by comparison of the “STAT3 high” signature with 2 published preleukemic HSC signatures (GSE76009, ref. 15, and GSEA12417, ref. 16).
Luciferase reporter assay for STAT3 and STAT5 binding.
To measure STAT3- and STAT5-dependent luciferase activity, the STAT3-luc and STAT5-responsive NCAM2-luciferase constructs were transfected into CMK cells as previously described (39).
Leukemia xenografts.
NOD-SCID IL-2Rγ KO mice were injected with 106 CMK cells that had been transfected with AZD9150 and ntASO. Cells were injected into the mice approximately 2–4 hours after transfection. Viability was assessed before injection, and the same number of viable cells (2.5 million) were injected from both groups. Overall survival was measured and analyzed by Kaplan-Meier plotting and log-rank test.
Patient-derived xenografts.
NSG mice were irradiated (2 Gy) 24 hours before injection. Peripheral blood MNCs from primary MDS and AML patient samples were isolated by Ficoll separation. Peripheral blood MNCs (2 × 10⁶ to 5 × 10⁶) were administered via tail vein injection. Three weeks later, the mice underwent bone marrow aspiration and the aspirate was analyzed by flow cytometry for the rate of engraftment. Mice were considered to be engrafted if they showed 0.1% or higher human-derived CD45+ cells. The engrafted mice were treated with s.c. injections of AZD9150 and ntASO at a dose of 50 mg/kg for 5 days per week for 4 weeks. After this, bone marrow aspiration and flow cytometry analysis for the above-mentioned markers were repeated.
Statistics.
R software version 3.4.1 was used for statistical analysis. The data presented in figures with box or bar plots are represented as mean ± SEM unless otherwise specified in the figure legend. The significance of the differences in Kaplan-Meier survival curves was computed by log-rank test. The P values for the significance of correlation were generated from a Fisher Z transformation.
Study approval.
The studies reported in this article were conducted under a tissue collection protocol (protocol CCI-2005-536) approved by the Albert Einstein College of Medicine Institutional Review Board (Bronx, New York, USA). The animal studies, including patient-derived xenografts, were performed under an experimental protocol (protocol 20150703) approved by the Institutional Animal Care and Use Committee. There were no active human subjects enrolled into the study, and hence there was no requirement to obtain informed consent.
Author contributions
AS and AV designed research. AS, MT, GC, SGM, NR, LB, SB, RL, GR, LFW, SC, TDB, OG, YD, MB, JF, and VJT performed research. AP and JB contributed data. AW and PKEB contributed reagents. TZ, YK, ARM, MY, PM, and RW contributed drugs and protocols. KP and BW analyzed data; BHY and DAF gave critique; and AS, US, BW, and AV wrote the paper and analyzed the data.
Supplementary Material
Acknowledgments
AS is supported by the Paul Calabresi NIH K12 award. BW is supported by NIH grants K01DK105134 by P30CA01330 (pilot grant, to BW). MT was a recipient of a Scholarship from the Einstein Training Program in Stem Cell Research from the Empire State Stem Cell Fund through New York State Department of Health Contract C30292GG. AKV is supported by the Leukemia Lymphoma Society, NIH R01 HL13948701A1, NIH R01 DK103961, and an Evans Foundation Grant. AP and JB are supported by Bloodwise (UK).
Version 1. 09/25/2018
In-Press Preview
Version 2. 11/05/2018
Electronic publication
Version 3. 12/03/2018
Print issue publication
Footnotes
Conflict of interest: AV has received research funding from GSK, Incyte, Medpacto, and Eli Lilly and is a scientific advisor for Stelexis, Novartis, Acceleron, and Celgene and holds equity stake in Stelexis.
License: Copyright 2018, American Society for Clinical Investigation.
Reference information: J Clin Invest. 2018;128(12):5479–5488https://doi.org/10.1172/JCI120156.
Contributor Information
Aditi Shastri, Email: ashastri@montefiore.org.
Gaurav Choudhary, Email: gaurav.choudhary@einstein.yu.edu.
Margarida Teixeira, Email: margaridaferreirateixeira@gmail.com.
Shanisha Gordon-Mitchell, Email: shanisha.gordon@einstein.yu.edu.
Nandini Ramachandra, Email: Keshkar2002@yahoo.com.
Lumie Bernard, Email: lumie.benard@einstein.yu.edu.
Sanchari Bhattacharyya, Email: sanchari.bhattacharyya@einstein.yu.edu.
Robert Lopez, Email: robelope@montefiore.org.
Kith Pradhan, Email: kith.pradhan@einstein.yu.edu.
Orsolya Giricz, Email: orsolya.giricz@einstein.yu.edu.
Goutham Ravipati, Email: gravipati95@gmail.com.
Li-Fan Wong, Email: lifanwongtaiwan@gmail.com.
Sally Cole, Email: sally.cole@einstein.yu.edu.
Tushar D. Bhagat, Email: tushar.bhagat@phd.einstein.yu.edu.
Jonathan Feld, Email: jfeld@bidmc.harvard.edu.
Yosman Dhar, Email: ndhar@montefiore.org.
Matthias Bartenstein, Email: Matthias.bartenstein@phd.einstein.yu.edu.
Victor J. Thiruthuvanathan, Email: victor.thiruthuvanathan@einstein.yu.edu.
Amittha Wickrema, Email: awickrem@medicine.bsd.uchicago.edu.
B. Hilda Ye, Email: hilda.ye@einstein.yu.edu.
David A. Frank, Email: david_frank@dfci.harvard.edu.
Andrea Pellagatti, Email: andreapellagatti@yahoo.co.uk.
Jacqueline Boultwood, Email: jacqueline.boultwood@ndcls.ox.ac.uk.
Tianyuan Zhou, Email: TZhou37@its.jnj.com.
Youngsoo Kim, Email: YKim@isisph.com.
A. Robert MacLeod, Email: RMacLeod@isisph.com.
Minwei Ye, Email: Minwei.Ye@astrazeneca.com.
Patricia McCoon, Email: patricia.mccoon@astrazeneca.com.
Richard Woessner, Email: rwoessner@blueprintmedicines.com.
Ulrich Steidl, Email: ulrich.steidl@einstein.yu.edu.
Britta Will, Email: britta.will@einstein.yu.edu.
References
- 1.Jan M, et al. Clonal evolution of preleukemic hematopoietic stem cells precedes human acute myeloid leukemia. Sci Transl Med. 2012;4(149):149ra118. doi: 10.1126/scitranslmed.3004315. [DOI] [PMC free article] [PubMed] [Google Scholar]
- 2.Pang WW, et al. Hematopoietic stem cell and progenitor cell mechanisms in myelodysplastic syndromes. Proc Natl Acad Sci U S A. 2013;110(8):3011–3016. doi: 10.1073/pnas.1222861110. [DOI] [PMC free article] [PubMed] [Google Scholar]
- 3.Shastri A, Will B, Steidl U, Verma A. Stem and progenitor cell alterations in myelodysplastic syndromes. Blood. 2017;129(12):1586–1594. doi: 10.1182/blood-2016-10-696062. [DOI] [PMC free article] [PubMed] [Google Scholar]
- 4.Shlush LI, et al. Identification of pre-leukaemic haematopoietic stem cells in acute leukaemia. Nature. 2014;506(7488):328–333. doi: 10.1038/nature13038. [DOI] [PMC free article] [PubMed] [Google Scholar]
- 5.Woll PS, et al. Myelodysplastic syndromes are propagated by rare and distinct human cancer stem cells in vivo. Cancer Cell. 2014;25(6):794–808. doi: 10.1016/j.ccr.2014.03.036. [DOI] [PubMed] [Google Scholar]
- 6.Bonnet D, Dick JE. Human acute myeloid leukemia is organized as a hierarchy that originates from a primitive hematopoietic cell. Nat Med. 1997;3(7):730–737. doi: 10.1038/nm0797-730. [DOI] [PubMed] [Google Scholar]
- 7.Will B, et al. Stem and progenitor cells in myelodysplastic syndromes show aberrant stage-specific expansion and harbor genetic and epigenetic alterations. Blood. 2012;120(10):2076–2086. doi: 10.1182/blood-2011-12-399683. [DOI] [PMC free article] [PubMed] [Google Scholar]
- 8.Kanna R, Choudhary G, Ramachandra N, Steidl U, Verma A, Shastri A. STAT3 inhibition as a therapeutic strategy for leukemia. Leuk Lymphoma. 2018;59(9):2068–2074. doi: 10.1080/10428194.2017.1397668. [DOI] [PubMed] [Google Scholar]
- 9.Hong D, et al. AZD9150, a next-generation antisense oligonucleotide inhibitor of STAT3 with early evidence of clinical activity in lymphoma and lung cancer. Sci Transl Med. 2015;7(314):314ra185. doi: 10.1126/scitranslmed.aac5272. [DOI] [PMC free article] [PubMed] [Google Scholar]
- 10.Finkel RS, et al. Nusinersen versus sham control in infantile-onset spinal muscular atrophy. N Engl J Med. 2017;377(18):1723–1732. doi: 10.1056/NEJMoa1702752. [DOI] [PubMed] [Google Scholar]
- 11.Stein CA, Castanotto D. FDA-approved oligonucleotide therapies in 2017. Mol Ther. 2017;25(5):1069–1075. doi: 10.1016/j.ymthe.2017.03.023. [DOI] [PMC free article] [PubMed] [Google Scholar]
- 12.Prakash TP, et al. Antisense oligonucleotides containing conformationally constrained 2′,4′-(N-methoxy)aminomethylene and 2′,4′-aminooxymethylene and 2′-O,4′-C-aminomethylene bridged nucleoside analogues show improved potency in animal models. J Med Chem. 2010;53(4):1636–1650. doi: 10.1021/jm9013295. [DOI] [PubMed] [Google Scholar]
- 13.Seth PP, et al. Short antisense oligonucleotides with novel 2′-4′ conformationaly restricted nucleoside analogues show improved potency without increased toxicity in animals. J Med Chem. 2009;52(1):10–13. doi: 10.1021/jm801294h. [DOI] [PubMed] [Google Scholar]
- 14.Odate S, Veschi V, Yan S, Lam N, Woessner R, Thiele CJ. Inhibition of STAT3 with the generation 2.5 antisense oligonucleotide, AZD9150, decreases neuroblastoma tumorigenicity and increases chemosensitivity. Clin Cancer Res. 2017;23(7):1771–1784. doi: 10.1158/1078-0432.CCR-16-1317. [DOI] [PMC free article] [PubMed] [Google Scholar]
- 15.Ng SW, et al. A 17-gene stemness score for rapid determination of risk in acute leukaemia. Nature. 2016;540(7633):433–437. doi: 10.1038/nature20598. [DOI] [PubMed] [Google Scholar]
- 16.Barreyro L, et al. Overexpression of IL-1 receptor accessory protein in stem and progenitor cells and outcome correlation in AML and MDS. Blood. 2012;120(6):1290–1298. doi: 10.1182/blood-2012-01-404699. [DOI] [PMC free article] [PubMed] [Google Scholar]
- 17.Gerstung M, et al. Combining gene mutation with gene expression data improves outcome prediction in myelodysplastic syndromes. Nat Commun. 2015;6:5901. doi: 10.1038/ncomms6901. [DOI] [PMC free article] [PubMed] [Google Scholar]
- 18.Ross SJ, et al. Targeting KRAS-dependent tumors with AZD4785, a high-affinity therapeutic antisense oligonucleotide inhibitor of KRAS. Sci Transl Med. 2017;9(394):eaal5253. doi: 10.1126/scitranslmed.aal5253. [DOI] [PubMed] [Google Scholar]
- 19.Ebert BL, et al. An erythroid differentiation signature predicts response to lenalidomide in myelodysplastic syndrome. PLoS Med. 2008;5(2):e35. doi: 10.1371/journal.pmed.0050035. [DOI] [PMC free article] [PubMed] [Google Scholar]
- 20.Sperling AS, Gibson CJ, Ebert BL. The genetics of myelodysplastic syndrome: from clonal haematopoiesis to secondary leukaemia. Nat Rev Cancer. 2017;17(1):5–19. doi: 10.1038/nrc.2016.112. [DOI] [PMC free article] [PubMed] [Google Scholar]
- 21.Epling-Burnette PK, et al. Inhibition of STAT3 signaling leads to apoptosis of leukemic large granular lymphocytes and decreased Mcl-1 expression. J Clin Invest. 2001;107(3):351–362. doi: 10.1172/JCI9940. [DOI] [PMC free article] [PubMed] [Google Scholar]
- 22.Yang C, et al. Musashi-2 promotes migration and invasion in bladder cancer via activation of the JAK2/STAT3 pathway. Lab Invest. 2016;96(9):950–958. doi: 10.1038/labinvest.2016.71. [DOI] [PubMed] [Google Scholar]
- 23.Kharas MG, et al. Musashi-2 regulates normal hematopoiesis and promotes aggressive myeloid leukemia. Nat Med. 2010;16(8):903–908. doi: 10.1038/nm.2187. [DOI] [PMC free article] [PubMed] [Google Scholar]
- 24.Jerez A, et al. STAT3 mutations unify the pathogenesis of chronic lymphoproliferative disorders of NK cells and T-cell large granular lymphocyte leukemia. Blood. 2012;120(15):3048–3057. doi: 10.1182/blood-2012-06-435297. [DOI] [PMC free article] [PubMed] [Google Scholar]
- 25.Scuto A, et al. STAT3 inhibition is a therapeutic strategy for ABC-like diffuse large B-cell lymphoma. Cancer Res. 2011;71(9):3182–3188. doi: 10.1158/0008-5472.CAN-10-2380. [DOI] [PMC free article] [PubMed] [Google Scholar]
- 26.Rinaldi C, Wood MJA. Antisense oligonucleotides: the next frontier for treatment of neurological disorders. Nat Rev Neurol. 2018;14(1):9–21. doi: 10.1038/nrneurol.2017.148. [DOI] [PubMed] [Google Scholar]
- 27.Tohyama K, Tsutani H, Ueda T, Nakamura T, Yoshida Y. Establishment and characterization of a novel myeloid cell line from the bone marrow of a patient with the myelodysplastic syndrome. Br J Haematol. 1994;87(2):235–242. doi: 10.1111/j.1365-2141.1994.tb04904.x. [DOI] [PubMed] [Google Scholar]
- 28.Giagounidis A. Current treatment algorithm for the management of lower-risk MDS. Hematology Am Soc Hematol Educ Program. 2017;2017(1):453–459. doi: 10.1182/asheducation-2017.1.453. [DOI] [PMC free article] [PubMed] [Google Scholar]
- 29.Santini V. Treatment of low-risk myelodysplastic syndromes. Hematology Am Soc Hematol Educ Program. 2016;2016(1):462–469. doi: 10.1182/asheducation-2016.1.462. [DOI] [PMC free article] [PubMed] [Google Scholar]
- 30.Ashkenazi A, Fairbrother WJ, Leverson JD, Souers AJ. From basic apoptosis discoveries to advanced selective BCL-2 family inhibitors. Nat Rev Drug Discov. 2017;16(4):273–284. doi: 10.1038/nrd.2016.253. [DOI] [PubMed] [Google Scholar]
- 31.Glaser SP, et al. Anti-apoptotic Mcl-1 is essential for the development and sustained growth of acute myeloid leukemia. Genes Dev. 2012;26(2):120–125. doi: 10.1101/gad.182980.111. [DOI] [PMC free article] [PubMed] [Google Scholar]
- 32.Belmar J, Fesik SW. Small molecule Mcl-1 inhibitors for the treatment of cancer. Pharmacol Ther. 2015;145:76–84. doi: 10.1016/j.pharmthera.2014.08.003. [DOI] [PMC free article] [PubMed] [Google Scholar]
- 33.Varadarajan S, et al. Maritoclax and dinaciclib inhibit MCL-1 activity and induce apoptosis in both a MCL-1-dependent and -independent manner. Oncotarget. 2015;6(14):12668–12681. doi: 10.18632/oncotarget.3706. [DOI] [PMC free article] [PubMed] [Google Scholar]
- 34.Verma A, et al. Activation of the p38 mitogen-activated protein kinase mediates the suppressive effects of type I interferons and transforming growth factor-β on normal hematopoiesis. J Biol Chem. 2002;277(10):7726–7735. doi: 10.1074/jbc.M106640200. [DOI] [PubMed] [Google Scholar]
- 35.Steidl U, et al. Essential role of Jun family transcription factors in PU.1 knockdown-induced leukemic stem cells. Nat Genet. 2006;38(11):1269–1277. doi: 10.1038/ng1898. [DOI] [PubMed] [Google Scholar]
- 36.Pfaffl MW. A new mathematical model for relative quantification in real-time RT-PCR. Nucleic Acids Res. 2001;29(9):e45. doi: 10.1093/nar/29.9.e45. [DOI] [PMC free article] [PubMed] [Google Scholar]
- 37.Schinke C, et al. IL8-CXCR2 pathway inhibition as a therapeutic strategy against MDS and AML stem cells. Blood. 2015;125(20):3144–3152. doi: 10.1182/blood-2015-01-621631. [DOI] [PMC free article] [PubMed] [Google Scholar]
- 38.Pellagatti A, et al. Deregulated gene expression pathways in myelodysplastic syndrome hematopoietic stem cells. Leukemia. 2010;24(4):756–764. doi: 10.1038/leu.2010.31. [DOI] [PubMed] [Google Scholar]
- 39.Takakura A, et al. Pyrimethamine inhibits adult polycystic kidney disease by modulating STAT signaling pathways. Hum Mol Genet. 2011;20(21):4143–4154. doi: 10.1093/hmg/ddr338. [DOI] [PMC free article] [PubMed] [Google Scholar]
Associated Data
This section collects any data citations, data availability statements, or supplementary materials included in this article.


