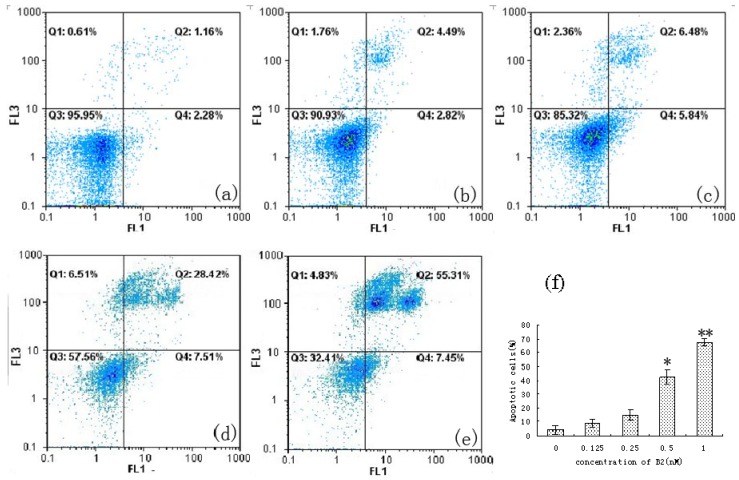
Figure 5.
Apoptotic population of SMMC-7721 cells analysis by flow cytometric using annexin V-FITC/PI staining. Q1, necrotic cells (annexin V−/PI+); Q2, late apoptotic cells (annexin V+/PI+); Q3, viable cells (annexin V−/PI−); Q4, early apoptotic cells (annexin V+/PI−). (a) 0 nM; (b) 0.125 nM; (c) 0.25 nM; (d) 0.5 nM; (e) 1 nM B2 for 48 h; (f), the percentage of annexin V positive population on every concentration of B2. ** p < 0.01, * p < 0.05, p value compared with the control group (0 nM).

