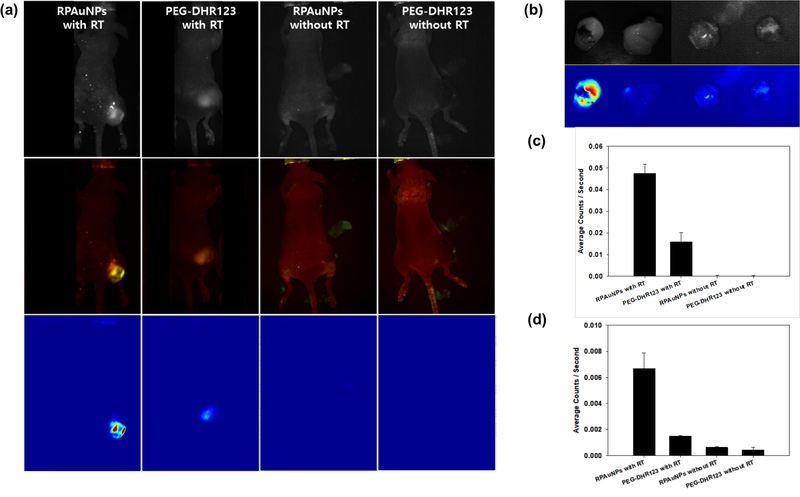
Figure 6.
ROS generation and detection in vivo using RPAuNPs. (a, top row) Raw in vivo fluorescence images acquired with the tunable emission filter set to 530 nm, for mice injected wither either RPAuNPs or PEG-DHR123, and either exposed to 6 Gy RT or no RT. (a, middle row) Two-component images showing DHR123 fluorescence (green) and skin autofluorescence (red), obtained by spectral unmixing. (a, bottom row) DHR123 fluorescence, obtained by spectral unmixing. (b) Same tumors, imaged ex vivo, showing reflectance image (top) and unmixed fluorescence image for the DHR123 component (bottom). (c) Fluorescence counts obtained from unmixed DHR123 in vivo images. (d) Same as previous, for ex vivo images.

