Abstract
Detection of molecular biomarkers with high specificity and sensitivity from biological samples requires both sophisticated sample preparation and subsequent analysis. These tasks are often carried out on separate platforms which increases required sample volumes and the risk of errors, sample loss, and contamination. Here, we present an optofluidic platform which combines an optical detection section with single nucleic acid strand sensitivity, and a sample processing unit capable of on-chip, specific extraction and labeling of nucleic acid and protein targets in complex biological matrices. First, on-chip labeling and detection of individual lambda DNA molecule down to concentrations of 8fM is demonstrated. Subsequently, we demonstrate the simultaneous capture, fluorescence tagging and detection of both Zika specific nucleic acid and NS-1 protein targets in both buffer and human serum. We show that the dual DNA and protein assay allows for successful differentiation and diagnosis of Zika against cross-reacting species like dengue.
Keywords: Biophotonics, Optofluidics, Zika Virus, Infectious Diseases, Integrated Optics
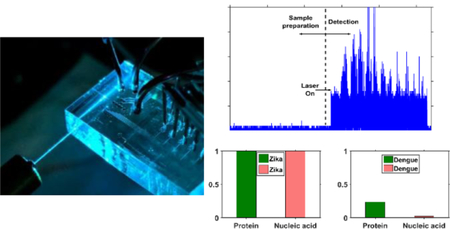
Graphical Abstract:
Summary
This work presents an optofluidic platform with integrated optical waveguides combining complex sample preparation capabilities with the ability to detect individual DNA molecules on one single platform.
1. Introduction
There is a pressing demand for tools that simultaneously analyze multiple biomarker types, such as nucleic acids, proteins, and metabolites. This requirement is partially driven by the emergence of precision medicine, single cell analysis, and the need to analyze a variety of genomic and proteomic biomarkers with high specificity and sensitivity – possibly at ultra-low concentrations for early disease detection1–3. Even though there exist a need for multiplexed detection of nucleic acid targets of different diseases4, simultaneous detection of multiple biomarker types (nucleic acids, proteins etc.) remains relevant to real world diagnostic situations like cancer companion diagnostics5 Another prime example is diagnosis of Zika virus (ZIKV) infection, where viremia is generally found in low concentrations, and protein biomarkers exhibit immunological cross reactivity with other flaviviruses like Dengue. This makes results from enzyme linked immunosorbent assays (ELISA) difficult to interpret, since the tests can yield incorrect false positives, and therefore require additional tests to confirm the presence of Zika virus6–8. ZIKV RNAs which have high specificity9, on the other hand, are detectable early on (first 1–2 weeks) but require concurrent serological tests for diagnosis of acute infection6. Consequently, a multi-target analysis is required for improved reliability and confidence in such diagnostic tests
Microfluidic devices have emerged as one of the most promising platforms for such biomedical diagnostic applications by allowing precise handling of low fluidic volumes, and thereby reducing need for complex off-chip sample preparation by trained users. Several microfluidic designs have been developed for handling biological samples, which can efficiently carry out preparation steps such as mixing chemicals10, filtering11, sorting12 thermal annealing13 and trapping14. More emphasis is being given to development of universal platforms which can perform all these sample processing steps15,16 together. In this aspect, pneumatically actuated micro valve automata17,18 have proved to be an important tool, not only because of their ease of fabrication and wide-ranging fluid handling capabilities but also because they can be programmed to enable flexible and complex operation. Such automated sample processing systems have already been demonstrated for several applications like immunoassay preparation19, amino acid labeling, chemical analysis20 and synthetic biology research21.
Another major thrust in biomedical research has been towards development of chip scale biosensors22 with the majority of them probing samples through electrical or optical means23,24. Optical biosensors have become dominant in this sector because they allow for rapid, sensitive and multiplexed detection, while being immune to electrical noise25. Development of simple and established fluorescence labeling techniques, along with microfluidic systems which enable delivery of extremely low volume samples, have made these sensors even more attractive26. Successful development of several silicon and PDMS based optical waveguides27–30 with integrated microfluidic channels has led to the emergence of a new set of optofluidic sensor devices where femtoliter excitation volumes have brought the detection limits down to single nucleic acids31. However, these systems lack any sample preparation capabilities and require fully preprocessed samples for analysis. On the other hand, optofluidic platforms with more complicated sample processing capabilities have been limited to bulk fluorescence microscopy imaging techniques32, resulting in relatively high detection limits. Although single particle detection capabilities have been demonstrated via hybrid integration of microfluidic sample processing units with silicon based optofluidic biosensors4,31,33, integration of two separate chips made from materials incompatible with each other makes device handling cumbersome, calls for separate device design optimizations and fabrication procedures and increases the possibility of sample contamination.
In this work, we present the design and implementation of an all-PDMS platform which combines, on a single chip, sample processing with in-flow optical detection of biomolecular targets with single molecule sensitivity. Specifically, we use an array of pneumatically controlled and programmable micro valves to fluorescently label λ-DNA, immediately followed by optical detection with single molecule sensitivity. We further show the programmability and flexibility to handle more complex analytes by constituting, on chip, a labeled assay for multi-target Zika detection from human serum, which simultaneously captures and labels nucleic acids and proteins on magnetic beads, followed by immediate optical detection on the same chip. This dual assay allows for successful differentiation of Zika targets from structurally similar flaviviruses like dengue, thus paving the way for a fully integrated chip for disease diagnostics.
2. Experimental details and results
The architecture of the integrated optofluidic chip is shown in Figure 1. The device consists of two primary sections – one consisting of a series of pneumatic valves for on chip preparation of samples, and the other consisting of a combination of solid-core and liquid-core waveguides for excitation and collection of the fluorescently tagged biomolecules. Fabrication of the chip was carried out through a three layered PDMS architecture, with the central layer having higher refractive index to allow for definition of solid-core optical waveguides (Fig. 1b). Each layer is fabricated using standard soft lithography techniques (see Material and Methods for details).
Figure 1: Schematic of the optofluidic device:
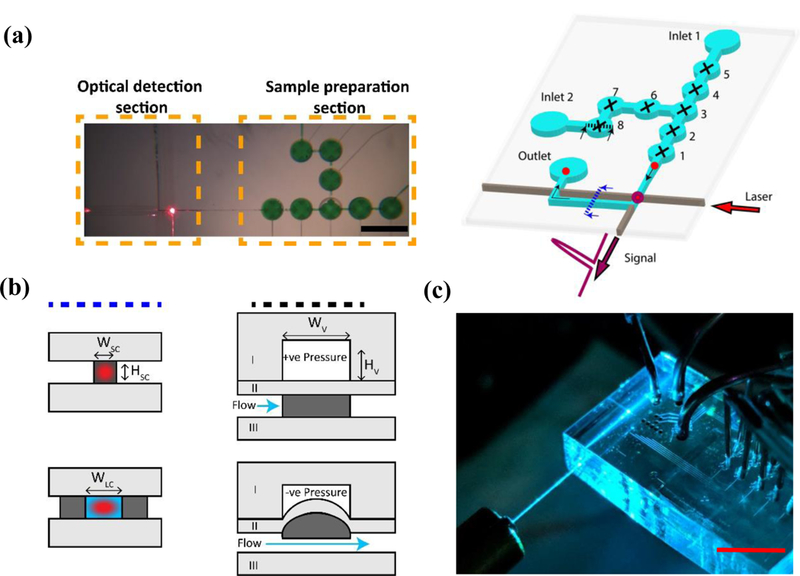
(a) (Left) A top-down image of the actual device with the two principal sections of the device shown (Scale bar: 1mm). (Right)The valves (1–8) are pneumatically controlled and individually programmable for operation. Samples are inserted through the inlets, and then captured and labelled with a fluorophore using the valves, before being pushed through to the optical section. The tagged particle (shown in red) is excited via laser coupled through the integrated PDMS waveguide (shown in brown) and the signal collected via an orthogonal liquid-core waveguide. The dotted lines indicate the cross sections shown in Figure 1(b). (b) Cross-sectional schematics of the sections in Figure 1(a) – operation of the optical waveguides and the pneumatic valves. Light grey indicates PDMS layer with 1:10 (curing agent: base) mixture, dark grey indicates layer PDMS layer with 1:5 (curing agent: base) mixture, blue indicates liquid volume and red indicates an excitation laser spot. The valves operate by applying positive pressure to keep the valve closed, or vacuum to open the valves. (c) A photograph of the actual chip (Scale bar: 1 cm) - the laser is coupled into the PDMS waveguides via a butt-coupled optical fiber, while metal tubings are used to provide access for pneumatic and fluidic control.
Sample preparation in the chip was carried out in an array of 8 pneumatically driven and individually programmable lifting-gate valves19 (Figure 1(a)), that can be individually opened and closed via a custom made control box interfacing with a Labview code. Optical detection is simultaneously carried out via a system of orthogonally intersecting optical waveguides. Solid-core PDMS waveguides are used to excite the fluorescently tagged target in the intersecting microfluidic channel. The emitted photons are then carried orthogonally via the short leaky mode liquid waveguide (Figure 1b) into another solid-core optical waveguide and through to the off-chip single photon avalanche photodetector (APD) to obtain a fluorescence time trace of the emission signal. Two different types of assays were carried out using the optofluidic chip – one consisting of single nucleic acid detection, and the other consisting of dual ZIKV nucleic acid and protein assay for differential diagnostics of ZIKV.
A. Single nucleic acid detection and limit of detection:
We investigated the sensitivity and (concentration) limit of optical detection in our device by detecting individual λ-DNA molecules. Inlet 1 (Figure 1(b)) was filled with 1x concentration of SYBR Gold (Thermo Fisher), an intercalation dye used for nucleic acid staining, while inlet 2 was filled with a known concentration of λ-DNA (New England Biosciences) in 1x TE buffer. The automaton was programmed to actuate the valves such that analytes from both inlets are brought to the intersecting center valve ‘3’, and then mixed by moving the fluids around between valve ‘3’ and its adjacent valves ‘6’ and ‘4’. The mixed sample was then incubated in the center valve for 3 mins to allow SYBR Gold to attach to the λ-DNA. After incubation, the stained λ-DNA from the center valve ‘3’ was pumped to the optical detection part of the device. An argon laser at 488 nm was coupled into the solid-core PDMS waveguide via an optical fiber to create around a sub-picoliter excitation volume in the liquid-core channel and was switched on at the end of the incubation cycle.
The automaton was programmed to repeat the mixing cycle once followed by pumping the DNA-dye complex through the optical region for 10 cycles. Figure 2 shows the fluorescence signal trace of one such complete sample preparation and detection cycle for sample concentration of 25 pg/µL. The background threshold is determined by the highest photon count signal before the pumping of the tagged DNA, and individual peaks from single nucleic acids above this threshold are counted (Figure 2 inset). This demonstrates single molecule detection sensitivity on this dual purpose chip. In order to assess the detection limit, we varied the DNA concentration using serial dilutions. The initial concentration of the λ-DNA was varied from 250 pg/µL – 2.5 pg/ µL in dilutions of 10, corresponding to a concentration of 800 – 8 fM (Figure S2), which covers the range of viral infectious diseases34,35. Similar optical detection systems have shown a dynamic range of 14 logs, starting from an analog detection regime at high concentrations down to single particle counting at several pfu/mL 31 Assuming full length DNA, we observed approximately 60% of the total peaks expected at 800fM. Since we operate at concentrations in the digital regime where individual molecules are counted, the count rate scaled with concentration as expected. At the lowest concentration, our experiments, performed in triplicates, showed a detection rate of ~5 events per nL of sample flow, as compared to a rate of less than one event per 100 nL of flow for blank samples. However, the starting sample volume (~5nL, determined by the size of a single microvalve valve) being pushed through the optical region, dictated the detection limit rather than the sensitivity of the optical detection. This represents the first demonstration of amplification-free detection of nucleic acids at femtomolar concentrations with single molecule sensitivity, with integrated sample processing, on a single flexible reconfigurable platform.
Figure 2: Detection of individual λ-DNA molecules:
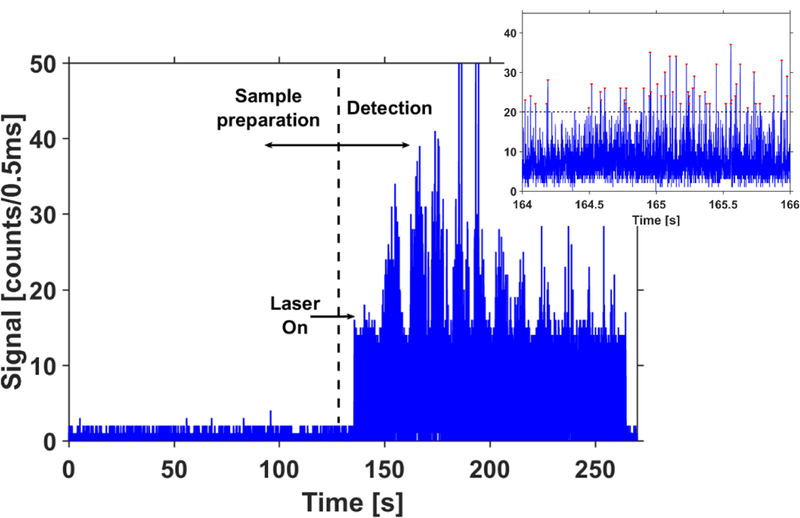
Collected fluorescence trace for the detection of λ-DNA molecules fluorescently labelled with SYBR gold. The traces show results from complete cycle for a sample concentration of 25 pg/µL, consisting of sample preparation and subsequent pumping cycles. Laser is off when the sample is being prepared within the chip and switched on just before the DNA particles are transferred to the optical part of the device. Inset shows a magnified view of the signal observed in the 1st cycle. All signals above the threshold (dotted line) correspond to individual λ-DNA molecules.
B. Simultaneous preparation and detection of Zika nucleic acid and protein assay
Next, we demonstrated the implementation of the dual target assay for sample-to-answer Zika target detection. The automaton architecture can be reconfigurably programmed for dynamic sample preparation, including implementing functions such as sample distribution, mixing, thermal annealing, fluorescent labeling and washing, to be performed on-chip31. We used these capabilities of our device to prepare magnetic bead assay complexes completely on-chip, immediately followed by optical detection on the same chip. We showed that the process is compatible for formation of both DNA-based and protein-based magnetic bead complexes by simultaneous preparation and detection of DNA and protein markers specific to Zika virus.
Inlet 1 was used as the sample inlet and filled with a mixture of Zika nucleic acid (5 μM) and Zika NS1 protein targets (0.5 mg/ml), to be fluorescently labelled and detected on chip (Figure 3(a), Box I). On the other hand, inlet 2 was used as the reagent inlet, with a mixture of magnetic capture beads (Concentration: 2.5×10⁸ beads/mL) and both nucleic acid and protein target specific probes (2.5 μM of nucleic acid fluorescent probe and 0.25 mg/ml of antibody fluorescent probe) introduced into the inlet. The device was programmed to do all sample processing steps automatically. The automaton valve array was used to bring the analytes from both the inlets in contact with each other, and mixed them using valves ‘3’, ‘4’ and ‘6’, similar to the λ-DNA assay. The mixed analytes were transferred to valve ‘3’ and heated to a temperature of 55°C for 5 min using a thermoelectric heater kept underneath and in close contact with the device. At this temperature, which is close to the melting temperature of the nucleic acids, the coiled nucleic acid targets and fluorescent probes opened up to bind together. The heating temperature was chosen to both allow for uncoiling the nucleic acids while also preventing the protein analytes from getting denatured. The analytes were then allowed to incubate for 45 minutes during which the nucleic acid and protein targets combined with the corresponding fluorescent probes and capture beads (Figure 3(a), Box II). Meanwhile, the inlets were washed and replaced with 1x PBS buffer. After the incubation period, the thermoelectric heater was replaced with a magnet to pull all the magnetic beads down and keep them trapped at the bottom of the valve ‘3’, while the programmed automaton valves washed away the unbound targets and the fluorophores by pumping PBS buffer from inlet 1 through to inlet 2, leaving behind only the pulled down magnetic bead nucleic acid and protein complexes in valve ‘3’.
Figure 3: Schematic of the procedure for magnetic bead assay preparation on chip:
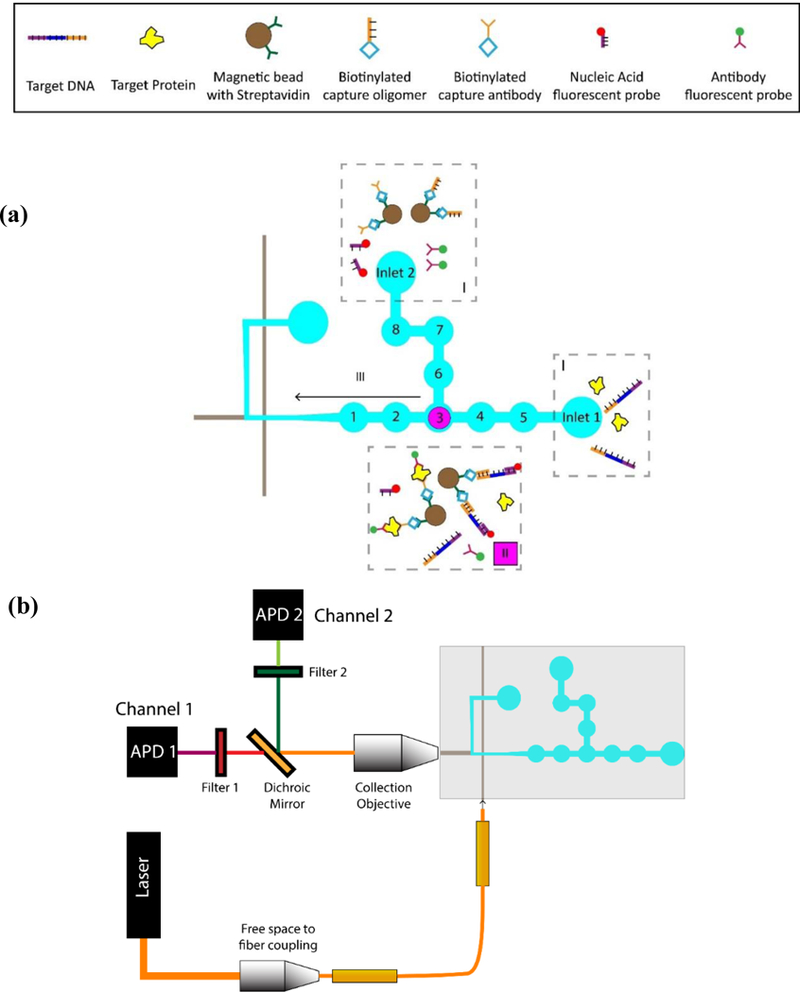
(a) (I) Samples (protein and DNA targets) are introduced in inlet 1, while the other components (magnetic beads with capture probes and corresponding fluorescent probes) are introduced in inlet 2. (II) Samples are brought together in valve 3, mixed, heated and incubated for the correct targets to be captured and assay formation to take place. Beads are pulled down with a magnet, and unmatched targets and unconjugated probes are washed away. (III) The magnet is removed and the released magnetic beads with captured targets and probes are pushed through to the optical waveguides where they are detected as before. (b) Schematic of the experimental setup: Free space optics is used to couple the exciting laser into an optical fiber, which in turn, is butt-coupled to the optical waveguide on the PDMS chip. A collection objective is used to collect the fluorescent signal orthogonally to the excitation light. The collected signal is then passed through to an APD via an optical filter to remove the excitation light. In case of the dual assay, a dichroic mirror is used to split the collected signals into two separate channels.
For optical detection of the constituted bead complexes, the magnet was removed from underneath the device and the target containing solution was flutter mixed between valve ‘3’ and ‘6’ to resuspend the settled magnetic beads into the liquid volume. The automaton then pumped the assay to the optical side of the chip to be fluorescently excited by the solid-core PDMS waveguides where the PDMS waveguides had now been coupled to HeNe and frequency doubled Nd:YAG lasers at 633 nm and 556 nm, respectively. The signals collected from the device was spectrally separated and filtered off chip and detected simultaneously by two synchronized APDs (Figure 3(b)).
Figure 4(a) shows the fluorescence trace as collected in the two APDs – nucleic acids (red) on APD1 and proteins (green) on APD2. The automaton was programmed to flush the analytes 10 times to ensure that most beads pass through the excitation volume and are detected. Peaks observed above a set threshold in each channel are counted with each peak corresponding to a single bead with the respective captured and tagged targets (Figure 4(a) inset). Whereas solutions with just the fluorophores gave no signals, indicating signals are obtained only after successful hybridization of the targets with the corresponding fluorophore. Fig. 4a shows detection of fluorescence from single beads from the nucleic acid assay trace (red) with a signal-to-noise ratio (SNR) (defined as the ratio of average peak height and the noise threshold) of 12.5, while the protein assay trace (green) exhibited an SNR of 4. It should be noted that the broad emission spectrum of the green fluorophore of the antibody probe and imperfection in the dichroic mirror led to a small leakage of protein signal to APD1 (Figure S3). An algorithm was used to identify similar time tags between peaks from the two channels which were then excluded from the nucleic acid signal trace.
Figure 4: Simultaneous detection of Zika nucleic acid and protein targets:
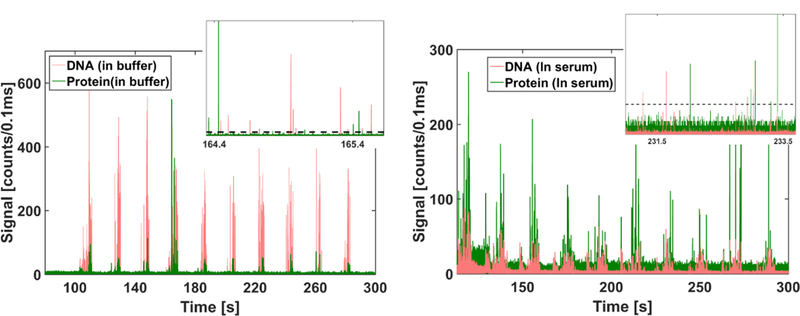
(a) In buffer: Fluorescent time domain trace showing peaks observed from nucleic acid magnetic bead complexes (red) and protein magnetic bead complexes (green) collected simultaneously through two separate APDs. The channels were flushed for 10 cycles to ensure that most of the beads are pushed through to the optical section of the device. Inset shows a magnified view with individual peaks from both channels (red and green), corresponding to excited DNA and protein magnetic bead complexes respectively, clearly distinguishable from the background (dashed line) (b) In Serum: Fluorescent time domain trace showing peaks observed from nucleic acid magnetic bead complexes (red) and protein magnetic bead complexes (green) with targets spiked in human serum.
In order to evaluate the device for use with complex, biological samples, we analyzed both nucleic acid and protein targets spiked in human serum (Sigma-Aldrich). 2 µL of DNA targets and 2 µL of NS1 protein targets were spiked in 6µL of serum to yield an end concentration of 2µM and 0.6 mg/ml for DNA and protein targets, respectively. The assay preparation, and subsequent optical detection, was carried out as described above with the assay heated to 40°C (instead of 55°C) during the conjugation step. The subsequent washing steps effectively wash away the serum and replace it with buffer where the constituted magnetic bead assays are then released from the magnet and detected. Similar to Figure 4(a), Figure 4(b) shows the fluorescence trace from the two APDs corresponding to both nucleic acids (red) and proteins (green), exhibiting fluorescence peaks from individual target-containing beads with comparable SNRs of 2.8 (nucleic acids) and 2.5 (proteins), respectively (Figure 4(b) inset). However, the number of peaks observed in both the DNA and the protein channel nearly doubled as compared to that in the buffer matrix. A control with monovalent streptavidin and non-Zika specific nucleic acid targets (Zaire Ebola AY354458.1, nt. 6832–6931) at the same concentrations in serum yielded no signals (Figure S4), indicating the desired specific nature of the assay.
We note that serum samples did lead to an increase in the background (noise) reducing the SNR of the detected assays. However, the presence of serum seemed to improve the hybridization efficiency of the assay as a greater number of events were detected in both the DNA and the protein channels. These results demonstrated the capability of our device to handle realistic biological samples like serum effectively without need for changes in the device architecture. This is enabled by the effective isolation of the optical detection region from the sample preparation region, allowing the optical region to operate independently and unaffected by the complexity of the operations carried out in the sample preparation region.
In order to determine the lowest concentrations that can be detected using this type of assay, the experiment was implemented with a 100x dilution of the sample concentrations above (6µL of serum spiked to final concentrations of 20 nM DNA target and 6µg/ml NS1 protein target), and as expected, the number of peaks detected in the nucleic acid trace and the protein trace decreased. Figure 5(a) shows the distribution of the peak heights for the DNA bead assays for the two concentrations, while Figure 5(b) shows the same for the protein bead assays. Each histogram is normalized by the total number of peaks observed in the higher concentration assay. As can be seen, the histogram plot for the protein is shifted to the right as compared to that for DNA, indicating that the average peak heights were higher for protein assays as compared to the DNA assays. However, as noted above, the average SNR for both assays was found to be similar due to higher noise from the protein channel. Further, decreasing the concentration of the analyte also led to a reduction in signal strengths of the detected assays. This indicates that the detection limit of our device is ultimately restricted by the type of assay employed here, as lower concentrations of analytes limits the number of targets (and thus, corresponding fluorophores) being captured on each individual bead. This can be addressed by releasing the targets from the beads and labeling them with multiple dyes as has previously been demonstrated for nucleic acids31. Other specific labeling strategies for proteins and nucleic acids, for e.g. using single probes with multiple fluorophores such as Nanostrings41, can also be developed and have been previously implemented in automaton architectures like ours36.
Figure 5: Distribution of signal strengths for Zika DNA and protein assays at different analyte concentrations in human serum.
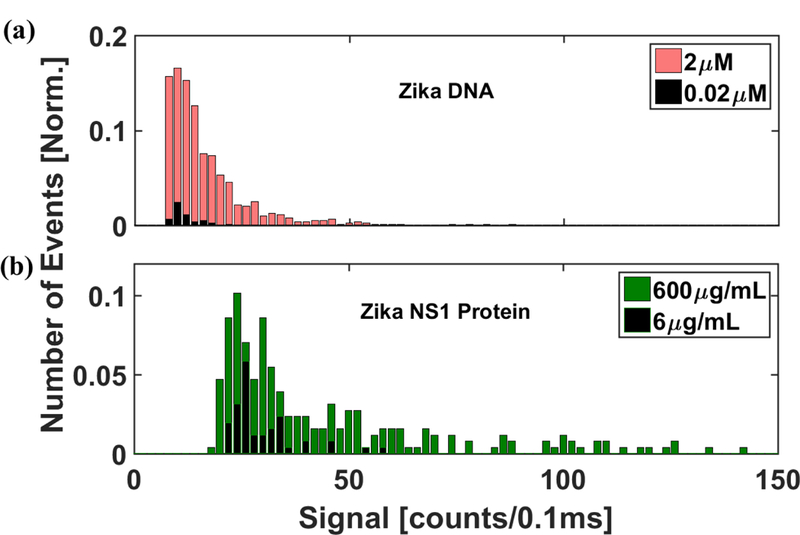
(a) Histogram of the signal strength of the bead based Zika nucleic acid assays detected at 2μM and 0.02 μM sample concentrations in human serum. (b) Histogram of the signal strength of the bead based Zika NS1 protein assays detected at 600μg/mL and 6 μg/mL sample concentrations in human serum. The distribution was normalized with respect to the total number of events detected from the higher concentration assays. The distribution of protein assays shows higher average signal strength as compared to the nucleic acids. Both the total number of events and the signal strength were found to be reduced at lower concentrations for both the assays.
C. Optofluidic device for rapid target differentiation
We demonstrate the advantage of dual detection of proteins and nucleic acids by repeating the aforementioned experiments with identical concentrations of non-Zika targets. Figure 6 shows the normalized number of peaks detected by the device from protein and nucleic acid assays for each combination of DNA and protein target tested, with the normalization carried out with respect to the number of peaks observed from assays made with the actual Zika targets. When Zika NS1 protein targets and non-Zika specific nucleic acid targets (Zaire Ebola AY354458.1, nt. 6832–6931) were introduced into the device, we found that the protein assay signal remained similar to that seen earlier whereas the nucleic acid assay signal was found to be two orders of magnitude lower than seen in experiments with actual targets (Figure 6c). Similarly, when repeating the test with Zika nucleic acid target and a similar sized non-Zika protein target (monovalent streptavidin), we saw a slight increment in the nucleic acid assay signal but the protein assay signal was found to be about 16 times lower than the corresponding figure for Zika specific proteins (Figure 6d). Finally, when the experiment was carried out with Dengue virus targets (Dengue NS1 and KP188540.1, nt. 186–281 capsid region of the gene), with the Dengue NS 1 protein known to exhibit cross reactivity with the corresponding Zika antibodies, we observed, as expected, a small but significant signal from the protein assay (0.2) indicating a false positive (Figure 6b). However, extremely low signal from the nucleic acid assay (0.02) clearly indicated that the nucleic acid targets are not ZIKA specific, thus enabling an overall correct identification.
Figure 6: Target differentiation through dual protein-nucleic acid assay:
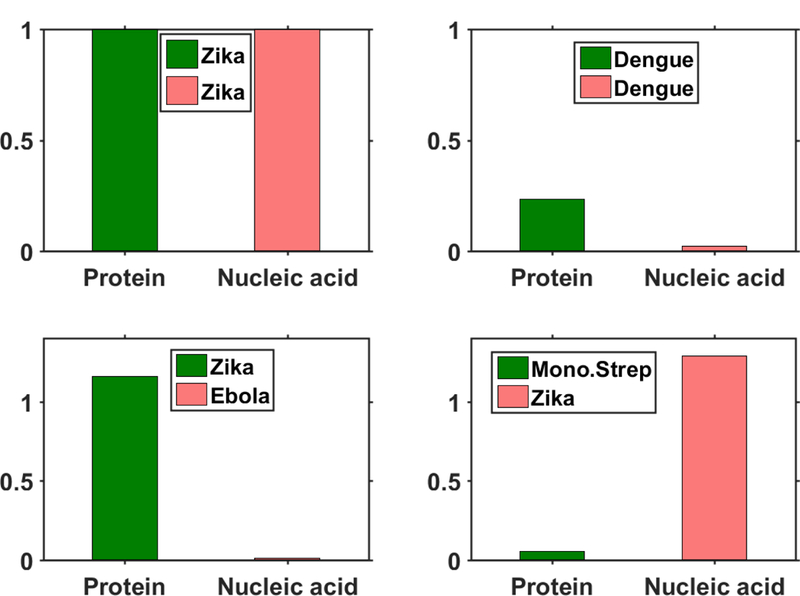
Bar plots indicate relative number of peaks observed in the protein (green) and nucleic acid (red) channel in each of the 4 separate tests. Each bar plot is normalized with respect to the number of peaks observed with Zika nucleic acid and protein targets. Very few peaks are seen when the wrong nucleic acid (Ebola) target and wrong protein (Monovalent Streptavidin) targets are introduced. However, a significant signal is observed with dengue protein targets due to cross reactivity with Zika NS1 antibodies, but the low signal in the nucleic acid channel confirms the absence of the Zika target.
3. Conclusion
In summary, we have developed a novel, programmable optofluidic analysis system that unites sample preparation and analysis on a single chip. The integration of waveguide based readout with precise fluid handling can provide single nucleic acid sensitivity as demonstrated by fluorescent labeling and detection of individual λ-DNA molecules at concentrations down to the fM regime. We further utilize the complex sample preparation capabilities to simultaneously constitute protein and nucleic acid based solid phase extraction assays for capturing and detecting multiple Zika specific targets on a single device. In the future, both single analyte detection and multi-target analysis in complex samples can be combined by releasing the targets from the beads and labeling each with multiple dyes31,37. We also demonstrated that the salient sample processing steps for target specific detection, extraction and fluorescent labeling, can be carried out in complex biological sample matrices like human serum. Additional processing steps, specifically filtering of whole blood, have been previously demonstrated on automaton chips4, pointing the way towards future complete sample-to-answer devices that are compatible with point-of-care use. Such automaton chips have already been demonstrated in other studies to be compatible with portable instruments ready for field testing38,39.
The development of a dual biomarker assay significantly reduces the false positive identification of Zika targets due to presence of cross reacting species like Dengue, and allows for successful diagnosis and differentiation of Zika on a single integrated optofluidic platform. Further optimization of the device can enable direct counting of both target types and allow for multiplexed detection of multiple targets without off chip spectral decomposition using multi-mode interference waveguides40.
4. Materials and Methods
A. Fabrication of PDMS device:
The optofluidic chip was fabricated in two parts using soft lithography processes as shown in supplementary figure S1. Two separate masters – one consisting of the optical waveguides and the fluidic channels, and the other consisting of the pneumatic valves - were fabricated with standard photolithography processes using negative photoresist SU-8 2005 (Microchem) and SU-8 2025 (Microchem) respectively, and were subsequently silanized. A 1:5 (curing agent: base polymer) PDMS (Sylgard) mixture was then spun onto the 1st master at 5000 RPM for 25 minutes, followed by curing in a 60°C oven for 2 hours. Afterwards, a 1:10 (curing agent: base polymer) PDMS mixture was spun onto this layer at 1000 RPM for 5 minutes and then cured overnight in the 60°C oven. The 1:5 PDMS layer acts as the waveguide core with refractive index (1.425) while the 1:10 PDMS layer acts as the cladding layer with refractive index (1.420)29. It also serves as the lifting gate membranes for the pneumatic valves. Concurrently, a 1:10 (curing agent: base polymer) PDMS mixture was poured onto the 2nd master for fabrication of the control layer consisting of the pneumatic valves. After curing in the 60°C oven for 2 hours, this layer was peeled off from the SU-8 master, and ports (d=0.5 mm) were punched for pneumatic access.
The two layers were then treated with oxygen plasma (30 sec at 60W power) to activate the necessary surfaces, and immediately brought in contact after careful alignment using a custom-built rig. Subsequent baking at 60°C for 2 hours enhanced the bonding between the two layers. The combined layers were peeled off from the 1st master and punches were made at the liquid reservoir sites to allow for liquid access. Finally, another step of plasma bonding was carried out to bond the two-layer device to a previously cured 1:10 (curing agent: base polymer) PDMS substrate. A sharp blade was used to cut the two optical interfaces to provide smooth waveguide ends for efficient optical coupling.
B. Device design:
Each valve in the sample preparation section (Figure 1a) was connected via channels of width 50 μm and measured 0.5 mm in diameter, while the channel height measured 5–7 μm throughout the device, yielding a valve volume of approximately 1.3 nL. The liquid channel which connects the pneumatic valves to the optical detection part was tapered to minimize backflow. Fluid access was provided through two punched inlets (marked as inlet 1 and inlet 2) into two separate channels. The two channels were brought together to meet at the center for mixing and sample preparation, before being pumped out through to the optical section for detection of the prepared samples. The liquid channel tapered down to a width of 15 μm as it intersects with the solid-core optical waveguides (width x height: 10 × 7 μm) before expanding again as it approaches the outlet reservoir.
C. Magnetic bead assay preparation:
Nucleic acid assay parameters: A 100 base pair long single strand DNA oligomer corresponding to the capsid part of the Zika genome (KU321639.1, nt. 121–220) was chosen as the nucleic acid target for the experiments. A 25-mer oligonucleotide with an attached fluorophore (excitation: 633 nm, emission: 670 nm), designed to be reverse complementary to a region of the above-mentioned target (KU321639.1, nt. 187–211), acted as the target specific fluorescent probe, while a 50-mer biotinylated oligonucleotide, designed to hybridize to a different part of the target sequence (KU321639.1, nt. 130–179), acted as the capture probe. All nucleotides were obtained from Integrated DNA Technologies (IDT Inc.). Streptavidin coated magnetic beads (Dynabeads™ MyOne™ Streptavidin T1, Thermofisher Scientific) were conjugated off-chip with the biotinylated capture oligonucleotide using standard protocol41, and subsequently washed thrice to remove any unconjugated oligonucleotide.
Protein assay parameters: Recombinant Zika NS1 antigen, obtained from East Coast Biologics Inc., as the protein target were used. Monoclonal antibodies specific to the Zika NS1 region were also obtained from EastCoast. Bio One set of antibodies was labelled with the Cyanine 3 (Cy-3) fluorophore (Lumiprobe) to act as the protein specific fluorescent probe, while another set of the antibodies was modified with biotin for subsequent conjugation in 1x PBS to the streptavidin coated magnetic beads (Dynabeads™ MyOne™ Streptavidin T1, Thermofisher Scientific). After the conjugation, the magnetic beads were washed thrice to remove any unconjugated antibodies from the solution.
Supplementary Material
ACKNOWLEDGMENTS
We thank Dr. R. Carrion Jr. from the Texas Biomedical Research Institute for help with designing the nucleic acid targets and probes. We also thank Dr. Richard Mathies and Dr. Ke Du from University of California, Berkeley for helpful discussions regarding design of the optofluidic chip. We acknowledge support by the W.M. Keck Center for Nanoscale Optofluidics at UC Santa Cruz, the NIH under grants 4R33AI100229 and R01AI116989, and the NSF under grant CBET-1703058.
References:
- 1.Hamburg MA and Collins FS, N. Engl. J. Med, 2010, 363, 301–304. [DOI] [PubMed] [Google Scholar]
- 2.Ashley EA, Nat. Rev. Genet, 2016, 17, 507–522. [DOI] [PubMed] [Google Scholar]
- 3.Frei AP, Bava F-A, Zunder ER, Hsieh EWY, Chen S-Y, Nolan GP and Gherardini PF, Nat. Methods, 2016, 13, 269–275. [DOI] [PMC free article] [PubMed] [Google Scholar]
- 4.Cai H, Stott MA, Ozcelik D, Parks JW, Hawkins AR and Schmidt H, Biomicrofluidics, 2016, 10, 064116. [DOI] [PMC free article] [PubMed] [Google Scholar]
- 5.Brunner MC, Chambers CA, Chan FK, Hanke J, Winoto A and Allison JP, J. Immunol, 1999, 162, 5813–20. [PubMed] [Google Scholar]
- 6.Types of Zika Virus Tests | Zika Virus | CDC, https://www.cdc.gov/zika/laboratories/types-of-tests.html, (accessed 1 January 2018).
- 7.New CDC Laboratory Test for Zika Virus Authorized for Emergency Use by FDA | CDC Online Newsroom | CDC, https://www.cdc.gov/media/releases/2016/s0226-laboratory-test-for-zika-virus.html, (accessed 1 January 2018).
- 8.Osterholm MT, Science, 2016, 353, 1073. [DOI] [PubMed] [Google Scholar]
- 9.Pabbaraju K, Wong S, Gill K, Fonseca K, Tipples GA and Tellier R, J. Clin. Virol, 2016, 83, 66–71. [DOI] [PubMed] [Google Scholar]
- 10.Therriault D, White SR and Lewis JA, Nat. Mater, 2003, 2, 265–271. [DOI] [PubMed] [Google Scholar]
- 11.Sarioglu AF, Aceto N, Kojic N, Donaldson MC, Zeinali M, Hamza B, Engstrom A, Zhu H, Sundaresan TK, Miyamoto DT, Luo X, Bardia A, Wittner BS, Ramaswamy S, Shioda T, Ting DT, Stott SL, Kapur R, Maheswaran S, Haber DA and Toner M, Nat. Methods, 2015, 12, 685–691. [DOI] [PMC free article] [PubMed] [Google Scholar]
- 12.Agresti JJ, Antipov E, Abate AR, Ahn K, Rowat AC, Baret J-C, Marquez M, Klibanov AM, Griffiths AD and Weitz DA, Proc. Natl. Acad. Sci. U. S. A, 2010, 107, 4004–9. [DOI] [PMC free article] [PubMed] [Google Scholar]
- 13.Ottesen EA, Hong JW, Quake SR and Leadbetter JR, Science, 2006, 314, 1464–7. [DOI] [PubMed] [Google Scholar]
- 14.Ding X, Lin S-CS, Kiraly B, Yue H, Li S, Chiang I-K, Shi J, Benkovic SJ and Huang TJ, Proc. Natl. Acad. Sci. U. S. A, 2012, 109, 11105–9. [DOI] [PMC free article] [PubMed] [Google Scholar]
- 15.White AK, VanInsberghe M, Petriv OI, Hamidi M, Sikorski D, Marra MA, Piret J, Aparicio S and Hansen CL, Proc. Natl. Acad. Sci. U. S. A, 2011, 108, 13999–4004. [DOI] [PMC free article] [PubMed] [Google Scholar]
- 16.Hong JW, Studer V, Hang G, Anderson WF and Quake SR, Nat. Biotechnol, 2004, 22, 435–439. [DOI] [PubMed] [Google Scholar]
- 17.Prakadan SM, Shalek AK and Weitz DA, Nat. Rev. Genet, 2017, 18, 345–361. [DOI] [PMC free article] [PubMed] [Google Scholar]
- 18.Kim J, Kang M, Jensen EC and Mathies RA, Anal. Chem, 2012, 84, 2067–2071. [DOI] [PMC free article] [PubMed] [Google Scholar]
- 19.Ma C, Fan R, Ahmad H, Shi Q, Comin-Anduix B, Chodon T, Koya RC, Liu C-C, Kwong GA, Radu CG, Ribas A and Heath JR, Nat. Med, 2011, 17, 738–743. [DOI] [PMC free article] [PubMed] [Google Scholar]
- 20.Dittrich PS and Manz A, Nat. Rev. Drug Discov, 2006, 5, 210–218. [DOI] [PubMed] [Google Scholar]
- 21.Weiss M, Frohnmayer JP, Benk LT, Haller B, Janiesch J-W, Heitkamp T, Börsch M, Lira RB, Dimova R, Lipowsky R, Bodenschatz E, Baret J-C, Vidakovic-Koch T, Sundmacher K, Platzman I and Spatz JP, Nat. Mater, 2017, 17, 89–96. [DOI] [PubMed] [Google Scholar]
- 22.A. P. F. Turner, Chem. Soc. Rev, 2013, 42, 3184. [DOI] [PubMed] [Google Scholar]
- 23.Fan X, Advanced photonic structures for biological and chemical detection, Springer, 2009. [Google Scholar]
- 24.Stoddart D, Heron AJ, Mikhailova E, Maglia G and Bayley H, Proc. Natl. Acad. Sci. U. S. A, 2009, 106, 7702–7. [DOI] [PMC free article] [PubMed] [Google Scholar]
- 25.Cooper MA, Nat. Rev. Drug Discov, 2002, 1, 515–528. [DOI] [PubMed] [Google Scholar]
- 26.Joo C, Balci H, Ishitsuka Y, Buranachai C and Ha T, Annu. Rev. Biochem, 2008, 77, 51–76. [DOI] [PubMed] [Google Scholar]
- 27.Schmidt H and Hawkins AR, Nat. Photonics, 2011, 5, 598–604. [Google Scholar]
- 28.Chang-Yen DA, Eich RK and Gale BK, J. Light. Technol, 2005, 23, 2088–2093. [Google Scholar]
- 29.Parks JW and Schmidt H, Sci. Rep, 2016, 6, 33008. [DOI] [PMC free article] [PubMed] [Google Scholar]
- 30.Azmayesh-Fard SM, Flaim E and McMullin JN, J. Micromechanics Microengineering, 2010, 20, 087002. [Google Scholar]
- 31.Cai H, Parks JW, Wall TA, Stott MA, Stambaugh A, Alfson K, Griffiths A, Mathies RA, Carrion R, Patterson JL, Hawkins AR and Schmidt H, Sci. Rep, 2015, 5, 14494. [DOI] [PMC free article] [PubMed] [Google Scholar]
- 32.Jung YK, Kim J and Mathies RA, Anal. Chem, 2015, 87, 3165–3170. [DOI] [PubMed] [Google Scholar]
- 33.Parks JW, Olson MA, Kim J, Ozcelik D, Cai H, Carrion R, Patterson JL, Mathies RA, Hawkins AR and Schmidt H, Biomicrofluidics, 2014, 8, 054111. [DOI] [PMC free article] [PubMed] [Google Scholar]
- 34.Theel ES and Hata DJ, J. Clin. Microbiol, 2018, 56, e01972–17. [DOI] [PMC free article] [PubMed] [Google Scholar]
- 35.Wu J, Dong M, Rigatto C, Liu Y and Lin F, npj Digit. Med, 2018, 1, 7. [DOI] [PMC free article] [PubMed] [Google Scholar]
- 36.Du K, Park M, Griffiths A, Carrion R, Patterson J, Schmidt H and Mathies R, Anal. Chem, 2017, 89, 12433–12440. [DOI] [PMC free article] [PubMed] [Google Scholar]
- 37.Du K, Cai H, Park M, Wall TA, Stott MA, Alfson KJ, Griffiths A, Carrion R, Patterson JL, Hawkins AR, Schmidt H and Mathies RA, Biosens. Bioelectron, 2017, 91, 489–496. [DOI] [PMC free article] [PubMed] [Google Scholar]
- 38.Kim J, Jensen EC, Stockton AM and Mathies RA, Anal. Chem, 2013, 85, 7682–7688. [DOI] [PubMed] [Google Scholar]
- 39.Zhang M, Phung SC, Smejkal P, Guijt RM and Breadmore MC, Trends Environ. Anal. Chem, 2018, 18, 1–10. [Google Scholar]
- 40.Ozcelik D, Jain A, Stambaugh A, Stott MA, Parks JW, Hawkins A and Schmidt H, Sci. Rep, 2017, 7, 12199. [DOI] [PMC free article] [PubMed] [Google Scholar]
- 41.Dynabeads® MyOne™ Streptavidin C1. nanoString Technologies, Inc.; [Google Scholar]
Associated Data
This section collects any data citations, data availability statements, or supplementary materials included in this article.


