Abstract
Carbon dots (CDs) usually emit a strong blue light and excitation wavelength dependent long wavelength lights. This significantly limits their applications because one has to use a series of different excitation light sources to get different colors and the long wavelength emissions are usually very weak. We found that one type of CDs synthesized from p-phenylenediamine could emit various long wavelength lights (green to red) independent of the excitation wavelength when dispersed in different solvents. The photoluminescence quantum yields of the same CDs were 10–35% in different solvents for different color emissions. Based on this solvent-color effect, we further mixed the same CDs with different polymers to form solid CD films for various color emissions, and these film emissions were also excitation wavelength independent. Multicolor LEDs were demonstrated with the same CDs in solution and solid film states for color displays.
Introduction
Carbon dots (CDs) have emerged as a new type of fluorescent material due to their multiple advantages, such as high photoluminescence quantum yield (QY), earth abundant raw materials, great environmental sustainability, low production cost, and excellent biocompatibility.1–4 CDs thus have already been studied for broad applications including in fluorescent probes and sensors,5,6 biolabeling and medical imaging,7,8 LED color display and lighting devices.9–11 In these applications, the fluorescence emission colors from blue to red are all needed, especially from green to red.12,13 Therefore, the development of multicolor emission CD materials is highly desirable.14
Many CD materials have been synthesized over the past decade from a variety of starting materials and preparation methods. They could emit photoluminescence colors from blue to red, but most of them emitted strong blue light, and the other longer wavelength lights were obtained with long excitation wavelengths.3,5,15 A similar phenomenon was also observed with electroluminescence; longer wavelength (than blue) lights required higher injection currents in an LED design.9 Such excitation wavelength dependent emissions were usually ascribed to the different photon absorption mechanisms of the CDs and they often delivered very low QYs for yellow and red lights.16,17 Another way to obtain a long wavelength light is to use repeated photon absorption and emission with the extended light pathway length or the increased concentration of the CD particles in solutions or solid matrices.18,19 Apparently, the emission efficiency was very low, too. Nonetheless, Pan et al. lately prepared some CDs with citric acid and formamide by using a microwave. These CDs showed the same excitation wavelength dependent multicolor emission, but with comparable QYs (11.9–26.2%) across nearly the entire visible spectrum (466–637 nm) in water.20
Besides the majority of reports describing the excitation wavelength dependent emission behavior, several recent reports described methods to obtain multicolor CD emissions under one single excitation wavelength. Hu and colleagues prepared six CD samples with photoluminescence colors of blue to red (400–710 nm, QY 6–20%) by adjusting the reagents and synthesis conditions. The multicolor emissions were due to the changes in the CD’s chemical composition, primarily epoxides or hydroxyls on the CD surface.21 Pang and coworkers prepared a series of CDs with different fluorescence emissions from 430–610 nm (QY 1.1–20.7%) by tuning the reaction time, reaction temperature and amount of nitric acid, and the reasons for such multicolor emissions were ascribed to both the quantum size effect and surface oxidation.22 Lin’s group synthesized three CDs with blue (435 nm, QY 17.6%), green (535 nm, QY 4.8%) and red (604 nm, QY 26.1%) emissions by a solvothermal method from three different organic compounds as carbon sources. They claimed that the mechanism of different emission colors was due to the quantum size effect and the nitrogen content of the CDs.23 Ding et al. used p-phenylenediamine and urea through a hydrothermal synthesis method to prepare a batch of CDs. The CDs were separated via silica column chromatography and eight CD portions with emissions of blue to red (440–625 nm, QY 8.5–35%) were obtained. The different emission colors were due to the different surface states.15 All these CDs emitted different long wavelength lights under one single excitation wavelength because of their different sizes and/or different surface states.
Other than these reports, a few publications briefly mentioned CD emission color changes in different solvents. For example, Wu and coworkers reported that the fluorescence emission of their CDs changed from 400 to 430 nm in different solvents with the same excitation wavelength.24 Lin et al. stated that the CDs synthesized from m-phenylenediamine exhibited strong solvent-dependent emission of 400–500 nm in different solvents.25 A research on graphene quantum dots also described an emission wavelength change from 475 to 515 nm in a few solvents.26
Herein, we report a method (see the Experimental section in the ESI†) in which the photoluminescence color change is varied from 511 to 615 nm on the same CDs in a series of solvents. All the colors can be simultaneously excited by one excitation wavelength and all the emission spectra are strictly excitation wavelength independent. The as-synthesized CDs can also be embedded in different polymer matrices to form CD/polymer composites as solid phosphors which also exhibit strict excitation wavelength independent multicolor photoluminescence from dark green to red.
Results and discussion
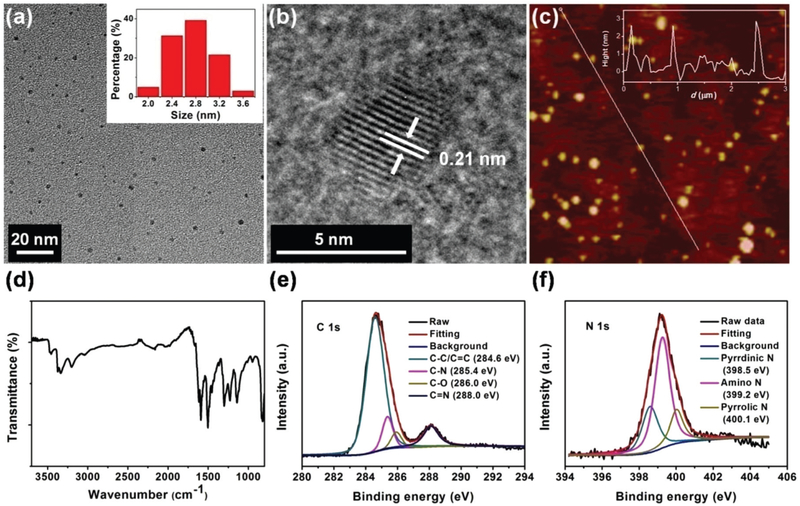
The morphology of our CDs was characterized by transmission electron microscopy (TEM) and atomic force microscopy (AFM). As shown in Fig. 1a, the CDs have diameters in the range of 2.0 to 3.6 nm and the average diameter is 2.6 nm. The high-resolution TEM (HRTEM) images show that the CDs have clear crystalline lattice fringes (Fig. 1b). The 0.21 nm spacing could be attributed to the (100) in-plane lattice of graphene.11,27 The AFM image of CDs (Fig. 1c) exhibits similar results to the TEM characterization; their topographic heights are about 2.7 nm, indicating that the CDs are nearly spherical.
Fig. 1.
The TEM (a), HRTEM (b), and AFM (c) images of the CDs. The inset in (a) shows the particle size distribution histogram. The inset in (c) shows the height-profile analysis along the corresponding line. The FTIR (d), high-resolution XPS spectra of C 1s (e) and N 1s (f) of the CDs show the existing chemical bonds and compositions.
The surface functional groups and chemical compositions of the CDs were investigated by Fourier transform infrared (FTIR) and X-ray photoelectron spectroscopy (XPS). The FTIR spectrum is shown in Fig. 1d. Many bonds were observed in the CDs, such as −OH (3468 cm−1), N–H (3383–3193 cm−1), C–H (3031 cm−1), C═N (1638 cm−1), C═C (1597 cm−1), C–N (1493 and 1304 cm−1), and C–O (1140 cm−1). It is revealed that the CDs were composed of aromatic structures and possessed abundant −NH2 on their surface. XPS was used to further explore the CD surface. The spectrum presented in Fig. S1† shows three typical peaks: C 1s (285 eV), N 1s (399 eV), and O 1s (533 eV). These findings indicate that the CDs are consisted of C, N and O elements. The atomic percentages of C, N and O were 61.82%, 27.33%, and 10.85%, respectively; the atomic ratio of C, N and O elements was therefore calculated as 1 : 0.442 : 0.176. In the high-resolution XPS spectrum of C 1s (Fig. 1e), there are four peaks for different states of carbon: C–C/C═C (284.6 eV), C–N (285.4 eV), C–O (286.0 eV), and C═N (288.0 eV). The N 1s high-resolution XPS spectrum (Fig. 1f) can be analyzed as three peaks at 398.6, 399.3 and 400.2 eV, representing pyridinic, amino and pyrrolic N. It indicates that the CDs contain many nitrogenous fused-ring structures. The O 1s spectrum shows only one peak at 533.1 eV which can be attributed to the C–O bond (Fig. S2†).
The CDs exhibited excellent solubility in many organic solvents, such as carbon tetrachloride (CCl4), toluene, chloroform (CHCl3), acetone, N,N-dimethylformamide (DMF), and methanol (CH3OH). However, the CDs had relatively poor solubility in water. A clear CD water solution could be obtained with ultrasound, but a little precipitate appeared after 24 hours at room temperature.
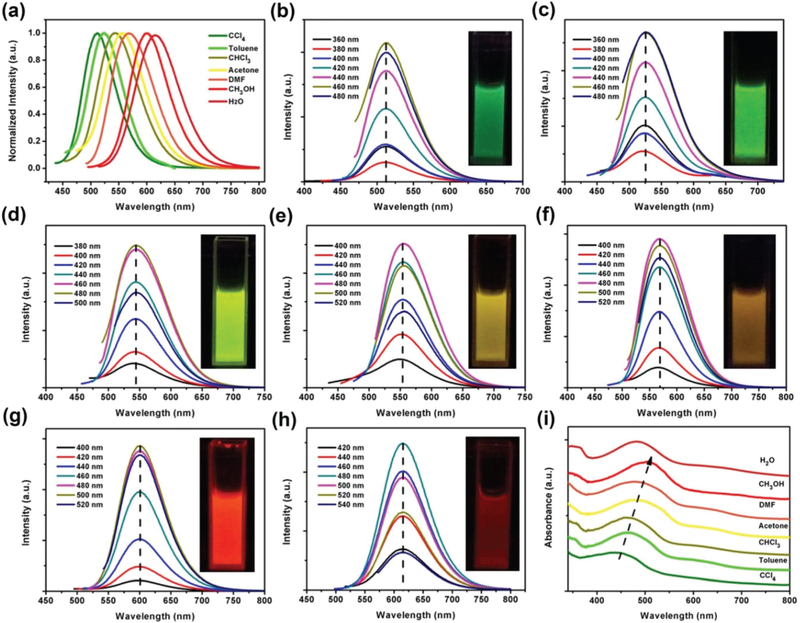
As shown in Fig. 2a, the CDs in different solvents exhibited different photoluminescence peaks under a single excitation wavelength. The emission peaks were observed at 511, 525, 545, 554, 568, 602 and 615 nm in CCl4, toluene, CHCl3, acetone, DMF, CH3OH and H2O, respectively, showing dark green, green, yellow-green, yellow, dark yellow, orange-red and red colors (see the inset photos in Fig. 2b–h). In general, the emission peaks shifted to red as the solvent polarity increased. This solvent-dependent phenomenon is very similar to the “solvatochromism” in organic dyes. Many organic dyes’ fluorescence emissions shift in different solvents. The solvatochromic effect is usually attributed to the intramolecular charge transfer.28–30 This effect is common for organic dyes, but is rarely known in CDs. In contrast to the existing reported CDs with solvent-dependent properties,24,26 our CDs exhibited a much broader color tunable range of 511–615 nm. Furthermore, it can be clearly seen from Fig. 2b–h that the fluorescence emission bands of CDs in any solvent do not shift with different excitation wavelengths. This strict excitation wavelength independence is distinctive in our CDs. It gives the easy handling and design of multicolor applications, and the existing use of traditional quantum dots (such as Cd chalcogenides) can be easily switched to CDs31,32 to reduce the synthesis complexity and production cost, and to eliminate the biological and ecological toxicity (from the heavy metals of Cd, Cu, Pb, etc.).33,34
Fig. 2.
The photoluminescence spectra of the same CDs in 7 solvents excited by 420 nm light (a), and the photoluminescence spectra of the same CDs excited by different wavelength lights in solvents of CCl4 (b), toluene (c), CHCl3 (d), acetone (e), DMF (f), CH3OH (g), and H2O (h). The UV-vis absorption spectra (350–800 nm) of the same CDs in the 7 solvents (i).
The UV absorption spectra were measured for the CDs in different solvents (Fig. S3†). In the high-energy region (200–350 nm) of all the spectra, the same peak was observed at 280 nm, corresponding to the π–π* transitions of C═C and C═N bonds. The fluorescence visible emission of CDs in different solvents clearly originated from the absorption in the lower-energy region (350–800 nm). In the lower-energy region (Fig. S3† and more details in Fig. 2i), the spectra exhibit distinct absorption bands at 448, 461, 464, 471, 478, 500, and 488 nm indicating that the CDs possess different energy gaps in different solvents. As the solvent polarity increased, the absorption wavelength exhibited a red shift except in water. The inconsistency in water could be resulting from the poor solubility and therefore the aggregation of CDs.
The QYs of the CDs in different solvents were measured and are listed in Table S1.† It can be seen that the CDs have good QYs in all the seven solvents. The CDs exhibited the highest QY of 34.5% in CHCl3 for the green emission color but a lower QY (9.2%) in water (red); the latter is due to the poor water solubility of the CDs. In water, the CDs were kind of aggregated and the fluorescence was thus greatly quenched because of the excessive resonance energy transfer or π–π interactions.35–38
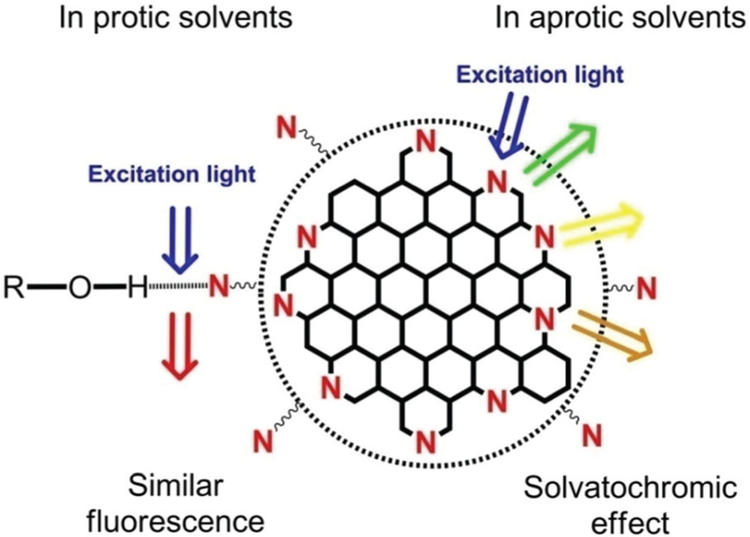
This solvent-dependent photoluminescence is regarded as a dipole induced surface electronic state change. According to the FTIR and XPS data, our CDs have high nitrogen and oxygen compositions (27.33% + 10.85%) and abundant oxygen and nitrogen-containing sub-structures like hydroxyl and amine on the surface of CDs. Besides, many nitrogen atoms are bonded to the edge of the sp2-hybridized carbon core in pyridinic and pyrrolic forms. These oxygen and nitrogen substructures increase the charge carrier density and induce the charge transfer of electrons towards the edge (Fig. 3). Like organic dyes, the stable excited states of such a structure on the CD surface are strongly influenced by the dipole moment of the solvents.29,30 In aprotic solvents, as the solvent polarity increases, the dipole moment affects the surface electronic structure more. Then it reduces the energy gap and results in the red shift of the fluorescence emission wavelength. Therefore, this is the reason for the solvatochromic effect in these aprotic solvents.39 The fluorescence lifetimes of CDs in different aprotic solvents were measured to further support our hypothesis. As summarized in Table S2,† the fluorescence average lifetimes of CDs in solvents firstly increased and then decreased. The tendency is similar to that of QYs.
Fig. 3.
The illustration of the possible emission processes of the CDs in different solvents. Other types of hydrogen bonds (e.g., CD–N–H…O, CD–O–H…O) were omitted for clarity.
For organic dyes with a solvatochromic effect, they usually show very weak fluorescence in CH3OH because of the high solvent polarity. However, our CDs exhibited a nice orange-red emission in CH3OH (QY 24.8%) which was stronger than those in acetone and DMF. The fluorescent properties of CDs in several other alcohol solvents were thus further investigated. The CDs were dissolved in methanol, ethanol, benzyl alcohol, 1-hexanol and 1-octanol with successively decreased polarities. The CDs exhibited excellent solubility in all these alcohol solvents and very similar fluorescence spectra (Fig. S4a†). All the emission peaks were very close with slight variations from 598 to 602 nm (Table S3†). The fluorescence emission bands of CDs in any of the alcohol solvents also did not shift with different excitation wavelengths, i.e. they were excitation wavelength independent (Fig. 2g for CH3OH and Fig. S5† for others). Besides, the absorption spectra showed similar profiles for all the alcohol solvents (Fig. S4b†). The absorption peaks in the low-energy region slightly changed (from 496 to 500 nm).
The polarities of these five alcohol solvents are very different. However, the CDs in these solvents had almost the same absorption and photoluminescence spectra. According to these results, it can be inferred that the absorption and photoluminescence of CDs in alcohol solvents are dominated by the −OH groups rather than the solvent polarity. In alcohol solvents, the nitrogen and oxygen atoms on the CD surface can form strong hydrogen bonds to alcohol molecules, which leads to the stabilization of the excited state,28,29 and eventually the very similar strong orange-red emission in all the alcohol solvents (Fig. 3). This conclusion was also supported by the fluorescence decay measurements (Table S4†). The CDs showed similar fluorescence lifetimes in the alcohol solvents which indicated the same fluorescence centers and mechanism. Besides, the QYs of the CDs were measured to be at the 30% level from 24.8% to 34.7% (Table S3†). As the alcohol solvent polarity decreased, the QY of CDs increased which is similar to an organic dye’s behavior. The QY was 34.7% in 1-octanol, which is among the highest values in the reported orange-red emission CDs. In the light of this unique property, our CDs may become a good fluorescent probe for the detection of compounds with hydroxyl groups.
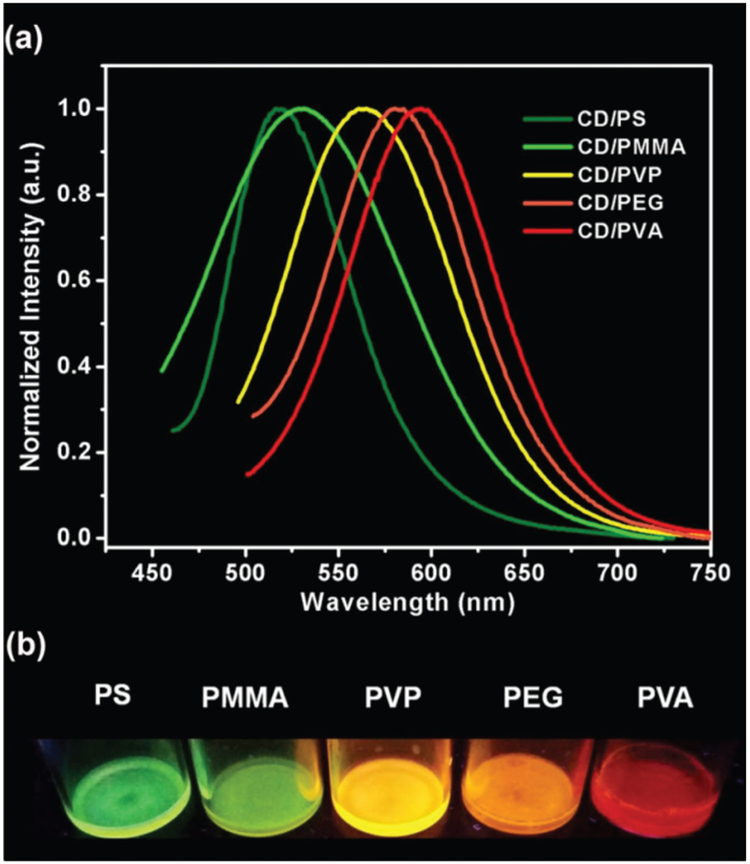
Based on the experimental observation and our hypothesis, we further tried to make solid CD emission materials with different colors as they did in solvents. Five polymers were chosen to make solid CD/polymer composites: polystyrene (PS), poly(methyl methacrylate) (PMMA), poly(vinyl pyrrolidone) (PVP), poly(ethylene glycol) (PEG), and poly(vinyl alcohol) (PVA). They were chosen based on the groups which were similar to the above-mentioned solvents. As shown in Fig. 4a and Table S5,† the emission peaks of the CD/polymer films were 518, 531, 564, 580, and 594 nm with PS, PMMA, PVP, PEG, and PVA, respectively. All the five CD/polymer films exhibited strong photoluminescence lights from dark green to red (Fig. 4b). To our knowledge, this is the first report that the same CDs emit different colors when mixed with different polymers (solid state) under one single excitation wavelength. For each composite, the emission peak did not change when excited by different excitation lights, i.e., strict excitation wave-length independent emissions as happened in solutions (Fig. S6†). The mechanism of the color-tuning in different polymers is the same as that occurred in different solvents. The polymers around the CD particles exert similar interactions as the surface of the CDs and therefore change their surface electronic structures. Based on the large number of commercially available polymers and new polymers which are constantly designed and synthesized in the labs, CDs have great potential to make various solid phosphors for many sorts of applications.
Fig. 4.
The photoluminescence spectra of five CD/polymer films excited at 420 nm (a) and the corresponding photos of excited five CD/polymer films (b).
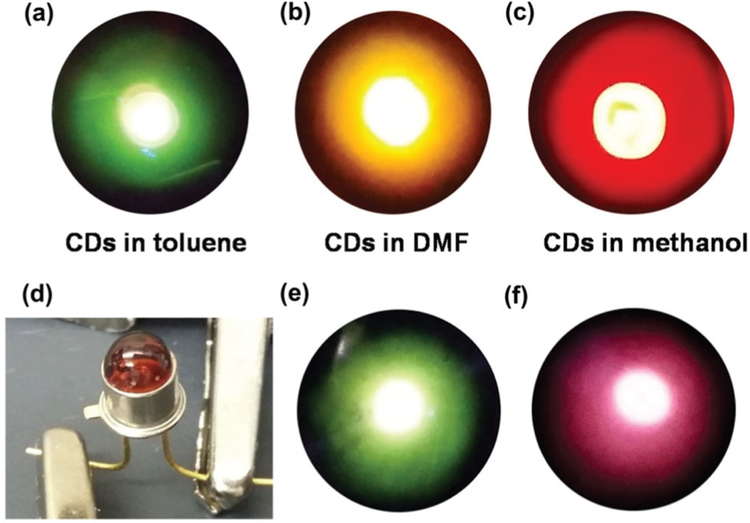
According to the unique optical properties described above, the CDs were employed to prepare LEDs for various color emissions. Liquid LEDs and solid LEDs were both fabricated. For the preparation of liquid LEDs, a CD solution was sealed in a flat silica glass box and packed above a UV-LED chip (370 nm emission). Three kinds of CD solutions (CDs in toluene, DMF and methanol) were respectively sealed into the silica glass boxes. As shown in Fig. 5a–c, these liquid-form devices showed nice emission colors of green, yellow and red, respectively. In the preparation of solid LEDs, a CD/polymer solution (CD/PMMA in CH2Cl2, and CD/PVA in water) was carefully dropped on a UV-LED chip (370 nm emission) and dried under vacuum. This operation was repeated multiple times until a required uniform coating (shape and thickness) was obtained. As shown in Fig. 5e and f, the two solid LEDs emitted good green and red colors from CD/PMMA and CD/PVA, respectively.
Fig. 5.
True color photographs of CD-LEDs: emissions of liquid LEDs of CDs in toluene (a), DMF (b), and methanol (c); solid LEDs of CD/polymer under room light (d) and the emissions of CD/PMMA (e) and CD/PVA (f).
Conclusions
In summary, we reported an approach to the synthesis of CDs with bright multicolor fluorescence emissions which are strictly excitation wavelength independent. The synthesis and purification of our CDs were simple with a high yield which could easily achieve large scale production. The CDs exhibited different fluorescence emission colors from dark green to red when they were dispersed in different media, both in liquid (solvents) and solid (polymers) states. In all the surroundings, the CDs exhibited strong fluorescence emissions and a particular 34.7% QY for the 602 nm emission. To our knowledge, this is the first report on CDs displaying completely excitation wavelength independent broad long wavelength emissions, and all colors can be achieved from one type of CD particles. The multicolor liquid and solid CD-LEDs based on the same CD particles demonstrated promising application potentials.
Supplementary Material
Acknowledgements
We appreciate the financial support from the NSFC (51272084, 61225018, 61475062), the NSF (1338346, 1130468), the BORSF RCS/SURE/Endowed Professor programs, and the LBRN.
Footnotes
Electronic supplementary information (ESI) available. See DOI: 10.1039/c6nr09200d
References
- 1.Lim SY, Shen W and Gao Z, Carbon quantum dots and their applications, Chem. Soc. Rev, 2015, 44(1), 362–381. [DOI] [PubMed] [Google Scholar]
- 2.Ding C, Zhu A and Tian Y, Functional surface engineering of C-dots for fluorescent biosensing and in vivo bioimaging, Acc. Chem. Res, 2013, 47(1), 20–30. [DOI] [PubMed] [Google Scholar]
- 3.Zhu S, Song Y, Zhao X, Shao J, Zhang J and Yang B, The photoluminescence mechanism in carbon dots (graphene quantum dots, carbon nanodots, and polymer dots): current state and future perspective, Nano Res, 2015, 8(2), 355–381. [Google Scholar]
- 4.Hola K, Zhang Y, Wang Y, Giannelis EP, Zboril R and Rogach AL, Carbon dots—Emerging light emitters for bioimaging, cancer therapy and optoelectronics, Nano Today, 2014, 9(5), 590–603. [Google Scholar]
- 5.Zhu S, Meng Q, Wang L, Zhang J, Song Y, Jin H, Zhang K, Sun H, Wang H and Yang B, Highly photoluminescent carbon dots for multicolor patterning, sensors, and bioimaging, Angew. Chem., Int. Ed, 2013, 52(14), 3953–3957. [DOI] [PubMed] [Google Scholar]
- 6.Tang J, Zhang Y, Kong B, Wang Y, Da P, Li J, Elzatahry AA, Zhao D, Gong X and Zheng G, Solardriven photoelectrochemical probing of nanodot/nanowire/cell interface, Nano Lett, 2014, 14(5), 2702–2708. [DOI] [PubMed] [Google Scholar]
- 7.Yang S-T, Cao L, Luo PG, Lu F, Wang X, Wang H, Meziani MJ, Liu Y, Qi G and Sun Y-P, Carbon dots for optical imaging in vivo, J. Am. Chem. Soc, 2009, 131(32), 11308–11309. [DOI] [PMC free article] [PubMed] [Google Scholar]
- 8.Chizhik AM, Stein S, Dekaliuk MO, Battle C, Li W, Huss A, Platen M, Schaap IA, Gregor I and Demchenko AP, Super-Resolution Optical Fluctuation Bio-Imaging with Dual-Color Carbon Nanodots, Nano Lett, 2016, 16(1), 237–242. [DOI] [PubMed] [Google Scholar]
- 9.Zhang X, Zhang Y, Wang Y, Kalytchuk S, Kershaw SV, Wang Y, Wang P, Zhang T, Zhao Y, Zhang H, Cui T, Wang Y, Zhao J, Yu WW and Rogach AL, Color-switchable electroluminescence of carbon dot light-emitting diodes, ACS Nano, 2013, 7(12), 11234–11241. [DOI] [PubMed] [Google Scholar]
- 10.Sun Y-P, Zhou B, Lin Y, Wang W, Fernando KS, Pathak P, Meziani MJ, Harruff BA, Wang X and Wang H, Quantum-sized carbon dots for bright and colorful photoluminescence, J. Am. Chem. Soc, 2006, 128(24), 7756–7757. [DOI] [PubMed] [Google Scholar]
- 11.Qu S, Zhou D, Li D, Ji W, Jing P, Han D, Liu L, Zeng H and Shen D, Toward Efficient Orange Emissive Carbon Nanodots through Conjugated sp2-Domain Controlling and Surface Charges Engineering, Adv. Mater, 2016, 28(18), 3516–3521. [DOI] [PubMed] [Google Scholar]
- 12.Stich MI, Schaeferling M and Wolfbeis OS, Multicolor Fluorescent and Permeation-Selective Microbeads Enable Simultaneous Sensing of pH, Oxygen, and Temperature, Adv. Mater, 2009, 21(21), 2216–2220. [Google Scholar]
- 13.Tao Y, Yang C and Qin J, Organic host materials for phosphorescent organic light-emitting diodes, Chem. Soc. Rev, 2011, 40(5), 2943–2970. [DOI] [PubMed] [Google Scholar]
- 14.Tetsuka H, Asahi R, Nagoya A, Okamoto K, Tajima I, Ohta R and Okamoto A, Optically Tunable Amino-Functionalized Graphene Quantum Dots, Adv. Mater, 2012, 24(39), 5333–5338. [DOI] [PubMed] [Google Scholar]
- 15.Ding H, Yu S-B, Wei J-S and Xiong H-M, Full-Color Light-Emitting Carbon Dots with a Surface-State-Controlled Luminescence Mechanism, ACS Nano, 2016, 10(1), 484–491. [DOI] [PubMed] [Google Scholar]
- 16.Qu S, Wang X, Lu Q, Liu X and Wang L, A Biocompatible Fluorescent Ink Based on Water-Soluble Luminescent Carbon Nanodots, Angew. Chem., Int. Ed, 2012, 51(49), 12215–12218. [DOI] [PubMed] [Google Scholar]
- 17.Dong Y, Pang H, Yang HB, Guo C, Shao J, Chi Y, Li CM and Yu T, Carbon-Based Dots Co-doped with Nitrogen and Sulfur for High Quantum Yield and Excitation-Independent Emission, Angew. Chem., Int. Ed, 2013, 52(30), 7800–7804. [DOI] [PubMed] [Google Scholar]
- 18.Sun C, Zhang Y, Kalytchuk S, Wang Y, Zhang X, Gao W, Zhao J, Cepe K, Zboril R, Yu WW and Rogach AL, Down-conversion monochromatic light-emitting diodes with the color determined by the active layer thickness and concentration of carbon dots, J. Mater. Chem. C, 2015, 3(26), 6613–6615. [Google Scholar]
- 19.Wang Y, Kalytchuk S, Zhang Y, Shi H, Kershaw SV and Rogach AL, Thickness-dependent full-color emission tunability in a flexible carbon dot ionogel, J. Phys. Chem. Lett, 2014, 5(8), 1412–1420. [DOI] [PubMed] [Google Scholar]
- 20.Pan L, Sun S, Zhang A, Jiang K, Zhang L, Dong C, Huang Q, Wu A and Lin H, Truly Fluorescent Excitation-Dependent Carbon Dots and Their Applications in Multicolor Cellular Imaging and Multidimensional Sensing, Adv. Mater, 2015, 27(47), 7782–7787. [DOI] [PubMed] [Google Scholar]
- 21.Hu S, Trinchi A, Atkin P and Cole I, Tunable photoluminescence across the entire visible spectrum from carbon dots excited by white light, Angew. Chem., Int. Ed, 2015, 54(10), 2970–2974. [DOI] [PubMed] [Google Scholar]
- 22.Bao L, Liu C, Zhang ZL and Pang DW, Photoluminescence-Tunable Carbon Nanodots: Surface-State Energy-Gap Tuning, Adv. Mater, 2015, 27(10), 1663–1667. [DOI] [PubMed] [Google Scholar]
- 23.Jiang K, Sun S, Zhang L, Lu Y, Wu A, Cai C and Lin H, Red, Green, and Blue Luminescence by Carbon Dots: Full-Color Emission Tuning and Multicolor Cellular Imaging, Angew. Chem., Int. Ed, 2015, 54(18), 5360–5363. [DOI] [PubMed] [Google Scholar]
- 24.Pan D, Zhang J, Li Z, Wu C, Yan X and Wu M, Observation of pH-, solvent-, spin-, and excitation-dependent blue photoluminescence from carbon nanoparticles, Chem. Commun, 2010, 46(21), 3681–3683. [DOI] [PubMed] [Google Scholar]
- 25.Jiang K, Zhang L, Lu J, Xu C, Cai C and Lin H, Triple-Mode Emission of Carbon Dots: Applications for Advanced Anti-Counterfeiting, Angew. Chem., Int. Ed, 2016, 55(25), 7231–7235. [DOI] [PubMed] [Google Scholar]
- 26.Zhu S, Zhang J, Qiao C, Tang S, Li Y, Yuan W, Li B, Tian L, Liu F and Hu R, Strongly green-photoluminescent graphene quantum dots for bioimaging applications, Chem. Commun, 2011, 47(24), 6858–6860. [DOI] [PubMed] [Google Scholar]
- 27.Tang L, Ji R, Li X, Bai G, Liu CP, Hao J, Lin J, Jiang H, Teng KS and Yang Z, Deep ultraviolet to nearinfrared emission and photoresponse in layered n-doped graphene quantum dots, ACS Nano, 2014, 8(6), 6312–6320. [DOI] [PubMed] [Google Scholar]
- 28.Dong J, Solntsev KM and Tolbert LM, Solvatochromism of the green fluorescence protein chromophore and its derivatives, J. Am. Chem. Soc, 2006, 128(37), 12038–12039. [DOI] [PubMed] [Google Scholar]
- 29.Terenziani F, Painelli A, Katan C, Charlot M and Blanchard-Desce M, Charge instability in quadrupolar chromophores: Symmetry breaking and solvatochromism, J. Am. Chem. Soc, 2006, 128(49), 15742–15755. [DOI] [PubMed] [Google Scholar]
- 30.Lekha P and Prasad E, Tunable Emission of Static Excimer in a Pyrene-Modified Polyamidoamine Dendrimer Aggregate through Positive Solvatochromism, Chem. – Eur. J, 2011, 17(31), 8609–8617. [DOI] [PubMed] [Google Scholar]
- 31.Sun C, Zhang Y, Sun K, Reckmeier C, Zhang T, Zhang X, Zhao J, Wu C, Yu WW and Rogach AL, Combination of carbon dot and polymer dot phosphors for white light-emitting diodes, Nanoscale, 2015, 7(28), 12045–12050. [DOI] [PubMed] [Google Scholar]
- 32.Sun C, Zhang Y, Wang Y, Liu W, Kalytchuk S, Kershaw SV, Zhang T, Zhang X, Zhao J, Yu WW and Rogach AL, High color rendering index white light emitting diodes fabricated from a combination of carbon dots and zinc copper indium sulfide quantum dots, Appl. Phys. Lett, 2014, 104(26), 261106. [Google Scholar]
- 33.Chang E, Thekkek N, Yu WW, Colvin VL and Drezek R, Evaluation of quantum dot cytotoxicity based on intracellular uptake, Small, 2006, 2(12), 1412–1417. [DOI] [PubMed] [Google Scholar]
- 34.Yu WW, Semiconductor quantum dots: synthesis and water-solubilization for biomedical applications, Expert Opin. Biol. Ther, 2008, 8(10), 1571–1581. [DOI] [PubMed] [Google Scholar]
- 35.Zhelev Z, Ohba H and Bakalova R, Single quantum dotmicelles coated with silica shell as potentially non-cytotoxic fluorescent cell tracers, J. Am. Chem. Soc, 2006, 128(19), 6324–6325. [DOI] [PubMed] [Google Scholar]
- 36.Bakalova R, Zhelev Z, Aoki I, Ohba H, Imai Y and Kanno I, Silica-shelled single quantum dot micelles as imaging probes with dual or multimodality, Anal. Chem, 2006, 78(16), 5925–5932. [DOI] [PubMed] [Google Scholar]
- 37.Hong Y, Lam JW and Tang BZ, Aggregation-induced emission, Chem. Soc. Rev, 2011, 40(11), 5361–5388. [DOI] [PubMed] [Google Scholar]
- 38.Chen Y, Zheng M, Xiao Y, Dong H, Zhang H, Zhuang J, Hu H, Lei B and Liu Y, A Self-Quenching-Resistant Carbon-Dot Powder with Tunable Solid-State Fluorescence and Construction of Dual-Fluorescence Morphologies for White Light-Emission, Adv. Mater, 2016, 28(2), 312–318. [DOI] [PubMed] [Google Scholar]
- 39.Reckmeier CJ, Wang Y, Zboril R and Rogach AL, Influence of Doping and Temperature on Solvatochromic Shifts in Optical Spectra of Carbon Dots, J. Phys. Chem. C, 2016, 120(19), 10591–10604. [Google Scholar]
Associated Data
This section collects any data citations, data availability statements, or supplementary materials included in this article.


