

Summary
BioJupies is a web application that enables automated creation, storage, and deployment of Jupyter Notebooks containing RNA-seq data analyses. Through an intuitive interface, novice users can rapidly generate tailored reports to analyze and visualize their own raw sequencing files, gene expression tables, or fetch data from >8,000 published studies containing >300,000 preprocessed RNA-seq samples. Generated notebooks have executable code of the entire pipeline, rich narrative text, interactive data visualizations, differential expression, and enrichment analyses. The notebooks are permanently stored in the cloud and made available online through a persistent URL. The notebooks are downloadable, customizable, and can run within a Docker container. By providing an intuitive user interface for notebook generation for RNA-seq data analysis, starting from the raw reads, all the way to a complete interactive and reproducible report, BioJupies is a useful resource for experimental and computational biologists. BioJupies is freely available as a web-based application from: http://biojupies.cloud.
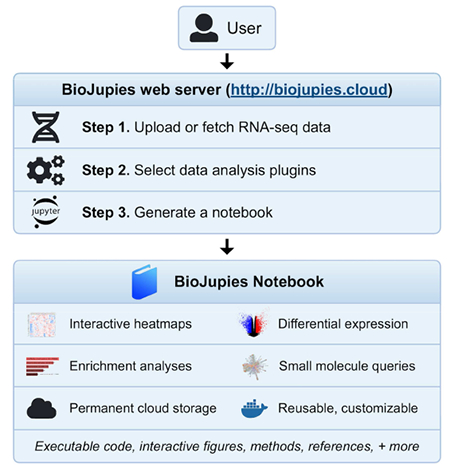
Graphical Abstract
In Brief
Interactive notebooks can make bioinformatics data analyses more transparent, accessible, and reusable. However, creating notebooks requires computer programming expertise. BioJupies is a web application that enables automated generation of Jupyter Notebooks reports containing complete and comprehensive RNA-seq data analysis. Through an intuitive interface, users are guided through the steps of analysis starting from uploading their raw sequencing files, to gene expression tables, to selecting tools, parameters and visualization options, to generating the Jupyter Notebook. Generated notebooks have executable and customizable code of the entire pipeline, rich narrative text, interactive data visualizations, and are permanently hosted in the cloud. BioJupies is freely available at http://biojupies.cloud.
Introduction
RNA-sequencing (Wang et al., 2009) is a widely applied experimental method to study the biological molecular mechanisms of cells and tissues in human and model organisms. Currently, experimental biologists that perform RNA-seq experiments are experiencing a bottleneck. The raw read FASTQ files, which are relatively large (>1 GB), need to be first aligned to the reference genome before they can be further analyzed and visualized to gain biological insights. The alignment step is challenging because it is computationally demanding, typically requiring specialized hardware and software. Recently, we have developed a cost effective cloud-based alignment pipeline that enabled us to align >300,000 publicly available RNA-seq samples from the Sequence Read Archive (SRA) (Lachmann et al., 2018). Here, we describe a service that enables users to upload their own FASTQ files, and then obtain an interactive report with complete analysis of their data delivered as a Jupyter Notebook (Kluyver et al., 2016).
Inspired by the paradigm of literate programming (Knuth, 1984), data analysis interactive notebook environments such as Jupyter Notebooks, R-markdown (Baumer et al., 2014), knitr (Xie, 2014), Observable (https://beta.observablehq.com). or Zeppelin (https://zeppelin.apache.org) have been rapidly gaining traction in computational biomedical research and other data intensive scientific fields. The concept of an interactive notebook is not new. Computing software platforms such as MATLAB and Mathematica deployed notebook style analysis pipelines for many years. However, the availability of open-source and free interactive notebooks that can run and execute in any browser make these new notebook technologies transformative.
Interactive notebooks enable the generation of executable documents that contain source code, data analyses and visualizations, and rich narrative markup text. By combining all the necessary information to rerun data analysis pipelines, and by producing reports that enable rapid interpretation of experimental results, interactive notebooks can be considered a new form of publication. Hence, interactive notebooks can transform how experimental results are exchanged in biomedical research. In this direction, several academic journals now support the Jupyter Notebook as a legitimate component of a publication, for example, the journal F1000 Research (Wang and Ma’ayan, 2016), or as an acceptable format type to submit articles, for example, the journal Data Science (Kuhn and Dumontier, 2017). However, generating interactive notebooks requires high level of computer programming expertise which is uncommon among experimental biologists.
The analysis of RNA-sequencing data, and the processing of large datasets produced by other omics technologies, typically requires the chaining of several bioinformatics tools into a computational pipeline. In the pipeline, the output of one tool serves as the input to the next tool. In order to enable experimental biologists to execute bioinformatics pipelines, including those developed to process and analyze RNA-seq data, several platforms have been developed, for example, GenomeSpace (Qu et al., 2016), Galaxy (Goecks et al., 2010), and GenePattern (Reich et al., 2006). These software platforms provide access to workflows that can run on scalable computing resources through a web interface. Hence, users with limited computational expertise can launch computationally intensive data analysis jobs with these platforms. Galaxy and GenePattern have recently integrated Jupyter (Grüning et al., 2017; Reich et al., 2017).
In addition to these platforms, several interactive web applications for analysis of RNA-seq data have been developed. Most of these platforms are implemented with the R Shiny toolkit (Chang et al., 2015). Instead of relying on the integration of external computational tools, these R Shiny applications analyze uploaded data by executing R code on the server side, and then displaying the results directly in the browser. Examples of such applications include iDEP (Ge, 2017), START (Nelson et al., 2017), VisRseq (Younesy et al., 2015), ASAP (Gardeux et al., 2017), DEApp (Li and Andrade, 2017), and IRIS-DGE (Monier et al., 2018). However, none of these tools currently allow for the automated generation of reusable and publishable reports that contain research narratives in a single interactive notebook. In addition, these platforms do not provide users with the ability to upload the raw sequencing files for processing in the cloud.
BioJupies is a web-based server application that automatically generates customized Jupyter Notebooks for analysis of RNA-seq data. BioJupies allows users to rapidly generate tailored, reusable reports from their raw or processed sequencing data, as well as fetch RNA-seq data from >8,000 studies that contain >300,000 RNA-seq samples published in the Gene Expression Omnibus (GEO) (Edgar et al., 2002). To enable such fetching, we preprocessed all the human and mouse samples profiled by the major sequencing platforms by aligning them to the reference genome via the ARCHS4 cloud computing architecture (Lachmann et al., 2018). Most importantly, BioJupies enables users to upload their own FASTQ files for processing and downstream analysis in the cloud. BioJupies is freely available from http://biojupies.cloud. BioJupies is open source and available for forking on GitHub at https://github.com/MaayanLab/biojupies. In addition, tool developers can contribute plug-in analysis and visualization tools to enhance BioJupies. More details are provided below in the Results, Discussion and STAR Methods.
Results
The BioJupies website
The BioJupies website enables users to generate customized, interactive Jupyter Notebooks containing analyses of RNA-seq data through an intuitive user interface (Table S1, Video 1). The notebooks contain executable Python and R code, interactive visualizations, and rich annotations that provide detailed explanations of the results. The notebooks also provide details and references about the methods used to perform the analyses. The notebooks are made available to users through a permanent and sharable URL. The automatically generated notebooks can be downloaded and modified on the user’s local computer through the execution of a Docker image that contains all the data, tools and source code needed to rerun analyses (for more information, see Results - Reusing Notebooks).
The process of notebook generation consists of three steps. First, the user selects the data they wish to analyze through a web interface. Users can either upload their own raw or processed RNA-seq data (Table S1, Videos 2 and 3), or select from over 8,000 ready-to-analyze datasets published in GEO and processed by ARCHS4 (Table S1, Video 4). Next, the user selects from an array of computational plug-ins to analyze the data (Table S1, Video 5). Finally, the user can customize the notebook by modifying optional parameters, changing the notebook’s title, and adding metadata tags from resources such as the Disease Ontology (Kibbe et al., 2014), the Drug Ontology (Hanna et al., 2013), and the Uberon-anatomy Ontology (Haendel et al., 2009). Once this process is complete, a notebook generation job is launched by the BioJupies notebook generator server. The BioJupies notebook generator creates and executes a Jupyter Notebook file with the uploaded, or fetched, dataset and selected plug-ins. When the process is completed, the generated notebook is made available through a persistent URL (Table S1, Video 6). Generated notebooks are permanently stored in the cloud and can be accessed at any time in the future through the same URL. If the user approves, the persistent URL is made publicly and automatically available on the Datasets2Tools repository (Torre et al., 2018). A schematic representation of the entire BioJupies workflow shows how the various components of BioJupies come together (Fig. 1).
Fig. 1. Schematic illustration of the BioJupies notebook generation workflow.
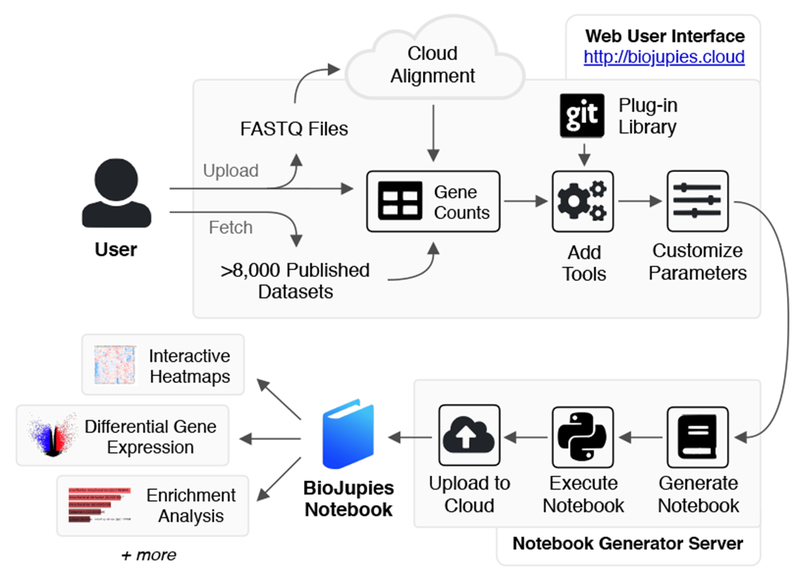
The user starts by uploading RNA-seq data to the BioJupies website (http://biojupies.cloud), or by selecting from thousands of publicly available datasets. If raw FASTQ files are provided, expression levels for each gene are quantified using a cloud-based quantification pipeline. The user subsequently selects the tools and parameters to apply to analyze the data. Finally, a server generates a Jupyter Notebook with the desired settings and returns a report to the user through a persistent URL. See also Figure S1.
Uploading RNA-seq Data
BioJupies enables the generation of Jupyter Notebooks from RNA-seq data in both raw and processed forms. In case of processed RNA-seq data, the user uploads numeric gene counts in a tabular format (Table S1, Video 3). This can be an Excel spreadsheet or a comma-separated text file containing gene symbols as row names, samples as the column names, and gene counts as values. In addition, metadata that describes the samples can be uploaded in a separate Excel spreadsheet, or a comma-separated text file. A detailed explanation of the format to upload the data, including links to download example datasets, is provided on the BioJupies website’s help section (https://amp.pharm.mssm.edu/biojupies/help#uploading_gene_counts). In the case of raw RNA-seq data, the user is provided with a user interface that enables them to upload FASTQ files through an HTML form (Table S1, Video 2). The user is required to specify the organism, and whether the RNA-seq data was generated using single-end or paired-end sequencing. Once this information is collected, gene expression levels for each gene are quantified by launching parallel jobs in the cloud using the kallisto pseudoaligner (Bray et al., 2016). We have benchmarked kallisto with other aligners and found it to produce comparable count accuracy at a significant lower cost (Lachmann et al., 2018). Specifically, we benchmarked Kallisto STAR (Dobin et al., 2013) for the ability to detect genes and predict Gene Ontology terms using co-expression matrices (Lachmann et al., 2018). Once the quantification step is complete, which may take up to 15 minutes, sample counts are merged to generate a gene count matrix. From that point on, the user follows the same steps to generate notebooks as with processed uploaded data (gene counts matrix), by adding sample metadata and selecting the analysis tools they wish to employ (Table S1, Video 5).
Analyzing Published Datasets
In addition to allowing analysis of user-submitted data, BioJupies provides direct access to data from >8,000 published GEO studies (Table S1, Video 4). These studies contain >300,000 processed samples from human or mouse, profiled across hundreds of different tissue types, cell lines and biological conditions. The BioJupies website enables users to fetch the data into BioJupies from these studies using a search engine that supports text-based queries. The search engine has filters, for example, by specifying a range of number of samples per study, filtering by organism, and filtering by a publication date range. The datasets available for fetching are updated regularly as more studies are published in GEO.
The BioJupies Plug-in Library
All the source code that is used to analyze the RNA-seq data and generate the plots is available on GitHub at a public repository: https://github.com/MaayanLab/biojupies-plugins. Currently, the BioJupies plug-in library consists of 14 computational plug-ins subdivided into four categories: exploratory data analysis, differential expression analysis, enrichment analysis, and small molecule query (Table 1). These plug-ins analyze the data and display interactive visualizations such as three-dimensional scatter plots, bar charts, and clustered heat maps with enrichment analysis features (Table S1, Video 6). The modular design of BioJupies provides the mechanism needed for other bioinformatics tool developers to integrate their tools. Suggestions for plug-ins can be submitted through the BioJupies-plugins GitHub repository (https://github.com/MaayanLab/biojupies-plugins). which contains step-by-step instructions and guidelines for how to make a contribution.
Table 1. List of the RNA-seq data analysis plug-ins available within BioJupies.
The initial BioJupies toolbox includes 14 plug-ins for the analysis of RNA-seq data, divided into four categories.
| Tool Name | Description | References |
|---|---|---|
| PCA | Linear dimensionality reduction technique to visualize similarity between samples | (Pedregosa et al., 2011), (https://plot.ly) |
| Clustergrammer | Interactive hierarchically clustered heat map | (Fernandez et al., 2017) |
| Library Size Analysis | Analysis of readcount distribution for the samples within the dataset | (https://plot.ly) |
| Differential Expression Table | Differential expression analysis between two groups of samples | (Ritchie et al., 2015) (Clark et al., 2014) |
| Volcano Plot | Plot the logFC and -log10P values resulting from a differential expression analysis | (Ritchie et al., 2015) (Clark et al., 2014), (https://plot.ly) |
| MA Plot | Plot the logFC and average expression values resulting from a differential expression analysis | (Ritchie et al., 2015) (Clark et al., 2014), (https://plot.ly) |
| Enrichr Links | Links to enrichment analysis results of the differentially expressed genes via Enrichr | (Kuleshov et al., 2016) |
| Gene Ontology Enrichment Analysis | Gene Ontology terms enriched in the differentially expressed genes (via Enrichr) | (Kuleshov et al., 2016) (Ashburner et al., 2000), (https://plot.ly) |
| Pathway Enrichment Analysis | Biological pathways enriched in the differentially expressed genes (via Enrichr) | (Kuleshov et al., 2016) (Kanehisa et al., 2017) (Slenter et al., 2018), (Croft et al., 2014) (https://plot.ly) |
| Transcription Factor Enrichment Analysis | Transcription factors whose targets are enriched in the differentially expressed genes (via Enrichr) | (Kuleshov et al., 2016) (Lachmann et al., 2010) (Lachmann et al., 2018) |
| Kinase Enrichment Analysis | Protein kinases whose substrates are enriched in the differentially expressed genes (via Enrichr) | (Kuleshov et al., 2016) (Lachmann and Ma’ayan, 2009) (Lachmann et al., 2018) |
| miRNA Enrichment Analysis | miRNAs whose targets are enriched in the differentially expressed genes (via Enrichr) | (Kuleshov et al., 2016) (Chou et al., 2018) (Agarwal et al., 2015) |
| L1000CDS2 Query | Small molecules which mimic or reverse a given differential gene expression signature | (Duan et al., 2016) (https://plot.ly) |
| L1000FWD Query | Small molecules which mimic or reverse a given differential gene expression signature | (Wang et al., 2018) |
Reusing Notebooks
All Jupyter Notebooks generated using BioJupies can be downloaded and rerun on the user’s local computers. This feature enables experienced computational users to customize their analyses by modifying the existing pipeline, adding their own code to the notebook. To guarantee reusability, a Docker image (Merkel, 2014) is constructed. The Docker image contains a Jupyter Server, and all the software packages and code necessary to rerun the full analysis pipeline contained within a notebook. Alternatively, users may install all the required dependencies on their local environment and rerun notebooks from their own Jupyter Server without using the Docker container. A step-by-step tutorial on reusing notebooks is available from the BioJupies website (https://amp.pharm.mssm.edu/biojupies/docker), and in Table S1, Video 7.
The BioJupies Chrome Extension
BioJupies is also provided as a Chrome extension. The Chrome extension is freely available from the Chrome Web Store at: https://chrome.google.com/webstore/detail/biojupies-generator/picalhhlpcjhonibabfigihelpmpadel?hl=en-US. The extension adds functionality to the GEO DataSet browser (https://www.ncbi.nlm.nih.gov/gds) by embedding buttons near returned search results. Clicking these buttons evokes a user interface that enable users to automatically generate notebooks directly from the GEO website. By clicking on the embedded button, a popup window is triggered to provide an interactive interface to capture the settings to generate the Jupyter Notebook directly from the selected GEO dataset. Buttons are only displayed on a subset of returned results. These are the >8,000 RNA-seq datasets which have been pre-processed by the ARCHS4 resource (Lachmann et al., 2018). The BioJupies Chrome extension entry forms follow the same content as in the BioJupies website. The BioJupies Chrome extension launches a notebook generation job and displays the permanent link to the user once the process is completed (Table S1, Video 8).
Discussion
The automated generation of Jupyter Notebooks for RNA-seq data analysis lowers the point-of-entry for researchers with no programming background. With BioJupies users can rapidly extract knowledge from their own RNA-seq data, or from already published studies. Furthermore, the notebooks generated can be easily shared with collaborators, rerun and customized using Docker containers to further refine the analysis. This makes it attractive to both experimentalists and programmers. All notebooks generated using BioJupies are made available through a permanent and public URL. While BioJupies currently does not support private accounts, such functionality is expected to be added in the future, including user authentication and including integration with dbGAP (Mailman et al., 2007). This will allow users to create password-protected accounts to securely and privately store their data and generated notebooks.
BioJupies employs a scalable and cost-effective pipeline that is based on the work done for creating the ARCHS4 resource (Lachmann et al., 2018). We use the kallisto pseudoaligner (Bray et al., 2016) which is significantly faster and requires less memory compared with other popular aligners. Through this process, and other optimizations such as parallelization of the FASTQ file upload and automated scaling of the computing instances based on traffic, processing each sample costs less than $0.01 (Figure S2). Hence, we can accommodate hundreds of concurrent users with little to no impact on speed or cost. Currently, and in the coming 4-5 years, we believe that we will be able to cover all expenses for file upload, quantification, and storage of the processed files and notebooks for thousands of users. In the longer term future, we may need to implement technologies that transfer some of the cloud computing costs to the user.
It should be noted that when uploading FASTQ files to BioJupies, the transcript quantification process is decoupled from the downstream analysis steps contained within the Jupyter Notebook. One major drawback of this is the fact that the user cannot fully reproduce the pipeline, starting from the raw data all the way to the final results within a single notebook. On the other hand, this implementation approach has some advantages. First, since the transcript quantification process requires significantly more processing power than the downstream analysis, the cloud-based architecture is provided as an independent scalable, parallel, and inexpensive web service that can be used independently by other applications. Second, many users come to BioJupies with pre-aligned RNA-seq datasets. So there is a common entry point for generation all BioJupies Jupyter Notebooks. However, encapsulating the alignment step within the notebook, and describing the pipeline using common workflows such as SnakeMake (Köster and Rahmann, 2012), Nextflow (Di Tommaso et al., 2017), CWL (Amstutz et al., 2016), or WDL (Frazer, 2014), will be implemented in the near future.
While automated notebook generation could have been implemented as a feature within existing platforms such as Galaxy (Goecks et al., 2010; Grüning et al., 2017) or GenePattern (Reich et al., 2006; Reich et al., 2017), BioJupies is implement as a standalone web server. By focusing only on the analysis of RNA-seq data, BioJupies has a simpler web interface, tailored around the basic steps required by most RNA-seq analysis pipelines. The limited scope of BioJupies enables better usability that lowers the barrier of entry for researchers with no programming background, while still maintaining a level of technical detail that should also appeal to more experienced programmers.
It may appear that the RNA-seq Jupyter Notebooks make the RNA-seq data, and the tools applied for the analysis, more findable, accessible, interoperable and reusable (FAIR) (Wilkinson et al., 2016). However, currently, the notebooks and the datasets analyzed by BioJupies fail many of the FAIR guidelines and metrics. For example, the notebook is not citable, uploaded RNA-seq data is not indexed in an established repository, metadata describing the samples and experimental conditions are not required, and unique identifiers are not enforced. Future work will enhance the process to better comply the BioJupies generated notebooks with the FAIR principles. One way to increase FAIRness is to encode the BioJupies pipelines in standard workflow languages. This approach may facilitate the more rapid adoption of other data analysis pipelines that can be supported by the BioJupies framework. Although BioJupies was developed to create notebooks for RNA-seq analysis, pipelines to process other data types should be possible to implement. This can be achieved through the plug-in architecture and coded workflows. One feature that is currently missing from BioJupies is the launch of live notebooks in the cloud. To achieve this, Kubernetes (Hightower et al., 2017) can be utilized to directly deploy BioJupies in the cloud. Hence, BioJupies can be extended in many ways. While there are many ways to extend BioJupies, at its present form, the BioJupies application can facilitate rapid and in-depth data analysis for many investigators.
STAR Methods
CONTACT FOR REAGENT AND RESOURCE SHARING
Further information and requests for resources should be directed to and will be fulfilled by the Lead Contact, Avi Ma’ayan (avi.maayan@mssm.edu).
METHOD DETAILS
The BioJupies interactive website
The BioJupies website is hosted on a web server running in a Docker container (Merkel, 2014) as a Ubuntu image that is pulled from Docker Hub. The container is deployed on a Mesosphere platform via Marathon and is served using a Python-Flask framework with an nginx HTTP server, uWSGI, and a MySQL database (Figure S1). The front-end of the website is built using HTML5 Bootstrap, CSS3, and JavaScript. When a user requests the generation of a notebook, the website builds a JSON-formatted ‘notebook configuration’ string that contains information about the selected datasets and plug-ins. The website first queries the MySQL database to find whether a notebook with the same configuration was previously generated. If a notebook is found, the link to it is displayed on the final results page. Otherwise, the notebook configuration JSON is sent to the notebook generator server through an HTTP POST request. The server uses this information to generate a notebook and then returns a permanent URL to the client for display.
Programmatic generation of Jupyter Notebooks
The Jupyter Notebook generator server uses the information in the JSON-formatted ‘notebook configuration’ string to generate a Jupyter Notebook with the Python library nbformat. The server executes the notebook using the Python library nbconvert and then saves the notebook in a file encoded into the ipynb format. The file is subsequently uploaded to a Google Cloud storage bucket using the google-cloud Python library. The statically rendered notebook is made available on a persistent and public URL using Jupyter nbviewer. The Docker container that encapsulates the running server contains a copy of the BioJupies plug-in library, which contains all the scripts necessary to download, normalize and analyze the RNA-seq data. The container is deployed on a Mesosphere platform via Marathon and served using a Python-Flask framework with an nginx HTTP server and uWSGI. The server is allocated with 5GB memory, and can handle up to 5 concurrent notebook generation requests. If more than 5 requests are performed at the same time, the other requests are queued until previous jobs have completed. Allocated memory and the number of concurrent notebook generation requests can be increased in the future if there is an increase in user demand. Generation of a single notebook typically takes between 10 seconds to 2 minutes, depending on the size of the RNA-seq dataset and the number of tools selected (Figure S2).
The BioJupies Chrome Extension
The BioJupies Chrome extension enhances the search results pages of the GEO website at: https://www.ncbi.nlm.nih.gov/geo. When a user is visiting a search results page on GEO, the BioJupies Chrome extension extracts the accession IDs of the returned GEO datasets query. The extension then queries the BioJupies MySQL database to identify which search-returned datasets have been processed by ARCHS4 (Lachmann et al., 2018). For those datasets that have been processed by ARCHS4, the BioJupies Chrome extension embeds BioJupies ‘Generate Notebook’ buttons near the matching entries. When these buttons are clicked, a user interface is deployed. The ‘Generate Notebook’ buttons are only displayed near datasets that we have pre-processed with ARCHS4. The user interface leads the user through the steps to generate the ‘notebook configuration’ JSON string. Once all information is gathered, the ‘notebook configuration’ JSON string is sent to the notebook generation server through an HTTP POST request to generate a Jupyter Notebook. Once the notebook is ready, a link to it is displayed by the Chrome extension. The main benefit of the Chrome Extension is that it can be used directly when browsing GEO pages. This can be useful, for example, when working to extract gene expression signatures for drugs, genes, and diseases in conjunction with GEO2Enrichr (Gundersen et al., 2015) for microtasks projects (Wang et al., 2016). The BioJupies Chrome extension is freely available from the Chrome Web Store at: https://chrome.google.com/webstore/detail/biojupies-generator/picalhhlpcjhonibabfigihelpmpadel?hl=en-US.
QUANTIFICATION AND STATISTICAL ANALYSIS
The BioJupies plug-in library
The BioJupies plug-in library is a modular set of Python and R scripts which are used to download, normalize, and analyze RNA-seq datasets for notebook generation using BioJupies. The library consists of a set of core scripts responsible for loading the RNA-seq data into the pandas DataFrames (McKinney, 2010), scripts for normalizing the data, and scripts for performing the differential gene expression analysis, currently implemented with limma (Ritchie et al., 2015; Smyth, 2005) or the Characteristic Direction (Clark et al., 2014) methods. In addition to these, the library contains a broad range of data analysis tools organized in a plug-in architecture. Each plug-in can be used to analyze the data, and to embed interactive visualizations of the results in the output Jupyter Notebook report. Currently, the library contains 14 plug-ins divided into 4 categories (Table 1). The plug-in library is expected to be updated regularly and grow as we incorporate more computational tools submitted by developers who wish to have their tools integrated within the BioJupies framework. The BioJupies plug-in library is openly available from GitHub at: https://github.com/MaayanLab/biojupies-plugins.
Processed RNA-seq datasets
The pre-processed RNA-seq datasets available for analysis from BioJupies are directly extracted from the ARCHS4 database (Lachmann et al., 2018). First, gene-level count matrices stored in the h5 format were downloaded for mouse and human from the ARCHS4 web-site (human_matrix.h5 and mouse_matrix.h5). Gene counts and metadata were subsequently extracted using the Python h5py library and packaged into over 8,000 individual HDF5 files, one for each GEO Series (GSE) and GEO Platform (GPL) pair. Data packages were subsequently uploaded to a Google Cloud storage bucket using the google-cloud library and made available for download through a public URL. Datasets are permanently stored in the cloud, and are made available to the user for analysis using the same persistent URL. If a user requests generation of a notebook using the exact same configuration as a previously generated notebook, they will obtain a link to the already performed analysis. Users can force a reanalysis by changing any component of the notebook configuration, including the title, the number of selected plugins, or the plug-in parameters.
Processing of user-submitted RNA-seq data
Processed RNA-seq datasets are submitted from the upload page using the Dropzone JavaScript library. Uploaded files are combined with sample metadata into an HDF5 data package (The HDF5® Library & File Format) using the h5py Python library and subsequently uploaded to a Google Cloud storage bucket with the google-cloud library. Raw sequencing files are submitted directly to an Amazon Web Services (AWS) S3 cloud storage bucket from the raw sequencing data upload page. Since file upload is performed directly through the cloud service provider, it is completely elastic and not subject to bandwidth limitation. Once the data is uploaded, gene expression is quantified using the ARCHS4 RNA-seq processing pipeline (Lachmann et al., 2018), which runs in parallel on the AWS cloud. The core component of the processing pipeline is the alignment of the raw mRNA reads to a reference genome. This process is encapsulated in deployable Docker containers that performs the quantification step with kallisto (Bray et al., 2016). However, other aligners such as STAR (Dobin et al., 2013) can be supported using the same Docker architecture. Alignment of each FASTQ file typically takes between 10 to 15 minutes and costs below $0.01 on average (Figure S2). The system allocates resources dynamically at a 4:1 ratio between jobs requested and cloud alignment instances launched. Each instance runs two alignment jobs concurrently. The use of the efficient aligner kallisto, with the optimized ARCHS4 RNA-seq processing pipeline, keeps the cost negligible and the service scalable to hundreds of concurrent users. Once gene counts have been quantified, the data is combined with sample metadata into an HDF5 package similarly to the way the processed datasets are made accessible to BioJupies for further analysis.
Pseudo-alignment cost
The pseudo-alignment cost for the 986 samples that have been already processed by BioJupies averages $0.0081 per sample (Figure S2). The cost depends on the number and length of the reads and it only represents an estimation of the expected cost. The total cost of processing RNA-seq data in scalable cloud computing infrastructures has an additional cost associated with the overhead of adding compute instances if demand increases. Adding more resources to the compute cluster can take about 15 minutes. We do not capture the upscaling overhead in the cost per sample calculation. Adding a single compute node to the cluster costs approximately $0.025. The scaling can be modified by having more compute instances that are waiting for performing pseudo-alignment tasks. This will result in shortest wait time for a user but an increase in baseline monthly costs and in turn costs per sample. Such overhead can be marginalized if the scaling ratios that are less sensitive to queue length. For example, adding one compute instance every 10 awaiting jobs distributes $0.025 over 10 alignment jobs resulting in a total overhead per sample of $0.0025 for a total of ~$0.01 per sample. For this calculation, the instance cost per hour is estimated at $0.1 based on the current price of an m5.large, which is $0.096 per hour.
DATA AND SOFTWARE AVAILABILITY
BioJupies is freely available at: http://biojupies.cloud
The BioJupies Chrome extension can be freely installed from the Chrome Web Store at: https://chrome.google.com/webstore/detail/biojupies-generator/picalhhlpcjhonibabfigihelpmpadel?hl=en-US
Source code for the BioJupies web server and Chrome extension is freely available via GitHub: https://github.com/MaayanLab/biojupies
Source code for the BioJupies data analysis plugins is freely available via GitHub: https://github.com/MaayanLab/biojupies-plugins
Supplementary Material
Highlights.
BioJupies guides users through the steps of RNA-seq data analysis
Users can upload raw or processed data, or fetch published studies
Raw reads are processed in parallel in the cloud for free
Results are automatically generated and presented as Jupyter Notebook reports
Acknowledgements
This work is supported by NIH grants U54-HL127624 (LINCS-DCIC), U24-CA224260 (IDG-KMC), and OT3-OD025467 (NIH Data Commons).
Footnotes
Publisher's Disclaimer: This is a PDF file of an unedited manuscript that has been accepted for publication. As a service to our customers we are providing this early version of the manuscript. The manuscript will undergo copyediting, typesetting, and review of the resulting proof before it is published in its final citable form. Please note that during the production process errors may be discovered which could affect the content, and all legal disclaimers that apply to the journal pertain.
Declaration of Interests
The authors declare no competing interests.
References
- Amstutz P, Crusoe MR, Tijanić N, Chapman B, Chilton J, Heuer M, Kartashov A, Leehr D, Ménager H, and Nedeljkovich M (2016). Common Workflow Language, v1. 0. [Google Scholar]
- Baumer B, Cetinkaya-Rundel M, Bray A, Loi L, and Horton NJ (2014). R Markdown: Integrating a reproducible analysis tool into introductory statistics. arXiv preprint arXiv:14021894.
- Bray NL, Pimentel H, Melsted P, and Pachter L (2016). Near-optimal probabilistic RNA-seq quantification. Nature biotechnology 34, 525. [DOI] [PubMed] [Google Scholar]
- Chang W, Cheng J, Allaire JJ, Xie Y, and McPherson J (2015). Shiny: web application framework for R. R package version 011 1, 106. [Google Scholar]
- Clark NR, Hu KS, Feldmann AS, Kou Y, Chen EY, Duan Q, and Ma’ayan A (2014). The characteristic direction: a geometrical approach to identify differentially expressed genes. BMC bioinformatics 15, 79. [DOI] [PMC free article] [PubMed] [Google Scholar]
- Di Tommaso P, Chatzou M, Floden EW, Barja PP, Palumbo E, and Notredame C (2017). Nextflow enables reproducible computational workflows. Nature biotechnology 35, 316. [DOI] [PubMed] [Google Scholar]
- Dobin A, Davis CA, Schlesinger F, Drenkow J, Zaleski C, Jha S, Batut P, Chaisson M, and Gingeras TR (2013). STAR: ultrafast universal RNA-seq aligner. Bioinformatics 29, 15–21. [DOI] [PMC free article] [PubMed] [Google Scholar]
- Edgar R, Domrachev M, and Lash AE (2002). Gene Expression Omnibus: NCBI gene expression and hybridization array data repository. Nucleic acids research 30, 207–210. [DOI] [PMC free article] [PubMed] [Google Scholar]
- Frazer S (2014). Workflow description language. GitHub https://github.com/broadinstitute/wdl. [Google Scholar]
- Gardeux V, David FP, Shajkofci A, Schwalie PC, and Deplancke B (2017). ASAP: a web-based platform for the analysis and interactive visualization of single-cell RNA-seq data. Bioinformatics 33, 3123–3125. [DOI] [PMC free article] [PubMed] [Google Scholar]
- Ge SX (2017). iDEP: An integrated web application for differential expression and pathway analysis. bioRxiv, 148411. [DOI] [PMC free article] [PubMed] [Google Scholar]
- Goecks J, Nekrutenko A, and Taylor J (2010). Galaxy: a comprehensive approach for supporting accessible, reproducible, and transparent computational research in the life sciences. Genome biology 11, R86. [DOI] [PMC free article] [PubMed] [Google Scholar]
- Grüning BA, Rasche E, Rebolledo-Jaramillo B, Eberhard C, Houwaart T, Chilton J, Coraor N, Backofen R, Taylor J, and Nekrutenko A (2017). Jupyter and Galaxy: Easing entry barriers into complex data analyses for biomedical researchers. PLoS computational biology 13, e1005425. [DOI] [PMC free article] [PubMed] [Google Scholar]
- Gundersen GW, Jones MR, Rouillard AD, Kou Y, Monteiro CD, Feldmann AS, Hu KS, and Ma’ayan A (2015). GEO2Enrichr: browser extension and server app to extract gene sets from GEO and analyze them for biological functions. Bioinformatics 31, 3060–3062. [DOI] [PMC free article] [PubMed] [Google Scholar]
- Haendel MA, Gkoutos GG, Lewis SE, and Mungall C (2009). Uberon: towards a comprehensive multi-species anatomy ontology. [DOI] [PMC free article] [PubMed] [Google Scholar]
- Hanna J, Joseph E, Brochhausen M, and Hogan WR (2013). Building a drug ontology based on RxNorm and other sources. Journal of biomedical semantics 4, 44. [DOI] [PMC free article] [PubMed] [Google Scholar]
- Hightower K, Burns B, and Beda J (2017). Kubernetes: Up and Running: Dive Into the Future of Infrastructure (“ O’Reilly Media, Inc.”). [Google Scholar]
- Kibbe WA, Arze C, Felix V, Mitraka E, Bolton E, Fu G, Mungall CJ, Binder JX, Malone J, and Vasant D (2014). Disease Ontology 2015 update: an expanded and updated database of human diseases for linking biomedical knowledge through disease data. Nucleic acids research 43, D1071–D1078. [DOI] [PMC free article] [PubMed] [Google Scholar]
- Kluyver T, Ragan-Kelley B, Pérez F, Granger BE, Bussonnier M, Frederic J, Kelley K, Hamrick JB, Grout J, and Corlay S (2016). Jupyter Notebooks-a publishing format for reproducible computational workflows. Paper presented at: ELPUB. [Google Scholar]
- Knuth DE (1984). Literate programming. The Computer Journal 27, 97–111. [Google Scholar]
- Köster J, and Rahmann S (2012). Snakemake—a scalable bioinformatics workflow engine. Bioinformatics 28, 2520–2522. [DOI] [PubMed] [Google Scholar]
- Kuhn T, and Dumontier M (2017). Genuine semantic publishing. Data Science, 1–16. [Google Scholar]
- Lachmann A, Torre D, Keenan AB, Jagodnik KM, Lee HJ, Wang L, Silverstein MC, and Ma’ayan A (2018). Massive mining of publicly available RNA-seq data from human and mouse. Nature Communications 9, 1366. [DOI] [PMC free article] [PubMed] [Google Scholar]
- Li Y, and Andrade J (2017). DEApp: an interactive web interface for differential expression analysis of next generation sequence data. Source code for biology and medicine 12, 2. [DOI] [PMC free article] [PubMed] [Google Scholar]
- Mailman MD, Feolo M, Jin Y, Kimura M, Tryka K, Bagoutdinov R, Hao L, Kiang A, Paschall J, and Phan L (2007). The NCBI dbGaP database of genotypes and phenotypes. Nature genetics 39, 1181. [DOI] [PMC free article] [PubMed] [Google Scholar]
- McKinney W (2010). Data structures for statistical computing in python. Paper presented at: Proceedings of the 9th Python in Science Conference (Austin, TX: ). [Google Scholar]
- Merkel D (2014). Docker: lightweight linux containers for consistent development and deployment. Linux Journal 2014, 2. [Google Scholar]
- Monier B, McDermaid A, Zhao J, Fennell A, and Ma Q (2018). IRIS-DGE: An integrated RNA-seq data analysis and interpretation system for differential gene expression. bioRxiv, 283341. [Google Scholar]
- Nelson JW, Sklenar J, Barnes AP, and Minnier J (2017). The START App: a web-based RNAseq analysis and visualization resource. Bioinformatics 33, 447–449. [DOI] [PMC free article] [PubMed] [Google Scholar]
- Qu K, Garamszegi S, Wu F, Thorvaldsdóttir H, Liefeld T, Ocana M, Borges-Rivera D, Pochet N, Robinson JT, and Demchak B (2016). Integrative genomic analysis by interoperation of bioinformatics tools in GenomeSpace. nature methods 13, 245. [DOI] [PMC free article] [PubMed] [Google Scholar]
- Reich M, Liefeld T, Gould J, Lerner J, Tamayo P, and Mesirov JP (2006). GenePattern 2.0. Nature genetics 38, 500. [DOI] [PubMed] [Google Scholar]
- Reich M, Tabor T, Liefeld T, Thorvaldsdóttir H, Hill B, Tamayo P, and Mesirov JP (2017). The GenePattern Notebook Environment. Cell systems 5, 149–151. e141. [DOI] [PMC free article] [PubMed] [Google Scholar]
- Ritchie ME, Phipson B, Wu D, Hu Y, Law CW, Shi W, and Smyth GK (2015). limma powers differential expression analyses for RNA-sequencing and microarray studies. Nucleic acids research 43, e47–e47. [DOI] [PMC free article] [PubMed] [Google Scholar]
- Smyth GK (2005). Limma: linear models for microarray data. In Bioinformatics and computational biology solutions using R and Bioconductor (Springer), pp. 397–420. [Google Scholar]
- Wang Z, Gerstein M, and Snyder M (2009). RNA-Seq: a revolutionary tool for transcriptomics. Nature reviews genetics 10, 57. [DOI] [PMC free article] [PubMed] [Google Scholar]
- Wang Z, and Ma’ayan A (2016). An open RNA-Seq data analysis pipeline tutorial with an example of reprocessing data from a recent Zika virus study. F1000Research 5. [DOI] [PMC free article] [PubMed] [Google Scholar]
- Wang Z, Monteiro CD, Jagodnik KM, Fernandez NF, Gundersen GW, Rouillard AD, Jenkins SL, Feldmann AS, Hu KS, and McDermott MG (2016). Extraction and analysis of signatures from the Gene Expression Omnibus by the crowd. Nature communications 7, 12846. [DOI] [PMC free article] [PubMed] [Google Scholar]
- Wilkinson MD, Dumontier M, Aalbersberg IJ, Appleton G, Axton M, Baak A, Blomberg N, Boiten J-W, da Silva Santos LB, and Bourne PE (2016). The FAIR Guiding Principles for scientific data management and stewardship. Scientific data 3. [DOI] [PMC free article] [PubMed] [Google Scholar]
- Xie Y (2014). knitr: a comprehensive tool for reproducible research in R. Implement Reprod Res 1, 20. [Google Scholar]
- Younesy H, Möller T, Lorincz MC, Karimi MM, and Jones SJ (2015). VisRseq: R-based visual framework for analysis of sequencing data. BMC bioinformatics 16, S2. [DOI] [PMC free article] [PubMed] [Google Scholar]
Associated Data
This section collects any data citations, data availability statements, or supplementary materials included in this article.