Abstract
Background
The antigenic trigger that drives the expansion of circulating plasmablasts and CD4+ cytotoxic T cells (CD4+ CTLs) in patients with IgG4-Related Disease (IgG4-RD) is presently unknown.
Objective
We sought to sequence Ig genes from single cell clones of dominantly-expanded plasmablasts and generate recombinant human monoclonal antibodies to identify relevant antigens in IgG4-RD using mass spectrometry.
Methods
Paired heavy and light chain cDNAs from dominant plasmablast clones were expressed as monoclonal antibodies (mAbs) and used to purify antigens using immunoaffinity chromatography. Affinity-purified antigens were identified by mass spectrometry and validated by ELISA. Plasma levels of the antigen of interest were also determined using ELISA
Results
mAbs expressed from the two dominant plasmablast clones of a patient with multi-organ IgG4-RD stained human pancreatic tissue sections. Galectin-3 was identified as the antigen specifically recognized by both mAbs. Anti-galectin-3 autoantibody responses were predominantly of the IgG4 isotype (28% of the IgG4-RD cohort, p = 0.0001) and IgE isotype (11% of IgG4-RD cohort, p = 0.009). No significant responses were seen from the IgG1, IgG2 or IgG3 isotypes. IgG4 anti-galectin-3 autoantibodies correlated with elevated plasma galectin-3 levels (p=0.001), lymphadenopathy (p=0.04), total IgG elevation (p=0.05), and IgG4 elevation (p=0.03).
Conclusion
Affinity chromatography using patient-derived monoclonal antibodies identifies relevant auto-antigens in IgG4-RD. IgG4 galectin-3 autoantibodies are present in a subset of IgG4-RD patients and correlate with galectin-3 plasma levels. The marked elevations of circulating IgG4 and IgE observed clinically are, at least in part, due to the development of IgG4 and IgE specific autoantibody responses.
Keywords: IgG4-related disease, plasmablast, auto-antigen, galectin-3, autoantibody
Background
IgG4-related disease (IgG4-RD) is a chronic immune-mediated disease of unclear etiology. The most common clinical presentation involves the painless enlargement of affected organ(s), raising concern for an underlying malignancy. The most frequent sites of disease are the major salivary glands (parotid and submandibular), lacrimal glands, pancreas, biliary tree, lung, kidneys, retroperitoneum, lymph nodes and aorta.1
Elevated plasma levels of immunoglobulin are observed in the great majority of IgG4-RD patients, and IgG4 is produced out of proportion to the levels of other IgG subclasses. Previous studies from our group have demonstrated a prominent expansion of circulating plasmablasts in IgG4-RD compared to healthy individuals.2 Plasmablasts in IgG4-RD subjects display an oligoclonally-restricted Ig repertoire in which 3-5 dominant clones typically account for the large majority of circulating plasmablasts.2 The numbers of circulating plasmablasts correlate with IgG4-RD disease activity, suggesting that the adaptive immune system is triggered during active disease.3 The tightly restricted repertoire of plasmablasts strongly supports the notion that IgG4-RD is an antigen-driven disease. The precise mechanism through which activated B cell populations contribute to the disease, however, remains unclear. The possible role of adaptive immunity in disease pathogenesis is further supported by the demonstration of large clonal expansions of CD4+ cytotoxic T lymphocytes (CD4+CTLs), but not of other T cell subsets, in affected tissues of IgG4-RD subjects.4,5 These T cells express granzymes and perforin and secrete cytokines such as IL-1β, IFN-γ and TGF-β, which have been linked to fibrosis. In addition, our studies have recently demonstrated a paucity of IL-4 expressing GATA-3+ TH2 cells in IgG4-RD but a marked expansion of IL-4 secreting BATF+ T follicular helper cells in tertiary lymphoid organs and lymph nodes of IgG4-RD subjects.34 The question of which antigens drive the striking clonal expansion of B and T cells remains unanswered.
Most previous investigations of antigens associated with IgG4-RD have been performed in the context of type 1 autoimmune pancreatitis or IgG4-related cholangitis, now recognized as two cardinal manifestations of IgG4-RD. Using whole or pooled serum as a primary antibody source, these studies have identified lactoferrin, carbonic anhydrases, pancreatic secretory trypsin inhibitor, amylase α2A, ubiquitin-protein ligase E3 component n-recognin 2 (UBR2), trypsinogen and annexin A11 as auto-antigens in autoimmune pancreatitis and cholangitis.6,7,8,9,10,11,12 However, because nearly all of these studies were conducted before the recognition of IgG4-RD as a distinct disease, patients with type 2 autoimmune pancreatitis – a distinctly different condition from type 1 autoimmune pancreatitis that is not part of the IgG4-RD spectrum – were included. These studies were also limited to a small subset of manifestations of what is now regarded as a systemic disease.
A more recent investigation, conducted on multi-organ IgG4-RD, identified the nuclear protein prohibitin as a potential auto-antigen in a high frequency of patients compared to controls but this finding has not yet been validated in any other study cohort and its pathogenic implications have not been elucidated.13 Finally, a study of the transfer of patient-derived antibodies into neonatal rodents suggests that antibodies in IgG4-RD subjects may be of pathogenic significance,14 yet the true significance of IgG4 and other antibodies in disease pathogenesis remains unclear.
Our group has shown that B cell depletion mediates prompt clinical improvement15 and also leads to a corresponding decline in CD4+CTLs.5 One possibility with regard to pathophysiology, therefore, is that dominantly-expanded B cells maintain or present some unidentified antigen(s) to expanded CD4+CTLs in IgG4-RD tissues. These dominant B cells may also present antigens to relevant T follicular helper cells in disease subjects thereby driving germinal center responses and IgG4 class switching. Detection of an autoantibody at some level in a given subject does not necessarily imply that the most actively expanded B cells in that subject are the source of this antibody. Understanding disease pathogenesis would be greatly facilitated by the identification of antigens recognized by expanded lymphocyte clones that dominate during active disease.
We describe here an approach involving the sequencing of Ig genes from dominant plasmablast clones from a patient with IgG4-RD. We generated recombinant patient-derived human monoclonal antibodies and used them to identify disease-relevant antigens using immunoaffinity chromatography and mass spectrometry.
Methods
Patients
All studies were approved by the institutional review board of the Massachusetts General Hospital and informed written consent was obtained from all patients prior to sample collection. One hundred and twenty-one IgG4-RD subjects were recruited between the dates of January 10th, 2012 and February 6th, 2017. Information regarding demographics, treatment, disease activity, laboratory parameters and disease manifestations for these patients is presented in Supplemental Table S1. Disease activity was quantified using the IgG4-RD Responder Index (IgG4-RD-RI).16 An IgG4-RD-RI ≥1 was considered active disease. Patients with IgG4-RD were compared to 45 idiopathic pulmonary fibrosis (IPF) patients and 50 healthy donors. IPF patient plasma samples were obtained through the Massachusetts General Hospital Division of Pulmonary & Critical Care Medicine’s Biorepository of Interstitial Lung Diseases. Healthy donor plasma was obtained from the Partners HealthCare Biobank, an institution-wide repository of samples from consented subjects. This database was filtered to exclude patients with autoimmune disease, chronic infection and malignancy in order to identify age- and sex-matched healthy donors. Medical records were reviewed in detail to ensure appropriate “healthy” status without immunologic confounding factors.
Blood Processing and Storage
Blood from IgG4-RD patients was collected in ACD tubes and immediately transported to the laboratory for cell isolation. Peripheral blood mononuclear cells (PBMCs) were isolated by Ficoll-Paque density gradient centrifugation. Plasma was aliquoted and stored at −80°C for subsequent use. Unused PBMCs were suspended in fetal bovine serum containing 10% dimethyl sulfoxide and cryopreserved in liquid nitrogen.
Flow Cytometry and Cell Sorting
Fresh PBMCs were washed and quantified using an automated cell counter. Cells were stained for flow cytometric identification at a concentration of 20 million cells/mL using the following antibody panel: anti-human CD19-Pacific Blue (clone HIB19), anti-human CD27-APC (clone O323), anti-human CD38-FITC (clone HIT2). All antibodies were procured from BioLegend (San Diego, CA). Conjugated-antibodies were incubated at 4°C, protected from light to minimize photo-degradation. Flow cytometry was performed on a BD LSR II (BD Biosciences, San Jose, CA) and the FCS files were analyzed using FlowJo software (version 10). Plasmablasts were identified as CD19+, CD27Hi, CD38Hi cells as previously described3. Plasmablasts were sorted using a FACS Aria 3 sorter in both bulk and single cell format. For single cell plasmablast sorting, cells were collected in 96-well PCR plates (VWR) containing 4 μL of cell lysis buffer (0.5× PBS containing 10 mM DTT and 8 U RNasin (Promega) and plates were stored at −80°C to preserve RNA integrity. Intra-cellular flow cytometry was also performed on pancreatic cancer cell lines (PaCa2, AsPC-1, SU.86.86, SW-1990, HPAF-II). For these experiments, we fixed freshly harvested cells with BD Cytofix/Cytoperm solution (Cat. No. 554722, BD Biosciences, San Jose, CA) then permeabilized fixed cells with 0.01% Tween20. Subsequently, cells were stained with biotinylated patient-derived mAbs (see Immunofluorescence section below) at a concentration of 10 μg/mL. Cells were washed twice with PBS followed by secondary antibody incubation with Alexafluor 488-Streptavidin (Invitrogen, Cat#S32354). An IgG1 lambda isotype control and secondary antibody alone were used as controls to confirm adequate washing and determine positive binding, respectively. Cells were immediately analyzed by flow cytometry.
Immunoglobulin Heavy Chain Repertoire Analysis
Next-generation sequencing analysis of the B-cell receptor IGH repertoire was performed by using the ImmunoSeq platform (Adaptive Biotechnologies, Seattle, Wash). Assembly of the VDJ region in the rearranged IGH sequences was performed with the IMGT V-Quest server and VDJ solver. Bulk repertoire analysis was used to identify the dominantly expanded clones based on the frequency of sequencing reads of the recombined heavy chain sequence. Plasmablasts were sorted as single cells and RNA was extracted from each cell, followed by RT-PCR and Sanger sequencing of expressed immunoglobulin heavy and light chain genes as described by Tiller et al.17, with minor primer modifications as previously described.2 The light chain sequence corresponding to the wells of the dominant heavy chains were identified. The paired heavy and light chain PCR products from single plasmablasts were cloned into expression vectors as previously described.17
Expression of Monoclonal Antibodies
Transient transfection was performed using a polyethylenimine:DNA ratio of 3:1 into 293F suspension cells in 2 liter volume flasks (500 mL medium at 1.2 million cells per mL). Both the heavy chain- and light chain-containing plasmids were transfected simultaneously. Cells were incubated for 5 days at 37 °C, with 5% CO2 in an oscillating incubator prior to harvesting. Immunoglobulin was purified from the supernatant using Pierce protein A/G Agarose beads. Antibody purity was confirmed by SDS-PAGE. Final antibody concentrations were quantified using a bicinchoninic acid based colorimetric assay.
Immunofluorescence
Patient-derived mAbs were biotinylated using an EZ-Link Sulfo-NHS-SS-biotinylation kit (Thermo Scientific,). We procured healthy pancreatic tissue immediately post-operatively from the Massachusetts General Hospital Pathology Department. Tissue was deemed “healthy” on histologic grounds as it was taken from the disease-free margin of a patient undergoing a tumor resection. Surgical specimens were immediately snap-frozen in isopentane cooled to −80°C for storage. Frozen sections were fixed in precooled acetone and rehydrated in PBS. A 30 minute incubation in 1% Sudan Black and 70% ethanol was used to quench auto-fluorescence. Slides were rinsed with water, blocked and gently permeabilized with 5% BSA + 0.01% Tween20 for 60 minutes. Endogenous biotin was blocked by incubating with avidin for 15 minutes. Primary antibodies (biotinylated patient-derived mAbs, positive control biotinylated anti-actin (Thermo Fisher Scientific, ACTN05(C4)), and negative control biotinylated anti-CD57) were incubated for 2 hours. All antibodies were incubated at the same concentration as determined by 2 independent bicinchoninic acid (BCA) assays. Slides were washed with PBS 0.01% Tween20 prior to secondary antibody incubation with Alexafluor 488-Streptavidin (Invitrogen, Cat#S32354) for 60 minutes at room temperature, and protected from light in a humidifier. Slides were washed and counterstained with a fluorescent-anti-bleach mountant containing DAPI (ProLong Gold, ThermoFisher Scientific, catalogue #P36931). Images were captured on a TissueFAXS microscope. A similar protocol was employed for cytospun human pancreatic epithelial cancer cells (PaCa2), which were kindly provided by Dr. Cyril Benes (Massachusetts General Hospital). For Intracellular staining, we fixed freshly harvested cells (pancreatic and non-pancreatic cancer cell lines) with BD Cytofix/Cytoperm solution (Cat. No. 554722) then permeabilized fixed cells by washing twice with a BD Perm/Wash buffer (Cat. No. 554732). Subsequently, cells were stained with patient-derived mAbs or an IgG1 isotype control at a concentration of 10 μg/ml and incubated. Cells were washed twice with PBS followed by secondary antibody incubation (mouse anti-Human IgG1 PE BD biosciences, Cat#560951), washed twice and immediately analyzed by flow cytometry.
Immunoaffinity purification and Mass Spectrometry
Purified mAbs from 2 separate clones and an isotype control were separately bound to protein A/G Sepharose beads and then covalently crosslinked using disuccinimidyl suberate (Pierce Crosslink Immunoprecipitation Kit, ThermoFisher Scientific, catalogue #26147). PaCa2 cell lysate was prepared using 1% NP-40 in 20 mM Tris, 150 mM NaCl, pH 7.8. EDTA-free cOmplete protease inhibitor cocktail (Sigma-Aldrich, #11697498001) was added to the lysis buffer to prevent proteolysis of potential antigenic targets. After standard centrifugation steps and pre-clearing on protein A/G Sepharose beads, the lysate was incubated with the cross-linked mAb/protein A/G beads, washed extensively and eluted in 50 μL glycine-HCl pH 2.8. Eluted fractions were collected in 1M Tris to neutralize the elution buffer. The eluted proteins were reduced with DTT and alkylated with iodoacetamide, digested with Lys-C and trypsin.18 Generated peptides from the individual samples were derivatized with ten-plex tandem mass tag (TMT) reagents (Thermo Fisher) and protein concentration differences between the samples were determined by multiplexed quantitative proteomics using the synchronous-precursor-selection (SPS)-MS3 technology on an Orbitrap Fusion mass spectrometer (Thermo Fisher) essentially as described previously but omitting the basic pH reversed-phase liquid chromatography (bRPLC) fractionation due to the protein samples’ low complexity.19
Enzyme-Linked Immunosorbent Assay
Alternating rows of Nunc Medisorb 96 well plates were coated overnight at 4°C with recombinant galectin-3 (PeproTech, #450-38) at a concentration of 5 μg/mL in PBS. Intervening rows were used as negative control wells for each subject tested and coated only with 1% BSA during the blocking step. Each subject was tested in triplicate with corresponding triplicate BSA-only wells without galectin-3. BSA-only wells were used to subtract non-specific protein-protein and protein-well interactions. Plates were blocked overnight with 1% BSA + 0.01% Tween in PBS. Stored plasma was thawed, diluted 1:100 in blocking buffer and incubated overnight at 4°C. Respective peroxidase-labeled anti-human IgG subclass antibody was incubated at room temperature for 2 hours diluted 1:1,000 in blocking buffer was incubated for 60 minutes at 21°C. Secondary antibodies used included mouse anti-human IgG1 hinge heavy chain (Abcam, #99774), mouse anti-human IgG2 Fc (Abcam, #99779), mouse anti-human IgG3 (hinge region) (Bio-Rad, #MCA516G), mouse anti-human IgG4 pFc’ (Abcam, #99817), and goat anti-human IgE (Novus Biologicals, NB7459). All IgG subclass secondary antibodies were diluted at 1:1,000 in blocking buffer while the anti-IgE secondary antibody was diluted at 1:10,000 in blocking buffer. After 3 washes with PBS + 0.01% Tween, 100 uL of OPD substrate at a concentration of 0.4 mg/mL was incubated at 21°C for 30-60 minutes and the reaction was quenched with 100 uL 2N sulfuric acid. Absorbance was quantified on a Magellan plate reader at 492 nm with a reference range of 650 nm. Triplicate values were averaged and negative control average was subtracted from each subject. If any individual well deviated by >50% from its respective partners, that well was not included in calculating the average absorbance.
Statistical Analysis
For ELISA analysis, 2 standard deviations above the healthy donor mean was used to define a positive antibody response. This value effectively excluded 96% of healthy donor subjects. Because this study is exploratory and hypothesis generating, the analysis of clinical correlations is descriptive. We used measures of mean, median, standard deviations, inter-quartile range, frequency, and percent to summarize the data. Fisher’s exact test was used to compare the proportion of antibody responses between subjects with and without each organ manifestation and the sample size was determined by availability of resources. Positive antibody responses were defined by an absorbance of at least 2 standard deviations above the mean of healthy donor antibody responses. For continuous, non-parametric variables such as IgG and IgG subclasses, a two-tailed Mann-Whitney U test was used to compare groups. For all statistical analysis, a p-value of <0.05 was considered significant. Statistical analysis was performed using GraphPad Prism version 7.
Results
Monoclonal antibodies from dominant plasmablast clones from an IgG4-RD subject recognize a cytosolic pancreatic antigen
Circulating plasmablasts (CD19+, CD27Hi, CD38Hi) were quantified in a treatment-naive IgG4-RD subject with multi-organ involvement including the pancreas, bile ducts, lungs, salivary glands, and retroperitoneum. Plasmablasts represented approximately 10% of all CD19+ B cells in contrast to 1-3% observed in healthy donors (Supplemental Figure 1). Next generation sequencing of IgH genes revealed that the heavy chain repertoire was oligoclonal, with 3-5 clones representing the majority of sequence reads (Figure 1A). These data suggested that an antigen-driven immune response contributed to the clonal expansion of B cells in this patient. Paired heavy chain VDJ and light chain VJ sequences from individually-sorted plasmablasts were identified through single cell sequencing. Clones were defined by identical heavy chain VDJ, light chain VJ, and predicted IGH CDR3 amino acid sequences. These clones are identified henceforth as “Clone 1, Clone 2, and so on.” Twenty-two of 34 individually sequenced plasmablasts were found to be identical, representing 64% of all wells from the single cell sorted plate. The clonal frequency of individually sorted plasmablasts is depicted in Figure 1B. The two clones with the highest frequency from single cell sequencing were selected for mAb expression.
Figure 1.
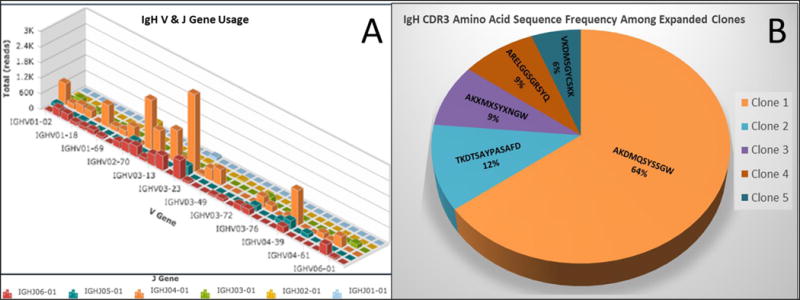
A) Bulk repertoire of sorted plasmablasts demonstrating IGH V gene usage on the x-axis, IGH J gene usage on the z-axis and number of sequencing reads on the y-axis. Each bar represents a clonal family. B) Pie-chart showing the frequency of dominantly expanded clones from single cell sequencing. The specific CDR3 amino acid sequence and percentage of wells from the single cell plate are displayed. The dominant clone, labeled “Clone 1” represented 22 of 34 sequenced individual cells.
Because our index patient had a history of type 1 (IgG4-related) autoimmune pancreatitis, we tested human pancreatic tissue for mAb reactivity by immunofluorescence. Intense reactivity was observed in a cytosolic pattern for both mAbs (Figure 2, A-D).
Figure 2.
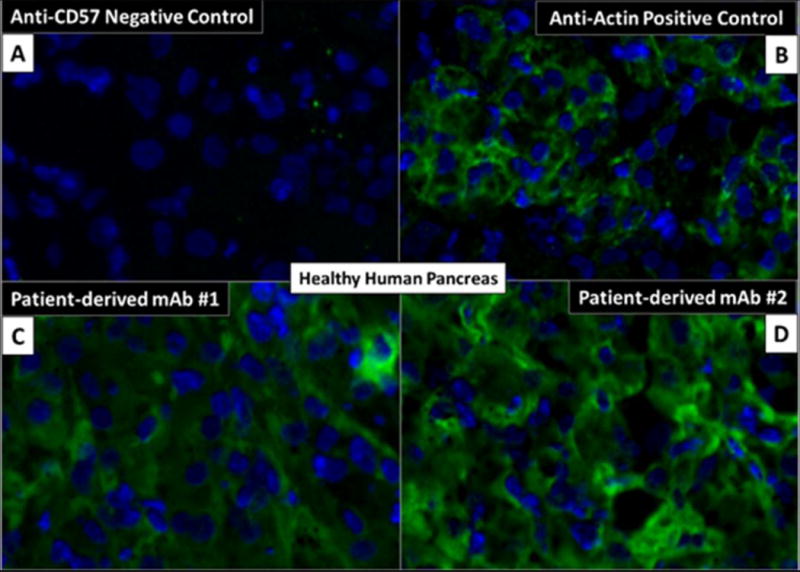
Immunofluorescence of pancreatic tissue. A-B) Negative (anti-CD57) and positive (anti-actin) control antibodies. C-D) Patient-derived monoclonal antibodies from dominantly expanded plasmablasts demonstrating intense reactivity in a cytosolic pattern.
To address whether the reactivity observed on pancreatic tissue was due to recognition of antigens expressed by epithelial pancreatic cells or stromal cells, we performed intra-cellular flow cytometry and immunofluorescence studies on pancreatic cancer cell lines and human primary skin fibroblasts. Both mAbs differentially recognized proteins expressed by PaCa2 pancreatic cancer cell line compared to unstained cells (Figure 3A) and displayed both a cytosolic and cell surface staining pattern (Figure 3B).
Figure 3.
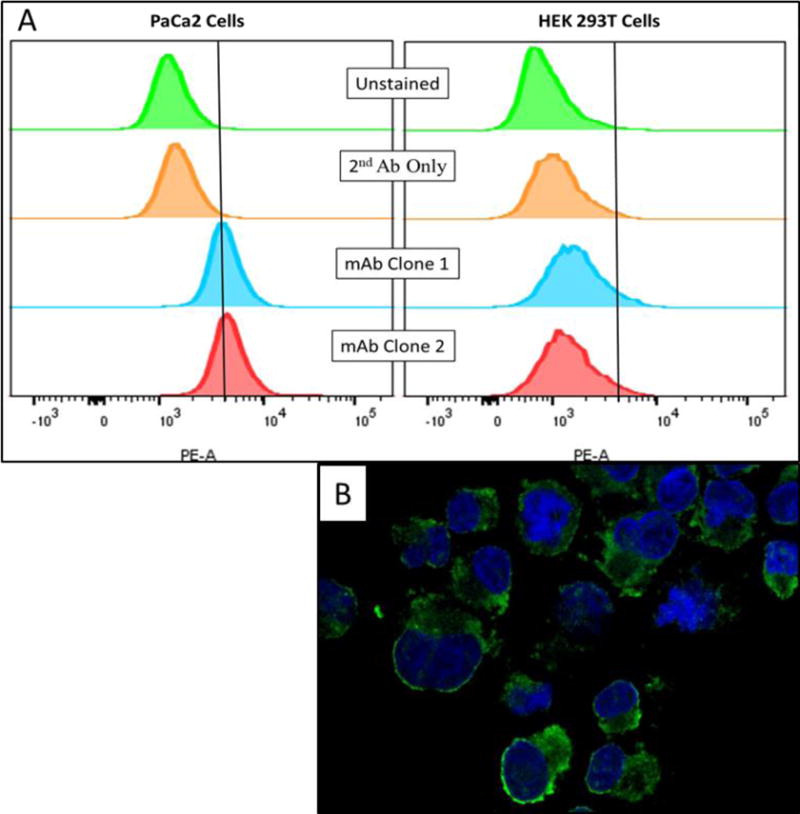
A) Intra-cellular flow cytometry revealed differential reactivity of mAbs with PaCa2 cells compared controls. Vertical cutoff lines drawn to exclude unstained cells. No difference was observed in HEK293T cells. B) Confocal microscopy of PaCa2 cells stained with biotinylated mAb clone 1 demonstrating cytosolic and cell surface staining patterns.
Affinity purification and mass spectrometry identifies galectin-3 as an auto-antigen in IgG4-RD
In order to identify the antigen expressed by PaCa2 cells that was recognized by both patient-derived mAbs, PaCa2 cells were lysed to generate a protein source for immunoprecipitation. Both mAbs bound a protein of approximately 30 kDa, which was not recognized by the isotype control (Supplemental Figure 2). Galectin-3 was then identified by multiplexed quantitative mass spectrometry-based proteomics as the protein with the highest differential binding affinity for both mAbs (Figure 4).
Figure 4.
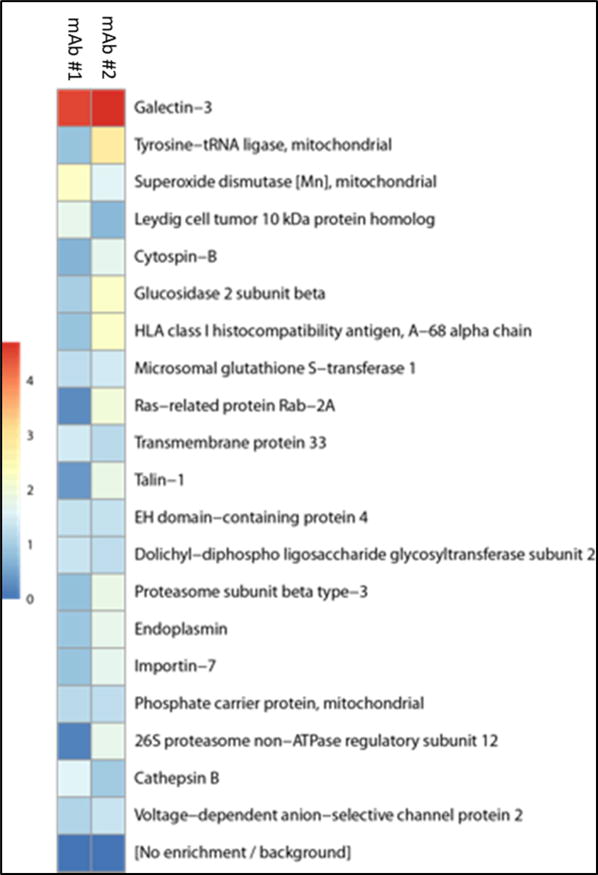
Heat map demonstrating differential protein binding of PaCa2 cell lysate by mAb clones #1 and #2. Scale reflects log2-fold change divided by isotype control. Background was determined using an isotype control. Galectin-3 was identified as the antigen with the highest binding affinity for both mAb clones.
To validate the finding of galectin-3 as an auto-antigen in IgG4-RD, we quantified anti-galectin-3 antibodies by ELISA in a large, clinically-diverse cohort of IgG4-RD patients. Forty-five IPF patients were used as fibrotic disease controls and 50 age-matched healthy donors were used to control for auto-reactivity that may occur with aging.20 Because dominant plasmablast clones have been shown to express IgG42 and IgG4 is the most robustly elevated IgG subclass observed in the plasma of IgG4-RD patients, we first measured IgG4-specific anti-galectin-3 antibody responses. This revealed a reactive frequency of 28% among the IgG4-RD cohort with little to no reactivity in the control groups (Figure 5). We next tested the cohort for galectin-3 reactivity by IgG1, IgG2, IgG3 and IgE isotypes. IgE isotype anti-galectin-3 antibodies were also detected in these experiments (Figure 5), but there was little to no reactivity by other IgG subclasses (Supplemental Figure 3). The presence of anti-galectin-3 antibodies of only IgG4 and IgE isotypes is consistent with the clinical observation of predominant IgG4 and IgE elevations in the blood of IgG4-RD patients compared to other IgG subclasses, which tend to be only modestly elevated and at a lower overall frequency (Figure 6). These results support the notion that at least a portion of the IgG4 and IgE expansion in the blood of IgG4-RD patients is due to the development of autoantibodies of these isotypes. One potential explanation for the observation of concordant IgG4 and IgE isotype responses is the effect of certain cytokine combinations such as interleukin-4 plus interleukin-10. This combination is reported to drive isotype switching to both IgG4 and IgE, with some skewing towards IgG4.21
Figure 5.
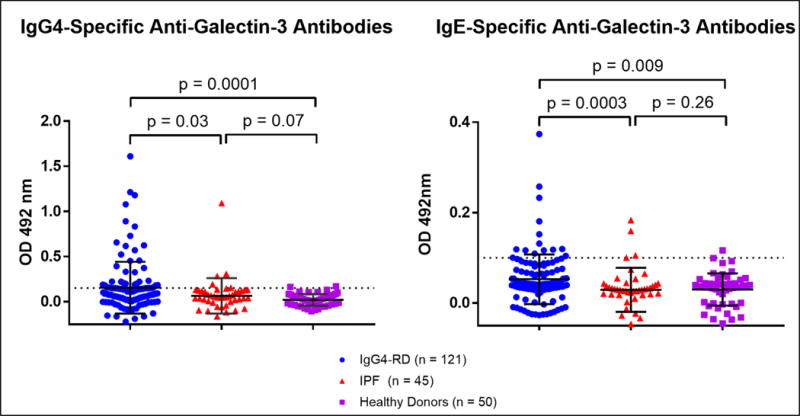
IgG4 and IgE isotype-specific anti-galectin-3 antibodies were confirmed by ELISA with 34 and 12 of 121 IgG4-RD subjects demonstrating IgG4 and IgE antibody responses, respectively. Dashed lines represent two standard deviations above the healthy donor mean.
Figure 6.
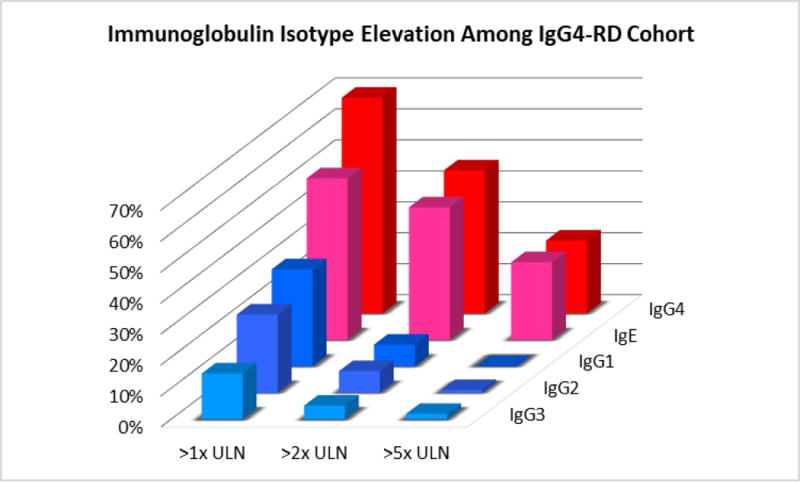
IgG subclass and IgE serum values of IgG4-RD cohort plotted as frequency of elevation among the cohort (y-axis), isotype (z-axis), and degree of elevation (x-axis). ULN indicates the upper limit of normal for the clinical reference laboratory value for each isotype.
Over-expression of galectin-3 may contribute to anti-galectin-3 auto-antibody responses
We next asked if the occurrence of IgG4-specific anti-galectin-3 antibodies was associated with over-expression of this protein, in accordance with the notion that accumulation of proteins within tumors of various types has previously been associated with the development of auto-antibodies directed against the over-expressed protein.22 In the context of anti-p53 antibodies, for example, this auto-immunization process has been demonstrated in a mouse model of Simian virus 40-induced malignancy in which p53 is stabilized by SV40 antigen and accumulates without any mutation or truncation to the wild-type form.23 Recently, using an unbiased, quantitative proteomic approach, pancreata of IgG4-RD patients were compared to those of control subjects.24 Galectin-3 was observed as one of the highest differentially expressed proteins in IgG4-RD pancreata, present at a 13-fold higher amount compared to controls.24 To support this idea, we quantified circulating galectin-3 levels in a subset of the IgG4-RD cohort compared to control subjects. Using a cut-off value of 10.25 ng/mL based on systemic sclerosis literature, where this cut-off value was an independent predictor of all-cause mortality25, we found that 15.5% of subjects in the IgG4-RD cohort had elevated plasma galectin-3 levels (Figure 7A) in contrast to systemic sclerosis, in which 41% of patients have circulating levels above this value.25 Based on the dispersion of plasma galectin-3 levels among the patient and healthy donor cohorts, we found this cut-off to be an appropriate delineation in which the elevated IgG4-RD subjects clearly differed from the <10.25 ng/mL set and only one of the healthy donors fell above this value. After segregating the IgG4-RD cohort based on elevated as opposed to normal plasma galectin-3 levels, IgG4 anti-galectin-3 antibodies were detected in 64% of those with elevated levels compared to only 23% in those with normal levels (p = 0.0032) (Figure 7B).
Figure 7.
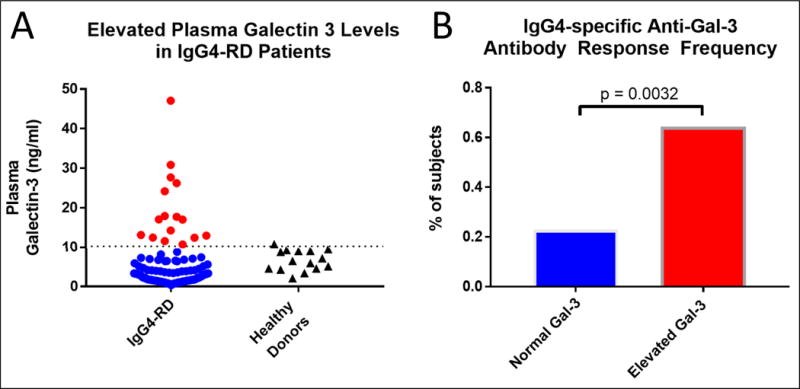
A) Circulating Galectin-3 levels were quantified by ELISA and 15.5% of the IgG4-RD cohort were found to have elevated levels compared to age-matched healthy donors. Subjects with elevated galectin-3 levels are indicated by red color. B) Segregating the cohort by those with vs those without elevated galectin-3 levels showed a nearly 3-fold enrichment in IgG4 anti-galectin-3 autoantibody responses among the subset with elevated circulating Gal-3 levels.
Finally, we analyzed the IgG4-RD cohort for clinical correlations with the presence of IgG4 anti-galectin-3 autoantibody responses. Total IgG and IgG4 levels correlated positively with the presence of this antibody response (p = 0.05 and 0.03, respectively) but there was no correlation with levels of any other IgG subclass or of IgE or IgM levels.
Given the reduced effector functions of the IgG4 molecule compared to other IgG subclasses, we hypothesized that there would be no clinically apparent correlation between IgG4 anti-galectin-3 autoantibodies and either systemic inflammation or complement consumption. Because hypergammaglobulinemia is known to cause red blood cell aggregation and elevate the erythrocyte sedimentation rate (regardless of any actual acute phase response), we used C-reactive protein as a more specific indicator of systemic inflammation in this analysis. There was no statistically significant correlation between C3 (p = 0.18), C4 (p = 0.17) or C-reactive protein (p = 0.69) levels and the presence of IgG4 anti-galectin-3 autoantibodies.
We utilized the IgG4-RD-Responder Index and extent of organ involvement as indicators of disease severity. By these indices, we found trends toward a higher Responder Index (p = 0.13), number of organs involved (p = 0.10) and multi-organ involvement (p = 0.09) in the IgG4 anti-galectin-3 antibody group. We also found a statistically significant correlation between lymphadenopathy and a positive IgG4 anti-galectin-3 antibody response (p = 0.04), but with no significant correlation with any other organ involvement. In summary, IgG4 anti-galectin-3 autoantibodies correlate with elevated total IgG, IgG4, galectin-3 levels and lymphadenopathy, with a trend towards more extensive disease involvement.
IgG4-RD response to rituximab is associated with a decline of anti-galectin 3 autoantibodies
In three subjects with positive anti-galectin-3 antibody responses who were subsequently treated with B cell depletion therapy, we measured the kinetics of autoantibody responses longitudinally. If autoantibody responses do not decline with B cell depletion (which corresponds with plasmablast depletion), one may infer that the response is being driven by long-lived plasma cells. A clear decline in autoantibody responses following B cell depletion therapy was observed in all three subjects examined, consistent with the production of a substantial proportion of the autoantibodies by plasmablasts and short-lived plasma cells. This decline in autoantibody response corresponded with an improvement in the subjects’ disease activity (Figure 8). Subject 336 was treated with a single course of rituximab, after which both the Responder Index and anti-galectin-3 antibody levels declined but never resolved fully as it had in subjects 365 and 876. Clinical remission was then maintained with the start of low-dose prednisone (as indicated by the black arrow in Figure 8). With further monitoring and time from B cell depletion, anti-galectin-3 autoantibodies rose during low-dose prednisone maintenance to reach the pre-rituximab response level, a kinetic that likely reflects a contribution from both short-lived plasmablasts as well as long-lived plasma cells to the anti-galectin-3 autoantibody response.
Figure 8.
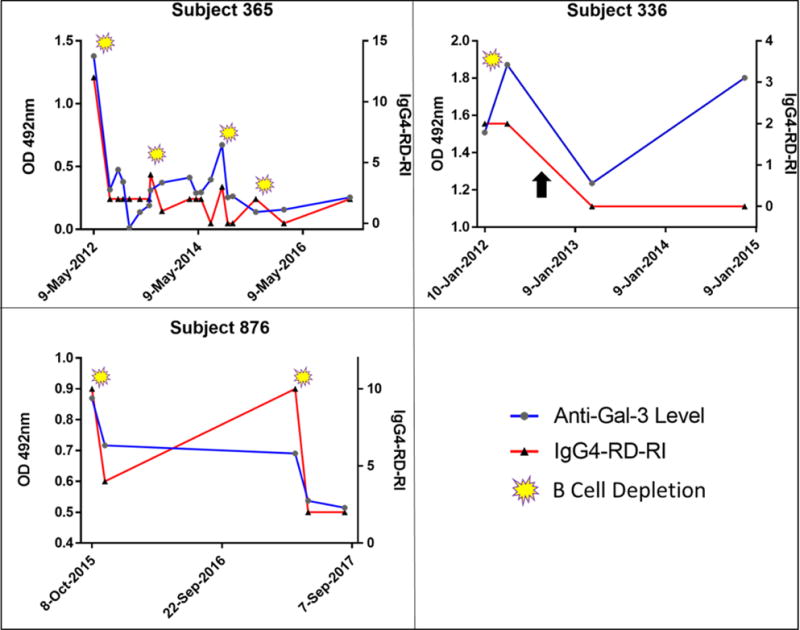
Three subjects with positive anti-Galectin-3 antibody responses studied longitudinally by ELISA and plotted against IgG4-RD-Responder Index (RI) on the right Y-axis. Yellow symbols indicate dates of B cell depletion therapy with rituximab, after which, anti-galectin-3 antibody titers consistently declined. The black arrow in Subject 336 indicates the initiation of low-dose prednisone that successfully maintained remission in this subject with a subsequent rise in anti-galectin-3 response.
Discussion
We used next-generation sequencing, single cell cloning of dominantly-expanded plasmablasts, mAb generation, antigen purification and mass spectrometry as a strategy to identify disease-relevant auto-antigens in a subject with active IgG4-RD. In contrast to all previous studies examining auto-antigens in IgG4-RD, we employed an approach to identify the antigenic specificity of dominantly-expanded plasmablasts. We report the presence of autoantibodies against galectin-3, which were predominantly of the IgG4 isotype.
Galectin-3 is a β-galactoside binding lectin that lacks a signal peptide but can be secreted or adhere to the cell surface.26 It has also been described in the nucleus and in the cytosol. Corresponding to its sub-cellular location, this protein has been noted to play a role in a wide variety of biological processes including apoptosis, cell migration, inflammation and fibrosis.27 Macrophages are the primary cellular source of secreted galectin-3. Galectin-3 has been suggested to contribute to numerous fibroproliferative disease states including pulmonary fibrosis, chronic kidney disease, congestive heart failure and non-alcoholic steatohepatitis.27 Galectin-3 knock out mice demonstrate a marked abrogation in the development of lung, kidney, liver and heart fibrosis compared to their wild type counterparts, suggesting a mechanistic contribution of galectin-3 to fibrogenesis28,29,30,31 Inhibition of galectin-3 was shown to mitigate the development of pulmonary fibrosis in the bleomycin mouse model32 and an inhaled galectin-3 inhibitor is currently being investigated for use in IPF with a phase IIa study recently completed.33 In systemic sclerosis, widely viewed as a prototypic human fibrotic disease, elevated circulating galectin-3 levels were shown to be the strongest predictor of all-cause and cardiovascular mortality after multi-variate analysis.25
Proteomic analysis of pancreatic tissue from IgG4-RD subjects revealed that tissue galectin-3 was among the proteins with the highest level of differential expression with a 13-fold higher level in diseased compared to healthy pancreata.24 Tissue immunofluorescence based analyses of IgG4-RD tissues demonstrated that a diverse collection of both stromal and immune cells express galectin-3, including macrophages, dendritic cells and myofibroblasts.24 In addition, interstitial staining for galectin-3 is consistent with the fact that this protein has both secreted and intra-cellular forms. This work further characterized galectin-3 expression in many affected tissues in IgG4-RD including lymph nodes, lung, salivary gland, pancreas, kidney, aorta, retroperitoneum and bile ducts.24 Interestingly, diseased lymph nodes were found to have the highest number of galectin-3 positive cells per high power field compared to all other organs studied, and this was also approximately 8-fold higher than the number of positive cells observed in normal lymph nodes. These data, in conjunction with our observations that IgG4 anti-galectin-3 autoantibodies correlate with both elevated plasma levels of galectin-3 and lymph node involvement, support the notion that protein overexpression may sometimes contribute to auto-antibody formation. We tested our IgG4-RD cohort for anti-galectin-3 autoantibody responses using plasma from each subject’s initial clinical encounter as a means of ensuring the highest frequency of untreated and active patients. Thus, it is not possible for us to determine which alteration occurs first, the over-expression of galectin-3 or the development of anti-galectin-3 autoantibodies. This answer must await further studies.
The pathophysiologic significance of anti-galectin 3 antibodies remains unknown. These antibodies could either reflect an attempt to attenuate the disease process or they may actually be of causal significance. IgG4 is known to bind poorly to activating Fc receptors and does not fix complement efficiently compared to other IgG subclasses. Consistent with the inability of IgG4 to fix complement, we did not observe any significant elevation in C-reactive protein or complement consumption in the subgroup with IgG4 anti-galectin-3 autoantibody responses compared to those without. IgG4 anti-galectin-3 antibodies could potentially reflect an attempt to mitigate the pro-fibrotic function of galectin-330 These autoantibodies may sterically interfere with galectin-3 induced myofibroblast proliferation and collagen secretion, thereby tempering the fibrotic process.
In contrast, IgG4 anti-galectin-3 antibodies could be of direct pathogenic significance in IgG4-RD. Spontaneous germinal center formation and accentuated autoreactivity have recently been observed in Gal3−/− mice suggesting that galectin-3 negatively regulates germinal center formation.35 IgG4 anti-galectin-3 autoantibodies may enhance inflammation and autoimmunity by interfering with the inhibitory role of galectin-3 in germinal center responses. These anti-galectin-3 autoantibodies may thus accelerate plasmablast differentiation, immunoglobulin production, follicular helper T cell expansion and further autoantibody development. Activated B cells and plasmablasts that arise in germinal centers and infiltrate tissue sites are likely to be important for the re-activation of CD4+CTLs and may thus contribute to the inflammatory pathology observed in this disease. In addition to IgG4-specific autoantibody responses, we also observed IgE anti-galectin-3 responses in a subset of patients. While the infiltrate of IgG4-RD is not composed of a large fraction of mast cells or basophils, a mild to moderate eosinophilic component is often observed.36 It is possible that IgE anti-galectin-3 antibodies may be activating eosinophils by Fcε receptor binding. However, given the lack of a preponderant eosinophilic infiltrate in this disease, and the relatively miniscule amount of IgE in the blood compared to IgG4, it is unlikely that IgE autoantibodies play a large role in the pathophysiology of IgG-RD. Why they occur is likely an immunologic epiphenomenon possibly related to the fact that both IgG4 and IgE class switch recombination are driven at least in part by IL-4 secreting T follicular helper cells.
Approaching auto-antigen discovery through the lens of dominantly expanded plasmablasts detected autoantibodies that correlate with lymphadenopathy. It is possible, but not yet proven, that the additional use of this approach might yield a diverse collection of auto-antigens associated with IgG4-RD. We speculate that expanding our identification of disease-relevant auto-antigens may provide a tool to cluster patients by autoantibody specificity with corresponding organ manifestation, similar to what has been exemplified in systemic lupus erythematosus. By exploring the antigenic specificity of dominantly-expanded plasmablasts, we have gained further insight into the oligoclonal restriction observed among plasmablasts in this disease.2 In the case of galectin-3 as an auto-antigen, the association of auto-antibodies with over-expression of this protein, suggests that this specific immune response and the clonal expansion of plasmablasts in the index subject occurred secondary to rather than being the cause of the underlying disease. In the microenvironment of tumefactive lesions as in IgG-4RD, similar to malignant tumors, many proteins may accumulate to pathologic levels. Therefore, over time and without treatment, IgG4-RD may beget additional antigenic triggers, which could either amplify or attempt to quell the fibro-inflammatory process depending on the predominant autoantibody subclass response.
In summary, we have validated a multi-step approach to antigen discovery using next-generation sequencing, single cell cloning of dominantly-expanded plasmablasts, unbiased antigen purification and mass spectrometry. We have identified galectin-3, a protein that contributes to the pathophysiology of IgG4-RD, as an antigenic target. Future work will expand upon this approach by generating additional mAbs from dominantly-expanded plasmablast clones as a means of examining the antigenic diversity of IgG4-RD. The possibility that activated B cell populations other than plasmablasts also comprise sources of relevant immunodominant antibodies in individual subjects must also be explored. These studies can then be extended to determine if linear peptides within the same antigens are recognized in an appropriate MHC class II context by T follicular helper cells and CD4+CTLs in subjects with IgG4-RD.
Supplementary Material
Capsule Summary.
Using dominantly-expanded plasmablast clones, we have identified IgG4 and IgE anti-galectin-3 autoantibodies in IgG4-RD, which correlate with IgG4 levels, lymphadenopathy and over-expression of galectin-3.
Acknowledgments
This study was funded by NIH U19 AI110495 to Dr. Pillai. Dr. Perugino was supported by NIH T32 AR007258 and Dr. Mahajan was supported by AI 113163 from the NIH. Dr. Wallace has received support through a Scientist Development Award from the Rheumatology Research Foundation and the NIH Loan Repayment Program. Dr. Della-Torre was supported by FIRA Onlus and Collegio Ghislieri di Pavia (Italy). The MGH flow core is supported by grant S10RR023440 from the NIH.
Footnotes
CONFLICT OF INTEREST
The authors declare that they have no relevant conflict of interest.
References
- 1.Wallace ZS, Deshpande V, Mattoo H, Mahajan V, Kulikova M, Pillai S, et al. IgG4-related disease. clinical and laboratory features in one hundred twenty-five patients. Arthritis Rheum. 2015;67:2466–2475. doi: 10.1002/art.39205. [DOI] [PMC free article] [PubMed] [Google Scholar]
- 2.Mattoo H, Mahajan V, Della-Torre E, Sekigami Y, Carruthers M, Wallace ZS, et al. De novo oligoclonal expansions of circulating plasmablasts in active and relapsing IgG4-related disease. J Allergy Clin Immunol. 2014;134:679–687. doi: 10.1016/j.jaci.2014.03.034. [DOI] [PMC free article] [PubMed] [Google Scholar]
- 3.Wallace ZS, Mattoo H, Carruthers M, Mahajan VS, Della Torre E, Lee H, et al. Plasmablasts as a biomarker for IgG4-related disease, independent of serum IgG4 concentrations. Ann Rheum Dis. 2015;74:190–195. doi: 10.1136/annrheumdis-2014-205233. [DOI] [PMC free article] [PubMed] [Google Scholar]
- 4.Mattoo H, Mahajan VS, Maehara T, Deshpande V, Della-Torre E, Wallace ZS, et al. Clonal expansion of CD4+ cytotoxic T lymphocytes in patients with IgG4-related disease. J Allergy Clin Immunol. 2016;138:825–838. doi: 10.1016/j.jaci.2015.12.1330. [DOI] [PMC free article] [PubMed] [Google Scholar]
- 5.Mattoo H, Della-Torre E, Mahajan V, Stone J, Pillai S. Circulating Th2 memory cells in IgG4 Related Disease are restricted to a defined subset of subjects with atopy. Allergy. 2014;69:399–402. doi: 10.1111/all.12342. [DOI] [PMC free article] [PubMed] [Google Scholar]
- 6.Nishimori I, Yamamoto Y, Okazaki K, Morita M, Yamamoto Y, et al. Identification of Autoantibodies to a Pancreatic Antigen in Patients with Idiopathic Chronic Pancreatitis and Sjogren’s Syndrome. Pancreas. 1994;9(3):374–381. doi: 10.1097/00006676-199405000-00015. [DOI] [PubMed] [Google Scholar]
- 7.Okazaki K, Uchida K, Ohana M, Nakase H, Chia T, et al. Autoimmune-related Pancreatitis is Associated with Autoantibodies and a Th1/Th2-type Cellular Immune Response. Gastroenterology. 2000;118:573–581. doi: 10.1016/s0016-5085(00)70264-2. [DOI] [PubMed] [Google Scholar]
- 8.Asada M, Nishio A, Uchida K, Kido M, Ueno S, Uza N, et al. Identification of a Novel Autoantibody Against Pancreatic Secretory Trypsin Inhibitor in Patients with Autoimmune Pancreatitis. Pancreas. 2006;33:20–26. doi: 10.1097/01.mpa.0000226881.48204.fd. [DOI] [PubMed] [Google Scholar]
- 9.Endo T, Takizawa S, Tanaka S, Takahashi M, Kobayashi T, et al. Amylase alpha-2A Autoantibodies. Novel Marker of Autoimmune Pancreatitis and Fulminant Type 1 Diabetes. Diabetes. 2009;58:732–737. doi: 10.2337/db08-0493. [DOI] [PMC free article] [PubMed] [Google Scholar]
- 10.Frulloni L, Lunardi C, Simone R, Dolcino M, Puccetti A, et al. Identification of a Novel Antibody Associated with Autoimmune Pancreatitis. N Eng J Med. 2009;361:2135–2142. doi: 10.1056/NEJMoa0903068. [DOI] [PubMed] [Google Scholar]
- 11.Lohr JM, Faissner R, Koczan D, Bewerunge P, Kloppel G, et al. Autoantibodies against the exocrine pancreas in autoimmune pancreatitis: gene and protein expression profiling and immunoassays identify pancreatic enzymes as a major target of the inflammatory process. Am J Gastroenterol. 2010;105(9):2060–2071. doi: 10.1038/ajg.2010.141. [DOI] [PMC free article] [PubMed] [Google Scholar]
- 12.Hubers LM, Vos H, Schuuman AR, Erken R, Oude Elferink RP, et al. Annexin A11 is targeted by IgG4 and IgG1 autoantibodies in IgG4-related disease. Gut. 2017 Aug 1; doi: 10.1136/gutjnl-2017-314548. pii: gutjnl-2017-314548. [Epub ahead of print] [DOI] [PubMed] [Google Scholar]
- 13.Du H, Shi L, Chen P, Yang W, Chen G, et al. Prohibitin is Involved in Patients with IgG4 Related Disease. Plos One. 2015;10(5):e0125331. doi: 10.1371/journal.pone.0125331. [DOI] [PMC free article] [PubMed] [Google Scholar]
- 14.Shiokawa M, Kodama Y, Kuriyama K, Yoshimura K, Tomono T, Morita T, et al. Pathogenicity of IgG in patients with IgG4-related disease. Gut. 2016 Aug;65:1322–1332. doi: 10.1136/gutjnl-2015-310336. [DOI] [PubMed] [Google Scholar]
- 15.Carruthers MN, Topazian MD, Khosroshahi A, Witzig TE, Wallace ZS, Hart PH, et al. Rituximab for IgG4-related disease: a prospective, open-label trial. Ann Rheum Dis. 2015;74:1171–1177. doi: 10.1136/annrheumdis-2014-206605. [DOI] [PubMed] [Google Scholar]
- 16.Carruthers MN, Stone JH, Deshpande V, Khosroshahi A. Development of an IgG4-RD Responder Index. Int J Rheumatol. 2012;2012:259408. doi: 10.1155/2012/259408. [DOI] [PMC free article] [PubMed] [Google Scholar]
- 17.Tiller T, Meffre E, Yurasov S, Tsuiji M, Nussenzweig MC, Wardemann H. Efficient generation of monoclonal antibodies from single human B cells by single cell RT-PCR and expression vector cloning. J Immunol Methods. 2008;329:112–124. doi: 10.1016/j.jim.2007.09.017. [DOI] [PMC free article] [PubMed] [Google Scholar]
- 18.Edwards A, Haas W. Multiplexed Quantitative Proteomics for High-Throughput Comprehensive Proteome Comparisons of Human Cell Lines. Methods Mol Biol. 2016;1394:1–13. doi: 10.1007/978-1-4939-3341-9_1. [DOI] [PubMed] [Google Scholar]
- 19.Ting L, Rad R, Gygi SP, Haas W. MS3 eliminates ratio distortion in isobaric multiplexed quantitative proteomics. Nat Methods. 2011 Oct 2;8(11):937–940. doi: 10.1038/nmeth.1714. [DOI] [PMC free article] [PubMed] [Google Scholar]
- 20.Nisihara R1, Kubis MM, Rodrigues PC, Skare T, Mocelin V, Utiyama S. Antinuclear antibodies and rheumatoid factor positivity in healthy elderly adults: a cross-sectional study in 336 individuals. J Am Geriatr Soc. 2013 Nov;61(11):2044–6. doi: 10.1111/jgs.12533. [DOI] [PubMed] [Google Scholar]
- 21.Jeannin P, Lecoanet S, Delneste Y, Gauchat JF, Bonnefoy JY. IgE versus IgG4 production can be differentially regulated by IL-10. J Immunol. 1998;160:3555–3561. [PubMed] [Google Scholar]
- 22.Soussi T. p53 antibodies in the sera of patients with various types of cancer: a review. Cancer Res. 2000 Apr 1;60(7):1777–1788. [PubMed] [Google Scholar]
- 23.Melero JA, Stitt DT, Mangel WF, Carroll RB. Identification of new polypeptide species (48-55K) immunoprecipitable by antiserum to purified large T antigen and present in simian virus 40-infected and transformed cells. J Virol. 1979;93:466–480. doi: 10.1016/0042-6822(79)90250-2. [DOI] [PubMed] [Google Scholar]
- 24.Salah A, Yoshifuji H, Ito S, Kitagori K, Kiso K, Yamada N, et al. High Expression of Galectin-3 in Patients with IgG4-Related Disease: A Proteomic Approach. Patholog Res Int. 2017:9312142. doi: 10.1155/2017/9312142. [DOI] [PMC free article] [PubMed] [Google Scholar]
- 25.Faludi R, Nagy G, Tokes-Fuzesi M, Kovacs K, Czirjak L, Komocsi A. Galectin-3 is an independent predictor of survival in systemic sclerosis. Int J Cardiology. 2017;233:118–124. doi: 10.1016/j.ijcard.2016.12.140. [DOI] [PubMed] [Google Scholar]
- 26.Cherayil BJ, Weiner SJ, Pillai S. The Mac-2 antigen is a galactose-specific lectin that binds IgE. J Exp Med. 1989 Dec 1;170(6):1959–1972. doi: 10.1084/jem.170.6.1959. [DOI] [PMC free article] [PubMed] [Google Scholar]
- 27.Li L, Li J, Gao J. Functions of Galectin-3 and Its Role in Fibrotic Diseases. J Pharmacol Exp Ther. 2014;351:336–343. doi: 10.1124/jpet.114.218370. [DOI] [PubMed] [Google Scholar]
- 28.Mackinnon AC, Gibbons MA, Farnworth SL, Leffler H, Nilsson UJ, Delaine T, et al. Regulation of transforming growth factor-β-1 driven lung fibrosis by galectin-3. Am J Respir Crit Care Med. 2012;185:537–546. doi: 10.1164/rccm.201106-0965OC. [DOI] [PMC free article] [PubMed] [Google Scholar]
- 29.Henderson NC, Mackinnon AC, Farnworth SL, Kipari T, Haslett C, Iredale JP, et al. Galectin-3 expression and secretion links macrophages to the promotion of renal fibrosis. Am J Pathol. 2008;172:288–298. doi: 10.2353/ajpath.2008.070726. [DOI] [PMC free article] [PubMed] [Google Scholar]
- 30.Henderson NC, Mackinnon AC, Farnworth SL, Poirier F, Russo FP, Iredale JP, et al. Galectin-3 regulates myofibroblast activation and hepatic fibrosis. Proc Natl Acad Sci USA. 2006;103:5060–5065. doi: 10.1073/pnas.0511167103. [DOI] [PMC free article] [PubMed] [Google Scholar]
- 31.Yu L, Ruifrok WP, Meissner M, Bos EM, van Goor H, Sanjabi B, et al. Genetic and pharmacological inhibition of galectin-3 prevents cardiac remodeling by interfering with myocardial fibrogenesis. Circ Heart Fail. 2013;6:107–117. doi: 10.1161/CIRCHEARTFAILURE.112.971168. [DOI] [PubMed] [Google Scholar]
- 32.Mackinnon AC, Gibbons MA, Farnworth SL, Leffler H, Nilsson UJ, Delaine T, et al. Regulation of transforming growth factor-β-1 driven lung fibrosis by galectin-3. Am J Respir Crit Care Med. 2012;185:537–546. doi: 10.1164/rccm.201106-0965OC. [DOI] [PMC free article] [PubMed] [Google Scholar]
- 33.Hirani N, Mackinnon A, Nicol L, Ford P, Schambye H, et al. Td139, A Novel Inhaled Galectin-3 Inhibitor for the Treatment of Idiopathic Pulmonary Fibrosis (IPF). Results from the First in (IPF) Patients Study; Poster session presented at the American Thoracic Society 2017 International Conference; Washington, DC. 2017. May, [Google Scholar]
- 34.Maehara T, Mattoo H, Mahajan VS, Murphy SJH, Yuen GJ, Ishiguro N, Ohta M, Moriyama M, Saeki T, Yamamoto H, Yamauchi M, Daccache J, Kiyoshima T, Nakamura S, Stone JH, Pillai S. The expansion in lymphoid organs of IL-4+ BATF+ T follicular helper cells is linked to IgG4 class switching in vivo. Life Science Alliance. doi: 10.26508/lsa.201800050. (in press) [DOI] [PMC free article] [PubMed] [Google Scholar]
- 35.Beccaria CG, Amezcua Vesely MC, Fiocca Vernengo F, Gehrau RC, Ramello MC, et al. Galectin-3 deficiency drives lupus-like disease by promoting spontaneous germinal centers formation via IFN-γ. Nat Commun. 2018;9(1):1628. doi: 10.1038/s41467-018-04063-5. [DOI] [PMC free article] [PubMed] [Google Scholar]
- 36.Deshpande V, Zen Y, Chan JK, Yi EE, Sato Y, Stone JH, et al. Consensus statement on the pathology of IgG4-related disease. Modern Pathology. 2012;25:1181–1192. doi: 10.1038/modpathol.2012.72. [DOI] [PubMed] [Google Scholar]
Associated Data
This section collects any data citations, data availability statements, or supplementary materials included in this article.


