Abstract
Diabetes mellitus is associated with cognitive impairment and various central nervous system pathologies such as stroke, vascular dementia, or Alzheimer’s disease. The exact pathophysiology of these conditions is poorly understood. Recent reports suggest that hyperglycemia causes cerebral microcirculation pathology and blood-brain barrier (BBB) dysfunction and leakage. The majority of these reports, however, are based on methods including in vitro BBB modeling or streptozotocin-induced diabetes in rodents, opening questions regarding the translation of the in vitro findings to the in vivo situation, and possible direct effects of streptozotocin on the brain vasculature. Here we used a genetic mouse model of hyperglycemia (Ins2AKITA) to address whether prolonged systemic hyperglycemia induces BBB dysfunction and leakage. We applied a variety of methodologies to carefully evaluate BBB function and cellular integrity in vivo, including the quantification and visualization of specific tracers and evaluation of transcriptional and morphological changes in the BBB and its supporting cellular components. These experiments did neither reveal altered BBB permeability nor morphological changes of the brain vasculature in hyperglycemic mice. We conclude that prolonged hyperglycemia does not lead to BBB dysfunction, and thus the cognitive impairment observed in diabetes may have other causes.
Introduction
Chronic hyperglycemia constitutes the major systemic risk factor for microvascular complications in diabetes mellitus (DM), such as retinopathy1 and nephropathy2. Recent evidence also links hyperglycemia with cognitive deficits, as well as with central nervous system (CNS) pathologies including vascular dementia, stroke, and Alzheimer’s disease3,4. The underlying causes of hyperglycemia-induced CNS complications are poorly understood and likely multifactorial. It has been suggested that blood-brain barrier (BBB) damage may play a role5, a hypothesis supported by data from in vitro models of the BBB, as well as animal studies (reviewed in Prasad et al.6). However, modeling the full complexity of the BBB in vitro is currently not possible, weakening any extrapolation of the results to the in vivo situation. Also the animal studies, which were based on hyperglycemia induced by the beta cell toxin streptozotocin7,8, have caveats. Firstly, streptozotocin may not be entirely selective in its toxic activity; its effect could be broader9 and even directly target the brain vasculature. Secondly, hyperglycemia elicited by streptozotocin and similar drugs shows extensive inter-individual variability and depends on administration method, dosage, genetic background and other factors10. Finally, visualization and quantification of BBB permeability is still challenging, and different protocols may lead to different results. Therefore, whether hyperglycemia causes BBB dysfunction remains an open question.
The usage of genetic models of DM, such as the Ins2AKITA mouse, constitutes a novel approach for studying hyperglycemia complications in vivo. The Ins2AKITA mouse has a point mutation in the Ins2 gene resulting in a conformational change in the protein that leads to its accumulation in pancreatic beta cells causing cell death11. This toxicity is completely specific to the Ins2-expressing beta cells, thus mimicking human type 1 DM. Heterozygous male Ins2AKITA mice display a non-obese phenotype and develop consistent hyperglycemia, hypoinsulinemia, polydipsia, and polyuria around the age of 4 weeks11. Thus, the Ins2AKITA mouse constitutes a clear advance over chemically-induced DM, as the primary insult is beta cell-specific. Additionally, this mouse model is stable and reproducible and hence allows longitudinal studies of hyperglycemia complications.
In our study, we sought to determine whether prolonged hyperglycemia causes BBB dysfunction and leakage in the mouse brain by using several state-of-the-art methodologies to characterize BBB dysfunction. We conducted our studies in Ins2AKITA heterozygous males and littermate wild-type controls. The Ins2AKITA mice yielded consistent, prolonged hyperglycemia throughout the study. BBB leakage was studied in long-term hyperglycemic animals by injecting different exogenous tracers intravenously12. BBB integrity was studied by quantifying and visualizing these injected tracers in the CNS12,13. Complementarily, we analyzed whether hyperglycemia leads to transcriptional or morphological changes in the mouse brain microvasculature. In sum, these methods failed to demonstrate increased BBB permeability in Ins2AKITA mice.
Collectively, our results – along with the study by Corem and Ben-Zvi (submitted) - lead us to conclude that persistent systemic hyperglycemia per se does not cause BBB permeability in the mouse brain. In the light of novel studies in human DM patients showing an association with BBB leakage and dementia14, our study suggests that factors other than hyperglycemia contribute to BBB dysfunction.
Material and Methods
Animals
Male heterozygous Ins2AKITA mice11 (referred here as Ins2AKITA) and littermate wild-type controls (referred here as WT) were used for this study. Mice were purchased from Jackson Labs (Bar Harbor, ME) on a C57Bl/6-J background and bred in house at the Scheele Animal House, Karolinska Institute. Animals were housed in Allentown XJ type II long cages (Allentown, NJ), with 12/12 h light-dark cycle and access to water and standard chow ad libitum. Cage bedding was changed 2–3 times per week due to polyuria. Glycemia (Bayer Contour, Solna, Sweden; range 0.6–33.3 mmol/l) and body weight were monitored weekly from 6 weeks of age. Mice were sacrificed between 26 to 38 weeks of age, and samples collected. All animals were sacrificed between 10–11 AM. The procedures were carried out in accordance with institutional and national Swedish policies following approval from the Animal Ethical Board of Northern Stockholm.
Immunohistochemistry
Mice were perfused transcardially under full anesthesia (hypnorm-midazolam cocktail) with Hank’s Buffered Salt Solution (HBSS, cat. #14025092, Life Technologies, Sweden) followed by 4% paraformaldehyde (PFA) in Phosphate Buffered Saline (PBS). Tissues were removed and postfixed in 4% PFA in PBS for 4 h at 4 °C. Fifty μm brain sagittal vibratome sections were incubated in blocking/permeabilization solution (1% bovine serum albumin (BSA), 0.5% TritonX-100 (Sigma-Aldrich, St. Louis, MO) in PBS overnight at 4 °C, followed by incubation in primary antibody solution for 48 h at 4 °C, and subsequently in secondary antibody solution, overnight at 4 °C. Sections were mounted in Prolong Gold anti-fade reagent with DAPI (cat. #P36930, Thermo Fischer Scientific, Sweden). Primary antibodies used: goat anti-mouse PECAM1 (cat. #AF3628, R&D Systems, Abingdon, UK), rat anti-mouse Laminin α-2 chain (LAMA2) (cat. #Ab11576, Abcam, Cambridge, UK), rat anti-mouse ANPEP (cat. #MCA2183EL, AbD Serotec); rabbit anti-mouse Collagen IV (cat. #2150–1470, Bio-Rad Antibodies, Oxford, UK); rabbit anti-GLUT1 (cat. #07–1401, Millipore, Billerica, MA); rat anti-mouse PDGFR-β (cat. #14–1402, Thermo Fischer Scientific), rabbit anti-Vitronectin (VTN) (cat. #GWB-794F8F, Genway Biotech, San Diego, CA), rabbit anti-Desmin (DES) (cat. #Ab15200-1, Abcam), rat anti-GFAP (cat. #13-0300, Thermo Fischer Scientific), rabbit anti-AIF1 (cat. #019-19741, Wako, Neuss, Germany). Secondary antibodies for multiple labelling (donkey anti-rat, donkey anti-rabbit, donkey anti-goat) conjugated with the appropriate fluorescent dyes were from Thermo Fischer Scientific or Jackson ImmunoResearch (West Grove, PA). As a negative control the sections were incubated with secondary antibodies only. Image processing was done using Volocity 64 (Improvision, Coventry, UK), Fiji, Adobe Photoshop CS6, and Adobe Illustrator CS6 (Adobe Systems, San José, CA). All immunohistochemistry images were taken with Leica TCS SP8 confocal microscope (Leica Microsystems, Wetzlar, Germany) and presented as maximum intensity reconstructions of confocal z-stacks.
Quantification of pericyte coverage
Pericyte coverage was quantified as previously reported15. Briefly, 3D confocal images were projected with maximum intensity projection from 10 μm thick z-stacks, contrast enhanced, de-speckled, smoothened, and a threshold was set to generate a binary image. These images were then subjected to ‘dilate’ and ‘close’ commands prior to running the AnalyzeSkeleton plug-in in Fiji (https://fiji.sc/). Total skeletal length was calculated for both PECAM1 stained images (all vessels) and ANPEP stained images (pericyte-covered vessels), and the ratio of the vessel lengths was used as a measurement of coverage. One to three fields per mouse were acquired with 20× objective from cerebral cortex of seven WT and six Ins2AKITA mice. All image processing was done automatically with a custom macro designed in Fiji.
Quantification of microglia processes
Three fields per mouse were acquired with 40× objective from cerebral cortex of six WT and seven Ins2AKITA mice. Ten μm thick confocal stacks of AIF1 stained brain sections were analyzed with Imaris ×64 8.3.1 software (Bitplane, Belfast, UK). Microglia filament length in μm was measured in 3D-mode by filament module.
Intravenous injection and detection of leakage tracers
To address BBB permeability, we injected intravenously either Evans Blue dye (EB, 2% in PBS, Sigma Aldrich, Saint Louis, MO) or lysine-fixable cadaverine conjugated to Alexa Fluor 488 or 555 (1 KDa, 5 mg/ml in 0.9% NaCl, Invitrogen). Circulation time was overnight for EB and 2 h for cadaverine. As a positive control for EB leakage we used pdgfbret/ret mice12. Animals were subsequently perfused transcardially with PBS for 5′ and brains removed. Successful cadaverine injections were verified by examining kidneys of injected animals under a fluorescence stereomicroscope (Leica Microsystems). Quantification of extravasated EB or cadaverine in the brain parenchyma was performed as published12,16.
Microvasculature isolation for quantitative PCR and RNA sequencing
Purification of microvasculature was performed as described17 with modifications. Briefly, after collagenase A treatment, brain tissue was first gently pressed through a 100 μm and then through a 40 μm cell strainer. The tissue homogenate was incubated with rat anti-PECAM1 antibody-coated magnetic beads (Dynabeads, Invitrogen, cat. #11035) at 4 °C for 1 h. Microvascular fragments adherent to magnetic beads were washed 6 times with HBSS containing 1% BSA followed by 2 times with HBSS alone. Microvasculature fragments were lysed in 350 μl RLT buffer (Qiagen, Hilden, Germany).
Quantitative PCR
Total RNA was isolated from whole cerebral cortex or purified brain microvasculature using RNeasy Mini kit (Qiagen). RNA was DNase-treated (Invitrogen) and samples were cleaned using RNeasy Mini-elute Cleanup Kit (Qiagen). cDNA was synthesized from 1 ug of total RNA using Superscript III (Invitrogen) and mRNA expression quantified by Taqman assays (Applied Biosystems) for mouse Pdgfrb (Mm00435546_m1_FAM), Rgs5 (Mm00654112_m1), Gfap (Mm01253033_FAM) and mouse Gapdh (Mm99999915_g1_FAM) in the purified brain microvasculature samples and for mouse Gfap (Mm01253033_FAM) and mouse Hprt (Mm03024075_m1_FAM) in the cerebral cortex samples. Reference genes Gapdh and Hprt were used for ΔΔCt calculations. Gene of interest expression was presented as fold change over reference gene.
RNA sequencing library preparation
RNA integrity and concentration of the isolated brain microvasculature was checked with the Agilent RNA 6000 pico kit and the Agilent 2100 Bioanalyzer (Agilent Biotechnologies, Santa Clara, CA). For conversion of the RNA to a cDNA library for Illumina sequencing, the SMARTer® Stranded Total RNA Sample Prep Kit - Low Input Mammalian kit was used according to the manufacturer’s protocol (Clontech, Mountain View, CA). The total RNA was depleted from rRNA and tRNA’s with the RiboGone- Mammalian kit (Clontech) prior to library construction.
RNA sequencing data analysis
The RNA-seq libraries were prepared as previously described18. The samples were sequenced on an Illumina HiSeq. 2500 sequencer at Science for Life laboratory (SciLife Lab), Uppsala sequencing node. The sequence reads were mapped to the Ensembl mouse gene assembly (version: NCBIM37) using TopHat2 software (version 2.0.4)19, and the duplicated reads were filtered using the Picard tool (version 1.92, http://broadinstitute.github.io/picard/). Statistical tests were performed using the Cufflinks tool (version 2.2.1)20. Gene expression levels in brain microvasculature between the Ins2AKITA and WT mice were compared, and the genes with multiple-test corrected p < 0.05 were identified as significantly differentially expressed genes. The sequence data is deposited in NCBI GEO, accession number GSE113919.
Statistical analysis
Data are presented as mean ± SEM. For two group comparisons two-tailed, unpaired student’s t test was performed (Prism v5.01, GraphPad, La Jolla, CA). A p-value of ≤0.05 was considered statistically significant.
Results
The effect of hyperglycemia on blood-brain barrier permeability
We first checked blood glucose levels in WT and Ins2AKITA mice. As reported elsewhere21–23, Ins2AKITA animals had elevated glycemia at 6 weeks of age as compared to WT mice (Fig. 1a). By 11 weeks, Ins2AKITA animals were consistently hyperglycemic (>20 mmol/l), whereas WT mice remained normoglycemic (<10 mmol/l) throughout the experiment (Fig. 1a). Due to hypoinsulinemia, body weight in Ins2AKITA mice reached a plateau by 7 weeks of age (≈20 g), while WT animals continued to gain weight normally (Fig. 1b).
Figure 1.
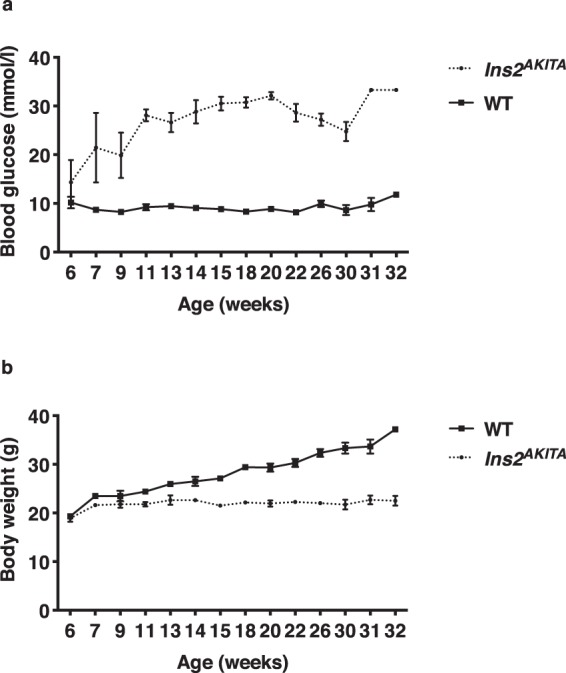
(a) Fasting blood glucose levels (mmol/l) and (b) body weight (g) of male Ins2AKITA and WT littermate controls. Data is presented as mean ± SEM. n = 2 to 15 mice.
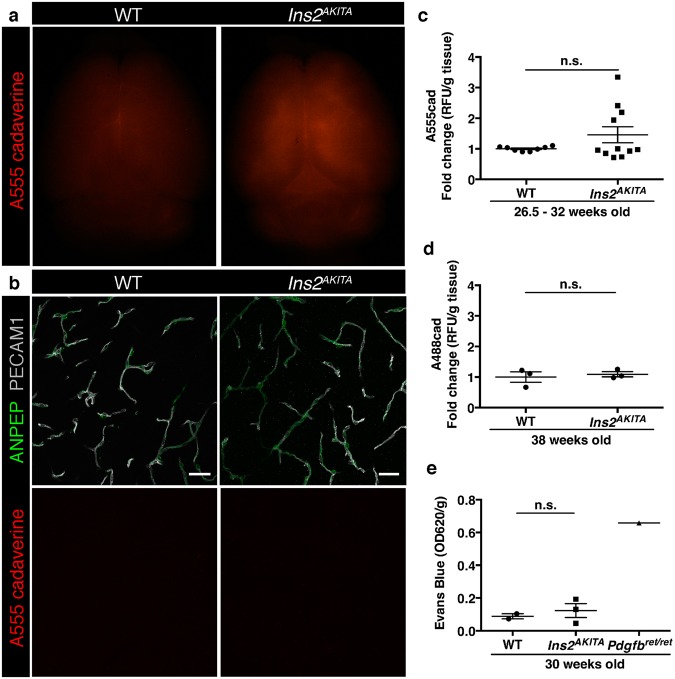
We then sought to address the effect of prolonged hyperglycemia on BBB permeability. We used two well-established methods to quantify vascular permeability in brain tissue12. Firstly, we injected the fluorescent tracer cadaverine-Alexa Fluor 488 or 555 (1 kDa) intravenously and perfused the animals after the dye had been circulating for 2 h. We could not detect a significant difference in tracer accumulation in brains between Ins2AKITA and WT mice, either by microscopical visualization (Fig. 2a,b) or by fluorescence quantification (Fig. 2c). Additional analyses of BBB permeability in older mice (38 weeks of age) also failed to detect increased cadaverine extravasation into the brain of hyperglycemic mice (Fig. 2d). Secondly, we investigated whether larger molecular weight tracer and longer circulation time could reveal a compromised BBB function upon hyperglycemia. Thus, we intravenously injected the azo dye Evans Blue, which binds to albumin in the circulation, and allowed it to circulate overnight. As shown in Fig. 2e, quantification of Evans Blue accumulation in the brain was not significantly different between Ins2AKITA and WT mice. As a positive control for BBB permeability, we quantified Evan’s blue extravasation in Pdgfbret/ret mice, a model of pericyte deficiency that reproducibly shows tracer leakage into the brain12 (Fig. 2e). The results obtained by these analyses lead us to conclude that long-term hyperglycemia does not cause any significant vascular leakage in the mouse brain.
Figure 2.
Blood-brain barrier permeability measurements in male Ins2AKITA and WT littermate controls. (a) Representative stereomicroscope fluorescence images of brains showing 1 kDa Alexa Fluor 555 cadaverine permeability in Ins2AKITA and WT after 2 h of dye circulation (n = 2). (b) Representative confocal images of coronal sections of 1 kDa Alexa Fluor 555 cadaverine injected mouse brains. ANPEP positive mural cells, green; PECAM1 positive vasculature, white. No Alexa Fluor 555 cadaverine leakage into brain parenchyma was observed either in Ins2AKITA or WT mice (n = 2, scale bar 30 μm). (c) Quantification of 1 kDa Alexa Fluor 555 cadaverine permeability in 26.5–32 week-old Ins2AKITA and WT mice after 2 h circulation (n = > 8, 3 independent experiments). y-axis shows the fold change in relative fluorescence units (RFU) per gram of brain tissue in relation to WT. (d) Quantification of 1 kDa Alexa Fluor 488 cadaverine permeability in 38 week-old Ins2AKITA and WT mice after 2 h circulation (n = 3). y-axis shows the fold change in relative fluorescence units (RFU) per gram of brain tissue in relation to WT. (e) Evans Blue dye permeability in 30 week-old Ins2AKITA and WT littermate control mice after overnight circulation (n = > 2). y-axis shows optical density (OD) at 620 nm per gram of tissue. PdgfbRet/Ret served as positive control for tracer leakage into the brain parenchyma. n.s., not significant, student’s t test. Data is presented as mean ± SEM.
Study of pericyte coverage of Ins2AKITA and WT brain capillaries
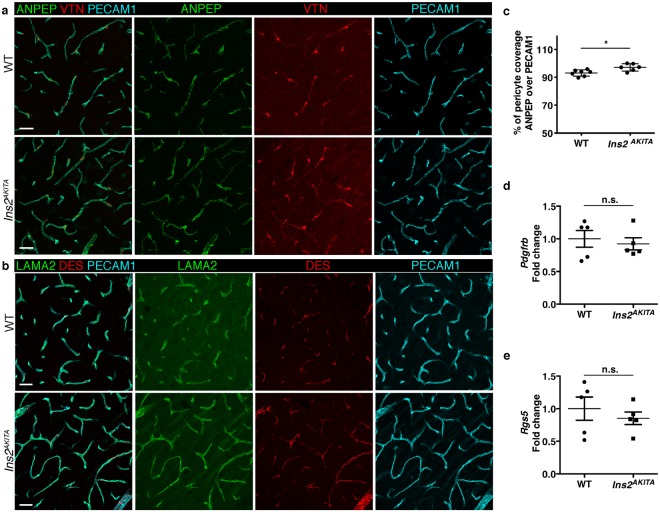
Pericyte loss is one of the earliest events in diabetic retinopathy24,25, therefore we sought to analyze pericyte coverage of brain capillaries in hyperglycemic and WT mice. First, we analyzed pericyte coverage by immunohistochemistry (Fig. 3a,b). We stained endothelial cells by PECAM1 and pericytes by ANPEP and DES. We also analyzed the abundance of pericyte-derived extracellular matrix proteins VTN and LAMA212,18. These immunostainings did not reveal any vascular abnormalities or aberrant pericyte coverage of brain capillaries from both Ins2AKITA and WT mice (Fig. 3a,b). Furthermore, none of the four pericyte markers analyzed displayed abnormal expression as judged by their pattern of immunoreactivity (Fig. 3a,b). Unexpectedly, pericyte coverage, quantified as the percentage of the PECAM1+ endothelium covered by ANPEP+ pericytes, was significantly increased in Ins2AKITA as compared to WT (Fig. 3c).
Figure 3.
Characterization of pericyte coverage and pericyte-specific gene and protein expression in 26.5–32 week-old Ins2AKITA and WT littermate controls. (a,b) Representative images of pericyte-specific protein expression in WT and Ins2AKITA mice, (a) Aminopeptidase N (ANPEP, green) and Vitronectin (VTN, red); (b) Laminin alpha 2 (LAMA2, green) and desmin (DES, red). Endothelium visualized with PECAM1, cyan. n = 2, scale bar 30 μm. (c) The skeletal length of PECAM1 positive capillaries and ANPEP positive pericytes in Ins2AKITA and WT was measured and plotted as the percentage of the pericyte length over vessel length (n = 6, *p = 0.0125, student’s t test). (d,e) qPCR analysis on isolated brain microvasculature fragments for pericyte-specific gene Pdgfrb (d) and Rgs5 (e). WT controls are set as 1 and Ins2AKITA results are presented as fold change over WT (n = 5). n.s. = not significant, student’s t test. Data is presented as mean ± SEM.
We then obtained mRNA from isolated microvascular fragments, containing endothelial cells, pericytes, and astrocyte end-feet17. In agreement with our immunohistochemistry results, we did not detect differences in mRNA expression of pericyte-specific genes (Pdgfrb and Rgs5) by quantitative, real-time PCR (Fig. 3d,e).
Collectively, these results suggest that hyperglycemia does not cause decreases in pericyte coverage or changes in pericyte-specific gene or protein expression in the mouse brain.
Brain vascular transcriptome analysis
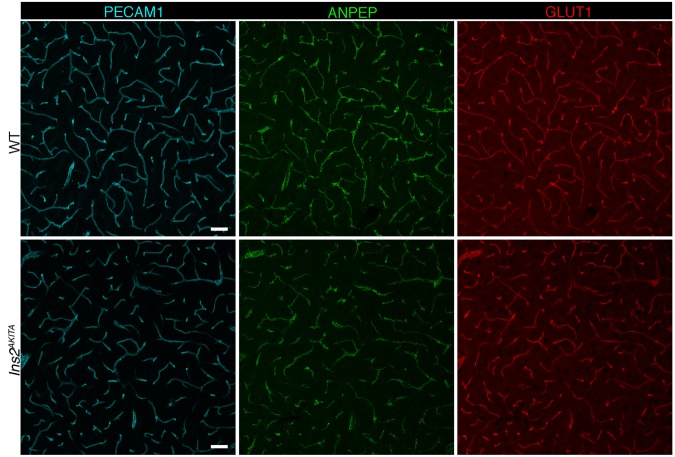
To take a more comprehensive effort in characterizing the brain vasculature upon hyperglycemia, we extracted mRNA from brain microvasculature fragments isolated from Ins2AKITA and WT mice and analyzed their transcriptome by RNA sequencing (Table 1). Twenty-three genes were significantly changed in Ins2AKITA as compared to WT. One gene, Pin1, was found to be upregulated in Ins2AKITA mice, whereas the remaining 22 were downregulated. We checked the cellular origin of the 23 dysregulated genes according to the recently described molecular atlas of the mouse brain vasculature13. Only 4 genes were clearly associated with endothelial cell expression (Table 1), while the remaining 19 had a broad expression pattern spanning at least 2 different cell types. We did not find differentially regulated genes related to the tight junctions at the BBB, nor known genes mediating endothelium-pericyte interactions. Of relevance for the hyperglycemic status of the Ins2AKITA mice, Slc2a1 (Glut1) was 1.8-fold downregulated in Ins2AKITA (Table 1). Immunohistochemistry analysis of SLC2A1 did not reveal an aberrant pattern of expression, however, a slightly weaker immunofluorescent staining was noticed in Ins2AKITA as compared to WT (Fig. 4).
Table 1.
RNA sequencing of microvascular fragments. Differentially expressed genes in Ins2AKITA (n = 2) when compared to WT (n = 3) littermate controls. In the mouse brain, Gata2, Sema3G, Slc2a1, and Gm694 displayed restricted endothelial expression.
| Gene symbol | FPKM_WT | FPKM_Ins2AKITA | log2(Ins2AKITA/WT) | p_value |
|---|---|---|---|---|
| Pin1 | 9.54 | 21.42 | 1.17 | 5.00E-05 |
| Slc2a1 | 191.65 | 105.16 | −0.87 | 5.00E-05 |
| Akap8l | 66.40 | 35.47 | −0.90 | 1.00E-04 |
| Miat | 57.07 | 28.77 | −0.99 | 1.00E-04 |
| Col6a1 | 30.61 | 15.40 | −0.99 | 1.00E-04 |
| Rtl1 | 36.01 | 18.07 | −0.99 | 5.00E-05 |
| Net1 | 40.09 | 20.02 | −1.00 | 1.00E-04 |
| Snrnp70 | 124.68 | 55.12 | −1.18 | 5.00E-05 |
| Igsf9b | 22.51 | 9.66 | −1.22 | 5.00E-05 |
| A930011O12Rik | 55.76 | 23.81 | −1.23 | 5.00E-05 |
| Col11a1 | 11.91 | 4.92 | −1.28 | 5.00E-05 |
| Sik1 | 16.27 | 6.69 | −1.28 | 5.00E-05 |
| A230050P20Rik | 60.28 | 24.05 | −1.33 | 5.00E-05 |
| Txnip | 55.65 | 21.76 | −1.35 | 1.00E-04 |
| Usp36 | 30.32 | 11.76 | −1.37 | 5.00E-05 |
| Plat | 36.59 | 14.13 | −1.37 | 5.00E-05 |
| Sema3g | 15.04 | 5.75 | −1.39 | 5.00E-05 |
| Galntl2 | 10.79 | 3.47 | −1.64 | 1.00E-04 |
| Gata2 | 19.73 | 6.13 | −1.69 | 5.00E-05 |
| Stxbp2 | 53.89 | 15.51 | −1.80 | 5.00E-05 |
| Apex2 | 16.89 | 3.32 | −2.35 | 1.00E-04 |
| E2f6 | 146.50 | 13.42 | −3.45 | 5.00E-05 |
| Gm694 | 9.75 | 0.00 | 5.00E-05 |
The rest of the genes had a broad expression pattern (FPKM, fragments per kilobase of exon per million reads mapped).
Figure 4.
Representative image of immunostaining corresponding to the glucose transporter protein SLC2A1 (GLUT1) in 30 week-old Ins2AKITA and WT cerebral cortex. Mural cells (ANPEP, green), glucose transporter 1 (GLUT1, red), endothelium (PECAM1, cyan). n = 2, scale bar 50 µm.
Analysis of glial cells
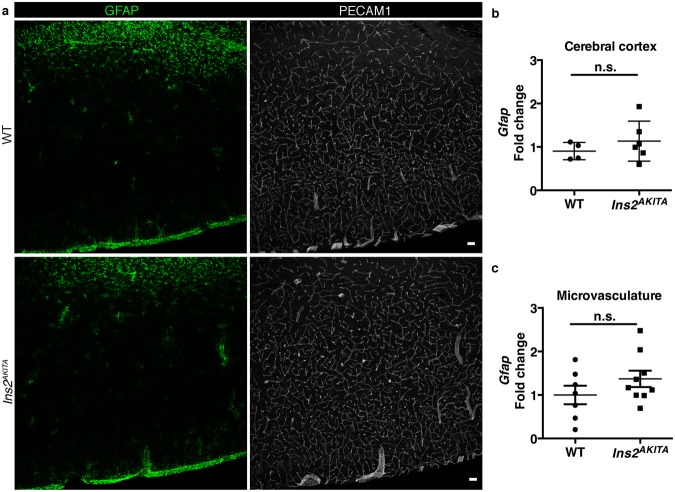
Hyperglycemia has been reported to cause early morphological and gene expression changes in glial cells, particularly in astrocytes and microglia26. We analyzed astrocytes by GFAP immunostaining. Additionally, we measured Gfap mRNA expression in the cerebral cortex homogenates and from isolated brain microvasculature fragments. GFAP immunohistochemistry did not reveal any differences between Ins2AKITA and WT brains (Fig. 5a). Gfap mRNA expression was found to be unchanged in Ins2AKITA mice when compared to WT (Fig. 5b,c). We conclude that hyperglycemia does not cause major changes in astrocytic GFAP expression in the mouse brain.
Figure 5.
Characterization of reactive astrocytes in 26.5–32-week-old Ins2AKITA and WT littermate controls. (a) Representative image of reactive astrocytes in Ins2AKITA and WT cerebral cortex, astrocytes (GFAP, green), vasculature (PECAM1, white) (n = 5, scale bar 50 μm). (b) Total cerebral cortex Gfap mRNA expression in Ins2AKITA (n = 6) and WT (n = 4) mice presented as fold change over Hprt reference gene expression. (c) Gfap mRNA expression from isolated cerebral microvascular fragments of Ins2AKITA and WT mice presented as fold change over Gapdh reference gene (n = 7). n.s. = not significant, Student’s t test.
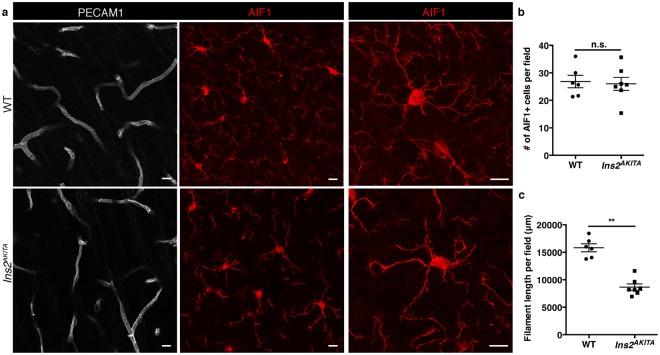
We then studied microglial cells by immunohistochemistry on brain sections from Ins2AKITA and WT mice. AIF1+ immunoreactivity was readily detected (Fig. 6a), with no differences in AIF1+ cell numbers between Ins2AKITA and WT mice (Fig. 6b). However, the morphology of the AIF1+ cells was remarkably different. In WT, the cell processes were long and highly ramified (Fig. 6a). In contrast, Ins2AKITA AIF1+ cells had an apparent larger cell body and significantly shorter and less ramified processes (Fig. 6a,c). These morphological changes are consistent with the description of “activated” retinal microglia caused by hyperglycemia23,26.
Figure 6.
Characterization of microglia in 26.5–32 week-old Ins2AKITA and WT littermate controls. (a) Representative images of microglia (AIF1, red) in Ins2AKITA and WT cerebral cortex. Vasculature is stained with anti-PECAM1 antibody. Notice the fewer microglial processes in Ins2AKITA cerebral cortex when compared to WT, scale bars 10 μm (n = 6). (b) Quantification of the number of AIF1 + microglia per field in WT and Ins2AKITA cerebral cortex (n = 6), n.s. = not significant, student’s t test. (c) Quantification of the microglial filament length per field (μm) (n = 6), **p = 0.0012, student’s t test.
Discussion
The question whether hyperglycemia causes BBB permeability has been addressed in numerous reports6. Unfortunately, however, differences in experimental design and divergent and sometimes contradictory results between studies preclude consistent conclusions. This is not entirely surprising, however. The extremely delicate BBB architecture in vivo, including important features such as blood flow and its metabolic regulation (neurovascular coupling), makes it impossible to extrapolate in vitro results to the in vivo scenario. Previous animal studies are also problematic, since they applied chemically induced hyperglycemia7,8. Although popular, this technique has problems with specificity9,27–29 and variability as it depends on administration route, dosage, and genetic background10.
The advent of genetic mouse models, such as the Ins2AKITA mouse11, offers the opportunity of studying the effect of hyperglycemia without many of the above-mentioned confounding factors. To date, a few reports have addressed the role of hyperglycemia on the blood-retinal barrier (BRB) in Ins2AKITA mouse. Two studies found early signs of retinopathy including pericyte loss and increased BRB permeability21,30. Subsequently, it was shown that the presence of the rd8 mutation in the Crb1 gene – causing retinal degeneration31 - might account for the previous observations of advanced retinal pathology23. To the best of our knowledge, no studies of the BBB structure and function in Ins2AKITA mice have previously been reported.
In the present study, we aimed at evaluating hyperglycemia-induced BBB permeability by employing highly specific tools. Firstly, a range of well-established techniques for the study of BBB and neurovascular unit (NVU) integrity12,13, and secondly, a robust mouse model of hyperglycemia, the Ins2AKITA, were used. Our data clearly show that prolonged systemic hyperglycemia does not elicit BBB dysfunction and leakage in the mouse brain. Moreover, different cellular and molecular components at the NVU appear intact in Ins2AKITA mice, such as endothelial cells, pericytes, astrocytes, and basement membrane. Based on our results and the Corem and Ben-Zvi (submitted), we propose that hyperglycemia-induced BBB leakage is likely negligible.
Transcriptional analysis of microvascular fragments comparing hyperglycemic animals and WT controls revealed Slc2a1 to be 1.8-fold downregulated in brain vessel-fragments from Ins2AKITA animals (Table 1). Analysis of glucose transport in the brains of human patients has been controversial, with methods employed differing from surrogate tissues for SLC2A1 expression in the brain32 to transient hyperglycemia conditions in healthy human beings33. Others have shown a decrease in glucose uptake in experimental non-obese DM animals34. Our study shows that Slc2a1 is downregulated at the transcriptional level specifically in the hyperglycemic mouse brain vasculature. Of note, allelic disorders associated with SLC2A1 mutations, glucose-deficiency syndrome, epilepsy, and dystonia, are associated with cognitive disability35. Thus, downregulation of SLC2A1 on brain blood vessels due to hyperglycemia could lead to metabolic changes in neural tissue leading to cognitive dysfunction especially after repeated hypoglycemic episodes.
Interestingly, the only gene that was found to be upregulated in Ins2AKITA mice was Pin1, a phospho-serine/threonine-proline isomerase that has been implicated in cellular proliferation. Pin1 has previously been reported to be upregulated in an in vitro model of hyperglycemia and in the aorta of streptozotocin-induced diabetic mice, resulting in mitochondrial oxidative stress, vascular relaxation dysfunction and vascular inflammation36. Thus, our results imply that even if hyperglycemia-induced upregulation of Pin1 might cause similar stresses to the brain vasculature, these do not induce significant BBB disruption.
Our analysis of microglia showed that these cells change their morphology in Ins2AKITA mice into a more amoeboid-like shape with shorter and thicker processes compared to the highly ramified process morphology seen in WT brains. Our findings are consistent with an “activated” microglial response. How the microglia is activated is unknown, but it has been suggested that hyperglycemia can potentially activate retinal microglia through a variety of molecular mechanisms37. Furthermore, it is hypothesized that permeability at the BRB contributes to the microglia activation37. Our results reveal the same morphological changes in the hyperglycemic mouse brain than these already reported in retinas23. Because the integrity of the BBB and NVU are preserved in the Ins2AKITA mice, other microglial activating factors than BBB permeability should be considered.
The association between DM and different brain pathologies is an underexplored but emerging research area. BBB dysfunction is commonly found in conditions such as Alzheimer’s disease, and it is therefore tempting to speculate that hyperglycemia-induced BBB permeability is the underlying mechanism of brain pathology in human DM patients14. However, even the most prevalent microvascular DM complications, such as retinopathy or nephropathy, do not affect all DM patients38. Beyond hyperglycemia, other DM features, such as hyperglycemia/hypoglycemia cycles, dyslipidemia, or genetic susceptibility should be considered as possible causal factors for these pathologies. Our results presented herein show that hyperglycemia has minor, if any, effect on BBB permeability, and therefore fails to support increased BBB leakage as an underlying cause of DM-related brain pathologies.
Acknowledgements
The authors thank the Scheele Animal house personnel for excellent animal care, and C. Olsson, H. Leksell, P. Peterson, and J. Chmielniakova for technical assistance. This work was supported by the Swedish Cancer Society [grant numbers CAN-2016-0777, 150735]; the Swedish Research Council [grant number 2015-00550]; the European Research Council [grant number AdG294556]; the Leducq Foundation [grant number 14CVD02]; and the Knut and Alice Wallenberg Foundation [Grant number 2015.0030].
Author Contributions
M.A.M., A.K., C.B. and G.G. conceived and designed the project. M.A.M., T.L., G.B., E.R., M.V., K.N., A.D., J.J.H. and B.L. performed experiments. L.H. performed bioinformatics analysis. M.A.M. and G.G. wrote the manuscript with substantial input from C.B. All authors reviewed the manuscript.
Data Availability
The dataset generated and analyzed during the current study is available in NCBI GEO, accession number GSE113919 (https://www.ncbi.nlm.nih.gov/geo/query/acc.cgi?acc = GSE113919).
Competing Interests
The authors declare no competing interests.
Footnotes
Publisher’s note: Springer Nature remains neutral with regard to jurisdictional claims in published maps and institutional affiliations.
Contributor Information
Maarja Andaloussi Mäe, Email: maarja.andaloussi_mae@igp.uu.se.
Guillem Genové, Email: guillem.genove@ki.se.
References
- 1.Antonetti DA, Klein R, Gardner TW. Diabetic retinopathy. N. Engl. J. Med. 2012;366:1227–1239. doi: 10.1056/NEJMra1005073. [DOI] [PubMed] [Google Scholar]
- 2.Thomas MC, et al. Diabetic kidney disease. Nat Rev Dis Primers. 2015;1:15018. doi: 10.1038/nrdp.2015.18. [DOI] [PMC free article] [PubMed] [Google Scholar]
- 3.Kodl CT, Seaquist ER. Cognitive dysfunction and diabetes mellitus. Endocr. Rev. 2008;29:494–511. doi: 10.1210/er.2007-0034. [DOI] [PMC free article] [PubMed] [Google Scholar]
- 4.Bogush M, Heldt NA, Persidsky Y. Blood Brain Barrier Injury in Diabetes: Unrecognized Effects on Brain and Cognition. J Neuroimmune Pharmacol. 2017;12:593–601. doi: 10.1007/s11481-017-9752-7. [DOI] [PMC free article] [PubMed] [Google Scholar]
- 5.Sweeney MD, Sagare AP, Zlokovic BV. Blood-brain barrier breakdown in Alzheimer disease and other neurodegenerative disorders. Nat Rev Neurol. 2018;14:133–150. doi: 10.1038/nrneurol.2017.188. [DOI] [PMC free article] [PubMed] [Google Scholar]
- 6.Prasad S, Sajja RK, Naik P, Cucullo L. Diabetes Mellitus and Blood-Brain Barrier Dysfunction: An Overview. J Pharmacovigil. 2014;2:125. doi: 10.4172/2329-6887.1000125. [DOI] [PMC free article] [PubMed] [Google Scholar]
- 7.Huber JD, VanGilder RL, Houser KA. Streptozotocin-induced diabetes progressively increases blood-brain barrier permeability in specific brain regions in rats. Am. J. Physiol. Heart Circ. Physiol. 2006;291:H2660–8. doi: 10.1152/ajpheart.00489.2006. [DOI] [PubMed] [Google Scholar]
- 8.Salameh TS, Shah GN, Price TO, Hayden MR, Banks WA. Blood-Brain Barrier Disruption and Neurovascular Unit Dysfunction in Diabetic Mice: Protection with the Mitochondrial Carbonic Anhydrase Inhibitor Topiramate. J. Pharmacol. Exp. Ther. 2016;359:452–459. doi: 10.1124/jpet.116.237057. [DOI] [PMC free article] [PubMed] [Google Scholar]
- 9.Muller YD, et al. Immunosuppressive effects of streptozotocin-induced diabetes result in absolute lymphopenia and a relative increase of T regulatory cells. Diabetes. 2011;60:2331–2340. doi: 10.2337/db11-0159. [DOI] [PMC free article] [PubMed] [Google Scholar]
- 10.Deeds MC, et al. Single dose streptozotocin-induced diabetes: considerations for study design in islet transplantation models. Lab. Anim. 2011;45:131–140. doi: 10.1258/la.2010.010090. [DOI] [PMC free article] [PubMed] [Google Scholar]
- 11.Yoshioka M, Kayo T, Ikeda T, Koizumi A. A novel locus, Mody4, distal to D7Mit189 on chromosome 7 determines early-onset NIDDM in nonobese C57BL/6 (Akita) mutant mice. Diabetes. 1997;46:887–894. doi: 10.2337/diab.46.5.887. [DOI] [PubMed] [Google Scholar]
- 12.Armulik A, et al. Pericytes regulate the blood-brain barrier. Nature. 2010;468:557–561. doi: 10.1038/nature09522. [DOI] [PubMed] [Google Scholar]
- 13.Vanlandewijck M, et al. A molecular atlas of cell types and zonation in the brain vasculature. Nature. 2018;554:475–480. doi: 10.1038/nature25739. [DOI] [PubMed] [Google Scholar]
- 14.Janelidze S, et al. Increased blood-brain barrier permeability is associated with dementia and diabetes but not amyloid pathology or APOE genotype. Neurobiol. Aging. 2017;51:104–112. doi: 10.1016/j.neurobiolaging.2016.11.017. [DOI] [PMC free article] [PubMed] [Google Scholar]
- 15.Vanlandewijck M, et al. Functional Characterization of Germline Mutations in PDGFB and PDGFRB in Primary Familial Brain Calcification. PLoS ONE. 2015;10:e0143407. doi: 10.1371/journal.pone.0143407. [DOI] [PMC free article] [PubMed] [Google Scholar]
- 16.Su EJ, et al. Activation of PDGF-CC by tissue plasminogen activator impairs blood-brain barrier integrity during ischemic stroke. Nat Med. 2008;14:731–737. doi: 10.1038/nm1787. [DOI] [PMC free article] [PubMed] [Google Scholar]
- 17.Bondjers C, et al. Microarray analysis of blood microvessels from PDGF-B and PDGF-Rbeta mutant mice identifies novel markers for brain pericytes. FASEB J. 2006;20:1703–1705. doi: 10.1096/fj.05-4944fje. [DOI] [PubMed] [Google Scholar]
- 18.He L, et al. Analysis of the brain mural cell transcriptome. Sci Rep. 2016;6:35108. doi: 10.1038/srep35108. [DOI] [PMC free article] [PubMed] [Google Scholar]
- 19.Kim D, et al. TopHat2: accurate alignment of transcriptomes in the presence of insertions, deletions and gene fusions. Genome Biol. 2013;14:R36. doi: 10.1186/gb-2013-14-4-r36. [DOI] [PMC free article] [PubMed] [Google Scholar]
- 20.Trapnell C, et al. Transcript assembly and quantification by RNA-Seq reveals unannotated transcripts and isoform switching during cell differentiation. Nat. Biotechnol. 2010;28:511–515. doi: 10.1038/nbt.1621. [DOI] [PMC free article] [PubMed] [Google Scholar]
- 21.Barber AJ, et al. The Ins2Akita mouse as a model of early retinal complications in diabetes. Invest Ophthalmol Vis Sci. 2005;46:2210–2218. doi: 10.1167/iovs.04-1340. [DOI] [PubMed] [Google Scholar]
- 22.Choeiri C, et al. Longitudinal evaluation of memory performance and peripheral neuropathy in the Ins2C96Y Akita mice. Behav. Brain Res. 2005;157:31–38. doi: 10.1016/j.bbr.2004.06.005. [DOI] [PubMed] [Google Scholar]
- 23.McLenachan S, Chen X, McMenamin PG, Rakoczy EP. Absence of clinical correlates of diabetic retinopathy in the Ins2Akita retina. Clin. Experiment. Ophthalmol. 2013;41:582–592. doi: 10.1111/ceo.12084. [DOI] [PubMed] [Google Scholar]
- 24.Beltramo E, Porta M. Pericyte loss in diabetic retinopathy: mechanisms and consequences. Curr. Med. Chem. 2013;20:3218–3225. doi: 10.2174/09298673113209990022. [DOI] [PubMed] [Google Scholar]
- 25.Ferland-McCollough D, Slater S, Richard J, Reni C, Mangialardi G. Pericytes, an overlooked player in vascular pathobiology. Pharmacol. Ther. 2017;171:30–42. doi: 10.1016/j.pharmthera.2016.11.008. [DOI] [PMC free article] [PubMed] [Google Scholar]
- 26.Sorrentino FS, Allkabes M, Salsini G, Bonifazzi C, Perri P. The importance of glial cells in the homeostasis of the retinal microenvironment and their pivotal role in the course of diabetic retinopathy. Life Sci. 2016;162:54–59. doi: 10.1016/j.lfs.2016.08.001. [DOI] [PubMed] [Google Scholar]
- 27.Biswas J, Gupta S, Verma DK, Singh S. Streptozotocin alters glucose transport, connexin expression and endoplasmic reticulum functions in neurons and astrocytes. Neuroscience. 2017;356:151–166. doi: 10.1016/j.neuroscience.2017.05.018. [DOI] [PubMed] [Google Scholar]
- 28.Biswas J, et al. Streptozotocin Induced Neurotoxicity Involves Alzheimer’s Related Pathological Markers: a Study on N2A Cells. Mol. Neurobiol. 2016;53:2794–2806. doi: 10.1007/s12035-015-9144-z. [DOI] [PubMed] [Google Scholar]
- 29.Hidmark AS, Nawroth PP, Fleming T. STZ causes depletion of immune cells in sciatic nerve and dorsal root ganglion in experimental diabetes. J. Neuroimmunol. 2017;306:76–82. doi: 10.1016/j.jneuroim.2017.03.008. [DOI] [PubMed] [Google Scholar]
- 30.Smith SB, et al. In vivo protection against retinal neurodegeneration by sigma receptor 1 ligand (+)−pentazocine. Invest Ophthalmol Vis Sci. 2008;49:4154–4161. doi: 10.1167/iovs.08-1824. [DOI] [PMC free article] [PubMed] [Google Scholar]
- 31.Mattapallil MJ, et al. The Rd8 mutation of the Crb1 gene is present in vendor lines of C57BL/6N mice and embryonic stem cells, and confounds ocular induced mutant phenotypes. Invest Ophthalmol Vis Sci. 2012;53:2921–2927. doi: 10.1167/iovs.12-9662. [DOI] [PMC free article] [PubMed] [Google Scholar]
- 32.Garg M, Thamotharan M, Becker DJ, Devaskar SU. Adolescents with clinical type 1 diabetes display reduced red blood cell glucose transporter isoform 1 (GLUT1) Pediatr Diabetes. 2014;15:511–518. doi: 10.1111/pedi.12127. [DOI] [PMC free article] [PubMed] [Google Scholar]
- 33.Hasselbalch SG, Knudsen GM, Capaldo B, Postiglione A, Paulson OB. Blood-brain barrier transport and brain metabolism of glucose during acute hyperglycemia in humans. J. Clin. Endocrinol. Metab. 2001;86:1986–1990. doi: 10.1210/jcem.86.5.7490. [DOI] [PubMed] [Google Scholar]
- 34.Duelli R, et al. Increased cerebral glucose utilization and decreased glucose transporter Glut1 during chronic hyperglycemia in rat brain. Brain Res. 2000;858:338–347. doi: 10.1016/S0006-8993(00)01942-9. [DOI] [PubMed] [Google Scholar]
- 35.De Giorgis V, Veggiotti P. GLUT1 deficiency syndrome 2013: current state of the art. Seizure. 2013;22:803–811. doi: 10.1016/j.seizure.2013.07.003. [DOI] [PubMed] [Google Scholar]
- 36.Paneni F, et al. Targeting prolyl-isomerase Pin1 prevents mitochondrial oxidative stress and vascular dysfunction: insights in patients with diabetes. Eur. Heart J. 2015;36:817–828. doi: 10.1093/eurheartj/ehu179. [DOI] [PubMed] [Google Scholar]
- 37.Altmann C, Schmidt MHH. The Role of Microglia in Diabetic Retinopathy: Inflammation, Microvasculature Defects and Neurodegeneration. Int J Mol Sci. 2018;19:110. doi: 10.3390/ijms19010110. [DOI] [PMC free article] [PubMed] [Google Scholar]
- 38.Ahlqvist E, van Zuydam NR, Groop LC, McCarthy MI. The genetics of diabetic complications. Nat Rev Nephrol. 2015;11:277–287. doi: 10.1038/nrneph.2015.37. [DOI] [PubMed] [Google Scholar]
Associated Data
This section collects any data citations, data availability statements, or supplementary materials included in this article.
Data Availability Statement
The dataset generated and analyzed during the current study is available in NCBI GEO, accession number GSE113919 (https://www.ncbi.nlm.nih.gov/geo/query/acc.cgi?acc = GSE113919).


