


Abstract
Pho7, a member of the Zn2Cys6 family of fungal transcription factors, is the key transcriptional activator underlying fission yeast phosphate homeostasis, a physiological response to phosphate starvation in which the pho1, pho84 and tgp1 genes are upregulated. Here, we delineated a minimized 61-amino-acid Pho7 DNA-binding domain (DBD) and determined the 1.7 Å crystal structure of the DBD at its target site in the tgp1 promoter. Two distinctive features of the Pho7 DBD are: it binds DNA as a monomer, unlike most other fungal zinc-cluster factors that bind as homodimers; and it makes extensive interactions with its asymmetric target sequence over a 14-bp footprint that entails hydrogen bonding to 13 individual bases within, and remote from, the CGG triplet typically recognized by other Zn2Cys6 DBDs. Base pair substitutions at Pho7 sites in the tgp1 and pho1 promoters highlight the importance of the 5′-CGG triplet for Pho7 binding in vitro and Pho7-dependent gene expression in vivo. We identify several DBD amino acids at which alanine substitution effaced or attenuated the pho1 phosphate starvation response and concordantly reduced Pho7 binding to a pho1 promoter site.
INTRODUCTION
Cells respond to phosphate starvation by inducing the expression of proteins involved in extracellular phosphate mobilization and uptake (1,2). The phosphate regulon in the fission yeast Schizosaccharomyces pombe comprises three genes that specify, respectively, a cell surface acid phosphatase Pho1, an inorganic phosphate transporter Pho84, and a glycerophosphate transporter Tgp1 (3). Transcription of these genes is repressed during growth in phosphate-rich medium and de-repressed during phosphate starvation. Expression of the phosphate-regulated genes depends on Pho7 (3–6), a 738-amino acid protein that belongs to the zinc binuclear cluster family of fungal DNA-binding transcription regulators (7). The Zn2Cys6 transcription factors are defined by a constellation of six cysteines (highlighted in gold in Figure 1A) that coordinate two zinc atoms. Prior studies showed that replacement of the Pho7 cysteines with alanine effaces the fission yeast phosphate starvation response (6).
Figure 1.

Pho7 DNA binding domain. (A) The 738-aa Pho7 polypeptide is depicted as a gray cylinder, with the position of the Zn2Cys6 DNA binding domain (DBD; aa 279–368) highlighted in blue. The amino acid sequence of the DBD is shown, with the six zinc-binding cysteines highlighted in gold. The margins of the DBD C-terminal truncations analyzed in the present study are indicated by reverse arrowheads. The secondary structure elements (two α-helices) revealed by the DBD crystal structure are shown above the amino acid sequence. (B) Aliquots (5 μg) of the indicated recombinant DBD proteins were analyzed by SDS-PAGE. The Coomassie blue-stained gel is shown. The positions and sizes (in kDa) of marker polypeptides are indicated on the left. (C) Truncation defines a minimized DBD. EMSAs were performed using the 32P-labeled tgp1 promoter DNA probe shown at the bottom. The 32P label is indicated by •. The Pho7 binding motif is shown in white font on black background. Reaction mixtures (10 μl) containing 0.5 pmol 32P-labeled DNA, 0.34 μg poly(dI-dC), 50 mM NaCl, and 0, 8, 16 or 32 ng Pho7-DBD were incubated for 10 min at room temperature. The mixtures were analyzed by native PAGE in 0.25× TBE. An autoradiograph of the dried gel is shown.
We recently demarcated an autonomous DNA-binding domain (DBD) of Pho7, from amino acids 279 to 368, that includes the Zn2Cys6 module (Figure 1A). We used the Pho7-DBD in DNase footprinting and electrophoretic mobility shift assays (EMSA) to locate Pho7 recognition sites in the promoters of the pho1 and tgp1 genes to a 12-nucleotide motif 5′-TCG(G/C)(A/T)xxTTxAA (6). We independently identified the same motif as a Pho7 recognition element via in silico analysis of available genome-wide Pho7 ChIP-seq data (3,6). The pho1 promoter contains two Pho7 12-mer recognition elements (sites 1 and 2), in direct repeat orientation and separated by a 20-nucleotide spacer. The Pho7-DBD binds independently and non-cooperatively to these two sites in the pho1 promoter. By contrast, the tgp1 promoter contains a single Pho7 binding site.
The Pho7 DNA recognition site 5′-TCG(G/C)(A/T)xxTTxAA differs from those of other well-studied fungal Zn2Cys6 proteins (e.g. Gal4, Leu3, Hap1, Put3, Ppr1), which typically recognize pairs of CGG triplets that are arranged as inverted, direct or everted repeats (7–13). The fungal Zn2Cys6 proteins that bind to such DNA elements typically do so as homodimers in which the zinc-binding module confers DNA sequence recognition and a downstream α-helix forms a coiled-coil dimer interface. The pho1 promoter site 2 (TCGGAAATTAAA) and tgp1 promoter site (TCGGACATTCAA) that are recognized by Pho7 contain a single CGG triplet. The lack of internal symmetry in the Pho7 DNA binding site raises the prospects that: (i) it might have a unique binding mode in which the component subunits of a homodimer recognize different nucleotide sequence motifs; or (ii) it might bind to DNA as a monomer, à la the Aspergillus transcription factor AlcR (14).
In order to gain deeper insights into Pho7 specificity, and its role in phosphate homeostasis, we co-crystallized the Pho7 DBD bound to its target DNA element in the tgp1 promoter and solved the structure of the complex at 1.7 Å resolution. We report that Pho7 binds DNA as a monomer and does so with distinctive features vis-à-vis other Zn2Cys6 proteins. We educed structure-activity relations in vitro and in vivo via mutagenesis of the DBD and the tgp1 and pho1 promoter elements.
MATERIALS AND METHODS
Pho7 DNA-binding domain
We constructed pET28b-His10Smt3-Pho7-DBD plasmids encoding various iterations of the wild-type or alanine-substituted Pho7 DNA binding domain fused to an N-terminal His10Smt3 module under the transcriptional control of a T7 RNA polymerase promoter. The plasmids were transfected into E. coli BL21(DE3) cells. The procedures for protein production and purification from soluble bacterial lysates by sequential Ni-affinity chromatography, tag-cleavage, tag-removal via Ni-affinity, and gel-filtration steps were as described previously (6). Protein concentrations were determined as described (6).
DNA binding by EMSA
32P-labeled DNA oligonucleotides (prepared with [γ32P]ATP and T4 polynucleotide kinase) were annealed to a 2-fold molar excess of a complementary non-labeled DNA oligonucleotide by heating for 10 min at 95°C followed by slow cooling to 25°C. The radiolabeled DNA duplexes were purified by electrophoresis through a native 12% polyacrylamide gel in 0.25xTBE (22 mM Tris-borate, pH 8.3, 0.5 mM EDTA). The labeled DNA was eluted from an excised gel slice, ethanol-precipitated, and resuspended in 10 mM Tris–HCl, pH 7.4, 1 mM EDTA. EMSA reaction mixtures (10 μl) containing 50 mM Tris–HCl, pH 7.4, 10% glycerol, 340 ng poly(dI-dC) (Sigma), 0.24 or 0.5 pmol 32P-labeled DNA, 50 or 200 mM NaCl (final concentration, as specified in figure legends), and 2 μl of Pho7-DBD (serially diluted in buffer containing 50 mM Tris–HCl, pH 7.4, 250 mM NaCl, 10% glycerol, 0.1% Triton X-100 to attain the ng amounts specified in the figures) were incubated for 10 min at 22°C. The mixtures were analyzed by electrophoresis through a native 6% polyacrylamide gel containing 2.5% (v/v) glycerol in 0.25× or 1× TBE buffer. 32P-labeled DNAs (free and Pho7-bound) were visualized by autoradiography. Where indicated, the extent of DNA binding to Pho7 (as a percentage of total DNA in the sample) was determined by scanning the dried gel with a phosphorimager and analyzing the data in ImageQuant.
Crystallization, diffraction data collection, and structure determination
Equimolar concentrations of HPLC-purified 20-mer DNA oligonucleotides 5′-TCCTTCGGACATTCAAATCA and 5′-GATTTGAATGTCCGAAGGAT (from IDT) were annealed by heating for 10 min at 95°C and slow-cooling to room temperature. A protein–DNA mixture containing 0.63 mM Pho7-(279–339), 0.55 mM duplex DNA, 32 mM Tris–HCl, pH 7.4, 125 mM NaCl and 6% glycerol was prepared and incubated at room temperature for 10 min. An aliquot (1 μl) of the protein–DNA solution was then mixed with an equal volume of precipitant solution containing 100 mM Tris–HCl, pH 7.0, 0.2 M sodium acetate, 32.5% PEG-4000. Crystals were grown at room temperature by hanging drop vapor diffusion against the precipitant solution. The crystals were harvested and directly flash-frozen in liquid nitrogen. X-ray diffraction data were collected from single crystals at APS beamline 24ID-C at Zn absorption peak (1.2827 Å) and at APS beamline 24ID-E at 0.97918 Å (remote). The data were integrated with HKL2000 (15). Phases were obtained using multi-wavelength anomalous dispersion (MAD) from two datasets in SHELX (16) to locate two Zn sites. Automated model building was performed by crank2 (CCP4) (17). Interactive model building was done using O (18). Refinement was accomplished with Phenix (19). Data collection and refinement statistics are presented in Supplementary Table S1.
Assay of Pho1 expression
Aliquots of exponentially growing S. pombe cultures grown in YES (yeast extract with supplements) medium at 30°C were harvested by centrifugation and the cells were washed with water and suspended in water. For phosphate starvation experiments, the cells were harvested, washed in water, adjusted to A600 of ∼0.15 in PMG (Pombe glutamate) medium without phosphate, and then incubated at 30°C for the times specified. To quantify Pho1 acid phosphatase activity, reaction mixtures (200 μl) containing 100 mM sodium acetate (pH 4.2), 10 mM p-nitrophenylphosphate, and cells (0.01 to 0.1 A600 units) were incubated for 5 min at 30°C. The reactions were quenched by adding 1 ml of 1 M sodium carbonate, the cells were removed by centrifugation, and the absorbance of the supernatant at 410 nm was measured. Acid phosphatase activity is expressed as the ratio of A410 (p-nitrophenol production) to A600 (cells). Each datum is the average (±SEM) of at least three phosphatase assays using cells from three independent cultures.
Allelic exchange of pho7-Ala mutants at the pho7 locus
Replacement of the native pho7 locus with a pho7-WT-TAP or pho7-Ala-TAP allele was performed as described previously (6). Correct insertions were verified by Southern blotting and sequencing of PCR-amplified DNA segments to ascertain the presence of the desired allele. To gauge the effect of these mutations on vegetative growth, cultures of S. pombe strains containing the indicated pho7-TAP allele were grown in liquid medium until A600 reached 0.3 to 0.6. The cultures were adjusted to a final A600 of 0.1 and aliquots (5 μl) of serial 5-fold dilutions were spotted on YES agar plates, which were then incubated at 20°C, 25°C, 30°C, 34°C and 37°C. To gauge expression of the Pho7 and Pho7-Ala proteins, we performed Western blotting of whole cell extracts of pho7Δ and pho7-TAP strains grown to mid-log phase in YES medium at 30°C, using a rabbit polyclonal antibody recognizing the TAP tag (Sigma) and rabbit polyclonal anti-Spt5 antibody (20) as a loading control. The procedures for extract preparation and immunoblotting were as described (6).
RESULTS
Defining a minimized DNA binding domain of Pho7
The autonomous Pho7-DBD identified previously (aa 279–368) was serially truncated from the C-terminus in order to demarcate a minimized functional DBD (Figure 1A). Recombinant proteins Pho7-(279–368), Pho7-(279–359), Pho7-(279–347), and Pho7-(279–339) were produced in E. coli and purified (Figure 1B). EMSA experiments were performed to gauge their binding to a 5′ 32P-labeled 24-bp DNA duplex comprising the Pho7 site of the tgp1 promoter (Figure 1C). Each version of the DBD bound to the tgp1 site to form a single protein–DNA complex of retarded electrophoretic mobility. The distance between the free DNA and the shifted complex correlated with the size of the DBD polypeptide (Figure 1C). The extents of DNA binding to the tgp1 promoter element as a function of input DBD did not vary between the four DBD constructs tested (Figure 1C), nor did their binding to the site 2 sequence of the pho1 promoter (not shown). Thus, the 61-aa segment of Pho7 from aa 279 to 339 suffices for DNA binding.
Structure of the Pho7 DBD in complex with its DNA recognition site
Pho7-(279–339) was co-crystallized with a 19-bp DNA duplex (with 3′A and 3′T single-nucleotide overhangs) that corresponds to the Pho7 site of the tgp1 promoter (Figure 2B). MAD phases from the two Zn atoms were used to solve the structure of the protein–DNA complex at 1.7 Å resolution (Rwork/Rfree = 18.8/21.5; Supplementary Table S1). The refined Pho7 protein comprised a continuous polypeptide from Gly279 to Lys336 (denoted by N and C in Figure 2A); the three C-terminal residues were disordered. The six zinc-binding cysteines (Cys292, Cys295, Cys302, Cys308, Cys311, Cys318) are located within and flanking two α-helices (aa 293–298 and 309–314) and a connecting loop (aa 299–308) (Figure 1A). Each zinc atom (green spheres in Figure 2B, with surrounding anomalous difference density in red mesh) is coordinated tetrahedrally to four cysteines: Zn1 to Cys292, Cys295, Cys302, Cys308; and Zn2 to Cys292, Cys308, Cys311, Cys318 (Figure 2B). The proximal α-helix of the zinc-binding module inserts into the DNA major groove over the 5′-TCG base pairs (Figure 2A and B). The fold of the zinc-binding module is stabilized by a salt-bridge between Arg306 and Asp320 and via hydrogen bonding of Arg306 to the Arg290, Asp303, and Ala305 main-chain carbonyls (Figure 2B). The N-terminal (aa 279–289) and C-terminal (aa 323–336) protein segments flanking the zinc-binding module adopt an extended conformation that drapes continuously over (and penetrates into) the DNA minor groove over a 11-bp span (5′-GGACATTCAAA) (Figure 2A).
Figure 2.

Structure of Pho7 DBD bound to tgp1 site DNA. (A) Global stereo view of the Pho7–DNA complex with the DNA depicted as a stick model, with an overlying transparent surface model to highlight the major and minor grooves. The Pho7 protein is rendered as a cartoon trace with cyan α-helices; the two zinc atoms are shown as green spheres. The N and C termini of the DBD are labeled. (B) A detailed stereo view focused on the interactions of the DBD with the DNA major groove over the 5′-TCGG base pairs. The DNA is shown as a stick model with gray carbons and a gold cartoon trace through the backbone phosphates. The 5′-TCGG ‘top strand’ nucleobases are labeled in blue bold font. Selected amino acids in the DBD are depicted as stick models with beige carbons and labeled in plain black font for side-chains and black italic font for main-chains. Pho7–DNA hydrogen bonds and selected intra-Pho7 hydrogen bonds are indicated by black dashed lines. Cysteine–zinc interactions are denoted by green dashed lines. Anomalous difference density for the zinc atoms, contoured at 4σ, is shown in red mesh.
The DNA when bound to Pho7-DBD is a B-form helix, but it deviates in conformation from an idealized B-form duplex. Pho7 binding alters the helical axis to elicit a 9° bend (Supplementary Figure S1A) (21). The DNA minor groove widens over the 5′-TTCG and 5′-TCA segments and narrows over the intervening 5′-ACAT segment (Supplementary Figure S1B) (22).
Structural basis for DNA recognition
Pho7 makes an extensive network of amino acid side-chain and main-chain contacts with the DNA nucleobases and backbone phosphates across a 14-bp segment of the tgp1 promoter, 5′-T1C2G3G4A5C6A7T8T9C10A11A12A13T14 (henceforth numbered starting from the first T nucleotide of the consensus Pho7 binding motif); these are illustrated in two-dimensional cartoon format in Figure 3C, wherein protein-nucleobase interactions are in red font and protein-phosphate contacts are in black font. A detailed stereo view highlighting the Pho7–DNA interface in the major groove over the 5′-T1C2G3G4 base pairs is shown in Figure 2B. Hydrogen bonding between amino acids and nucleobase edge atoms accounts nicely for Pho7 specificity, as follows. Lys300-Nζ makes bifurcated base-specific contacts to the thymine-O4 atom of the T1:A pair and the guanine-O6 atom of the C2:G pair. The Asp298 main-chain carbonyl makes a base-specific hydrogen bond with the cytosine N4 of the C2:G pair. Asn299-Nδ and the Asn299 main-chain carbonyl make base-specific hydrogen bonds to the guanine-O6 and cytosine-N4 atoms of the G3:C pair, respectively (Figure 2B). Phosphate hydrogen bonds to this major groove segment are made by Gln296-Nϵ and the Cys302 main-chain amide (Figure 2B).
Figure 3.

The Pho7–DNA interface. (A) Detailed stereo view focused on the interactions of the DBD in the minor groove over the 5′-GAC base pairs. The 3′-CTG ‘bottom strand’ nucleobases are labeled in blue bold font. (B) Detailed stereo view focused on the interactions of the DBD in the minor groove over the 5′-TCAA base pairs. Selected bases are labeled in blue bold font. Pho7–DNA hydrogen bonds are indicated by black dashed lines in panel A and B. (C) Cartoon diagram summarizing Pho7–DNA contacts. The DNA is depicted as a two-dimensional base pair ladder with the ‘top’ (5′-CGG triplet-containing) strand on the right and the complementary bottom strand on the left. Amino acids that contact particular backbone phosphates are labeled to the left and right of the phosphates (depicted as magenta spheres) in plain black font for side-chain phosphate contacts and italic black font for main-chain phosphate contacts, as indicated by the arrows pointing at the phosphates. Amino acids that contact particular nucleobases are labeled in red font (plain for protein side-chain interactions with bases and italics for main-chain contacts), as indicated by the arrows pointing at the bases.
A stereo view of the minor groove interface, focusing on the 5′-G4A5C6 base pairs, is shown in Figure 3A. Here we see that the Arg284 side chain penetrates the narrow minor groove to make bidentate hydrogen bonds with cytosine-O2 of the G4:C pair and thymine-O2 of the A5:T pair. These interactions of Arg284 are seemingly pyrimidine-specific and thus favor a Pu:Pyr base pair at the fourth and fifth positions of the Pho7 consensus binding motif (6). Gln287 also penetrates the minor groove to make a hydrogen bond from Oϵ to guanine-N2 of the C6:G pair (Figure 3A). Pho7 makes multiple hydrogen bonds to the minor groove phosphates on both strands of this DNA segment. The extended N-terminal polypeptide of the DBD interacts with the phosphates via Lys282-Nζ, Lys283-Nζ, Lys301-Nζ, and the main-chain amides of Arg284, Ala291 and Cys302 (Figure 3A). The extended C-terminal polypeptide contacts the phosphates through hydrogen bonds from the Arg323 side chain and the Lys324 main-chain amide (Figure 3A).
The minor groove interface over the 5′-T9C10A11A12A13 base pairs (Figure 3B) highlights multiple protein-nucleobase contacts. Arg326 makes bidentate hydrogen bonds with thymine-O2 of the T9:A pair and cytosine-O2 of the C10:G pair. Arg332 makes bidentate hydrogen bonds with guanine-N3 of the C10:G pair and thymine-O2 of the A11:T pair. The Tyr335-OH makes bifurcated hydrogen bonds to thymine-O2 of the A11:T pair and adenine-N3 of the A12:T pair (Figure 3B). Backbone phosphates on the minor groove are engaged by hydrogen bonds from the Lys336 and Arg331 side chains, the main-chain amides of Gly329, Arg332, Gly333, Tyr335, Lys336 (Figure 3B).
Effect of CGG triplet mutations on Pho7-DBD binding to the tgp1 promoter in vitro
As with other structurally characterized fungal Zn2Cys6 DBDs, a CGG base pair triplet is a predominant recipient of Pho7’s base-specific interactions with its target site. To functionally probe the degree to which these three base pairs dictate binding specificity, we replaced the individual C2:G, G3:C, and G4:C pairs with all other standard base pairs (three per position) in the context of the 5′ 32P-labeled 24-bp tgp1 promoter site probe and assayed them for binding to Pho7-(279-368) DBD, at two levels of input DBD protein, 16 ng and 32 ng, that sufficed to bind 55% and 81% of the DNA probe with the wild-type CGG triplet, respectively (Figure 4A). Replacing the C2:G pair with T:A or G:C abolished binding to Pho7, while the A:T substitution reduced binding by 17-fold (Figure 4A). The crystal structure suggests that a T2:A pair would result in unfavorable (repulsive) placement of the Asp298 main chain carbonyl near thymine-O4 and of Lys300-Nζ near adenine-N6 (Figure 2B). In the same vein, a G2:C pair would unfavorably place the Asp298 main chain carbonyl near guanine-O6 or -N7 and Lys300-Nζ near cytosine-N4. By contrast, the structure seems potentially tolerant (at reduced affinity) of a A2:T pair, insofar as the Lys300 might be able to adjust its position to form a hydrogen bond with thymine-O4 (Figure 2B).
Figure 4.

Effect of CGG triplet mutations on Pho7-DBD binding to the tgp1 promoter in vitro and promoter activity in vivo. (A) The 24-bp tgp1 promoter DNA is shown at bottom left with the CGG triplet highlighted in white font on black background. The 5′ 32P-label on the top strand is indicated by •. Single base pair changes at each position of the CGG triplet were introduced into the 24-bp DNA as specified. Reaction mixtures (10 μl) containing 0.5 pmol 32P-labeled DNA, 50 mM NaCl, 0.34 μg poly(dI•dC), and 0, 16 or 32 ng of Pho7 DBD were incubated for 10 min at room temperature. The mixtures were analyzed by native PAGE in 0.25x TBE. Autoradiographs of the dried gels are shown. The extents of Pho7 binding to each 24-mer DNA were quantified and are plotted in the bar graph at bottom right. Each datum in the graph is the average of three independent binding experiments ± SEM. (B) In the tgp1•pho1 reporter plasmid shown in cartoon form at left, the pho1 ORF is fused immediately downstream of a fragment of genomic DNA encompassing the tgp1 transcription start (forward arrow) site plus 42 bp of downstream sequence and 871 bp (–871) of upstream tgp1 sequence. A single binding site for Pho7 (depicted as a black ball) has been mapped in the tgp1 promoter (6). The 12-nucleotide site is shown below the reporter cartoon, along with three mutated versions of the CGG triplet. tgp1•pho1 reporter plasmids with wild-type and the mutated Pho7 sites were introduced into a strain deleted for the endogenous pho1 gene. Plasmid-containing cells were grown logarithmically in YES medium and assayed for acid phosphatase activity (6).
Mutating the G3:C pair to A:T, or C:G eliminated Pho7 binding, whereas the T:A substitution reduced binding by 6-fold (Figure 4A). Here also, the crystal structure rationalizes these effects. To wit, an A3:T pair would cause unfavorable (repulsive) proximity of Asn299-Nδ to adenine-N6 and the Asn299 main-chain carbonyl to thymine-O4, just as a C3:G pair would place Asn299-Nδ near cytosine-N4 and the Asn299 main-chain carbonyl near guanine-O6 or -N7 (Figure 2B). However, the structure suggest how a T3:A pair might sustain some binding to Pho7 if Asn299-Nδ donates a hydrogen bond to the thymine-O4.
Changing the G4:C pair to A:T effaced Pho7 binding but the C:G and T:A mutations elicited 3-fold and 4-fold binding decrements, respectively (Figure 4A). The comparatively modest effect of the C4:G change is consistent with the fact that the site 1 Pho7 binding element in the pho1 promoter (5′-TCGCTGCTTGAA) naturally has a CGC triplet in lieu of CGG and that site 1 has lower affinity for Pho7 than does the tgp1 site or pho1 site 2 (6). In this case, it is not obvious from the crystal structure why the A4:T change is so deleterious to Pho7 binding, insofar as one would expect Arg284 to still interact with the thymine-O2 in the minor groove.
Effect of CGG site mutations on tgp1 promoter activity in vivo
To interrogate the tgp1 promoter, we employed a plasmid reporter (23) in which a genomic DNA segment containing nucleotides -871 to +42 of the tgp1 transcription unit (with +1 being the tgp1 mRNA start site) was fused to the pho1 ORF encoding the fission yeast cell-surface acid phosphatase (Figure 4B). This plasmid generated vigorous acid phosphatase activity when introduced into a pho1Δ strain (Figure 4B). Acid phosphatase activity is a gauge of Pho1 enzyme level that correlates tightly with pho1 mRNA level, as assayed by primer extension as well as RT-qPCR, RNA-seq, and northern blotting (4,5,23–26). The Pho7 binding site in the tgp1 promoter is located between positions –192 and –181 upstream of the tgp1 transcription initiation site (Figure 4B). Acid phosphatase activity driven by the tgp1 promoter reporter plasmid was reduced by 85% in a pho7Δ strain background (6). To gauge the role of the CGG triplet in tgp1 promoter activity, we constructed three mutant reporters in which the triplets were changed to TGG, CAG or CGA (Figure 4B). We showed in the preceding section that these triplet mutations eliminated Pho7–DBD binding in vitro. Here we found that acid phosphatase expression from the reporter plasmids with mutant promoter triplets was reduced by 78–81% (Figure 4B), to nearly the same level seen for the wild-type reporter in a pho7Δ strain (6). Thus, the CGG triplet is critical for Pho7-dependent transcription driven by the tgp1 promoter.
Effect of site 1 and site 2 mutations on pho1 promoter activity in vivo
A plasmid-based reporter containing 283-nt of promoter DNA 5′ of the pho1 transcription start site suffices to drive vigorous expression of Pho1 acid phosphatase in fission yeast pho1Δ cells (24). Pho7 binding site 1 (−187TCGCTGCTTGAA−176) and site 2 (−155TCGGAAATTAAA−144) in the pho1 promoter were altered in the context of the reporter plasmid so that the CGC triplet of site 1 was changed to CAC and the CGG triplet of site 2 was changed to CAG (Supplementary Figure S2A). The single-nucleotide changes in sites 1 and 2 reduced Pho1 expression by 93% and 97%, respectively (Supplementary Figure S2B). Thus, the triplets in both Pho7 sites are critical for pho1 promoter activity.
Effect of Pho7 mutations on phosphate homeostasis in vivo
We used the crystal structure of the Pho7-DBD•DNA complex to guide an alanine scan of selected amino acids implicated in DNA recognition (Gln287, Gln296, Lys297, Lys300, Lys301, Arg323, Lys324, Arg326, Arg331) or in maintenance of the DBD fold (Arg306, Lys289, Lys313). The alanine mutations were introduced individually into the gene encoding full-length Pho7 and the pho7-Ala alleles were exchanged into the chromosomal pho7+ locus as described previously (6). The pho7-WT, pho7-Ala and pho7Δ strains were spot-tested for growth on YES agar medium (Figure 5A). As noted previously (6), the pho7Δ strain grew slower than wild-type at 25°C (as gauged by colony size) and was progressively ‘sicker’ at higher (30, 34 and 37°C) and lower (20°C) temperatures (Figure 5A). Whereas the Q287A, K289A, Q296A, K297A, K301A, K313A, K324A and R331A alleles complemented the temperature-sensitive and cold-sensitive phenotypes, the R306A and R326A mutations phenocopied the pho7Δ growth defect (Figure 5A), signifying that Arg306 (which makes a network of fold-stabilizing hydrogen bonds) and Arg326 (which contacts two nucleobases in the target site) are critical for Pho7 function during vegetative growth. The K300A and R323A alleles partly complemented the cs defect but did not rescue the ts phenotype (Figure 5A). Western blotting of whole cell extracts of the pho7-WT, pho7-Ala and pho7Δ strains verified that the Pho7 WT and Ala-mutant proteins were present at similar levels (in relation to an Spt5 loading control) and that no Pho7 was detected in the extract from pho7Δ cells (Supplementary Figure S3).
Figure 5.

Effect of Pho7 mutations on phosphate homeostasis in vivo. (A) S. pombe strains deleted of pho7 (pho7Δ) or bearing the pho7 alleles as indicated were spot-tested for growth at the temperatures specified. Alleles that did not complement the temperature-sensitive growth defect of pho7Δ are denoted by asterisks. (B) Acid phosphatase activity of cells bearing the indicated pho7 alleles assayed before (+ phosphate) and 5 h after (– phosphate) transfer of logarithmically growing cells to medium lacking phosphate. (C) Acid phosphatase activity of cells bearing the indicated pho7 alleles, plotted as a function of time after transfer to medium lacking phosphate.
The pho7-WT, pho7-Ala and pho7Δ strains were tested for responsiveness to phosphate starvation by assay of Pho1 acid phosphatase activity prior to and 5 h after transfer of the cells from rich medium (+ phosphate) to synthetic medium lacking phosphate (–phosphate). pho7-WT cells evinced a 9-fold increase in Pho1 activity (above the + phosphate baseline) after 5 h of starvation (Figure 5B). As expected, pho7Δ cells have a lower basal level of acid phosphatase activity under phosphate-replete conditions and manifested no Pho1 induction during phosphate starvation (Figure 5B). The K300A, R306A, R323A, and R326A strains had lower basal Pho1 activity and mounted a feeble response to starvation that did not even reach the basal level of Pho1 activity seen in WT cells (indicated by asterisks in Figure 5B). Thus, among the twelve alanine mutations tested, these four changes had the greatest effect on phosphate homeostasis. The remaining eight pho7-Ala strains (all of which had reduced basal acid phosphatase activity compared to wild-type) responded to phosphate starvation with 10- to 15-fold increases in Pho1 expression (Figure 5B), but did not attain the level seen in wild-type cells after 5 h in phosphate-free medium. We surmise that these alleles are, to varying degrees, hypomorphs.
Three of the pho7-Ala strains that showed a range of effects on Pho1 expression in Figure 5B were selected for more detailed analysis of the kinetics of Pho1 induction over a 6-h interval after shift to phosphate-free medium (Figure 5C). Wild-type cells respond to starvation with a progressive time-dependent accumulation of cell-associated acid phosphatase enzyme after a 2-h lag. pho7-R331A cells showed an increase in Pho1 activity between 2 and 3 h; however, the slope of the increase was initially shallower (at up to 4 h) than in wild-type cells, though it attained a WT-like slope between 5 and 6 h of starvation (Figure 5C). pho7-K324A cells had a slightly longer lag before Pho1 started to accumulate, also at a shallow slope (half that of wild-type between 5 and 6 h) (Figure 5C). The most severe effect was seen in pho7-K300A cells, which – after a 4-h lag – began to accumulate Pho1 with a very shallow slope (6-fold-less than wild-type) (Figure 5C). These results point to the importance of the contacts of Lys300 to the guanine base in the C2:G base pair of the DNA target site for Pho7 activity in vivo.
Effect of Pho7 mutations on DNA binding in vitro
The 12 alanine mutations studied above in the context of full-length Pho7 were introduced into the Pho7-(279–368) DNA binding domain and the recombinant DBDs were produced in Escherichia coli and purified (Supplementary Figure S4). To illuminate a biochemical basis for the observed mutational effects on Pho1 expression in vivo, we assayed the DBD mutants for binding to Pho7 sites 1 and 2 in the pho1 promoter, the rationale being that Pho7 binding to both sites is necessary for pho1 expression (Supplementary Figure S2) and loss of binding to either site 1 or site 2 could account for defective phosphate homeostasis. The EMSAs with site 1 are shown in Figure 6 and quantified in Figure 7A. The results highlight a correlation between defective site 1 binding in vitro and Pho1 expression in vivo. To wit: the four Ala mutations that severely affected the phosphate starvation response abolished (in the case of K300A, R326A, and R306A) or drastically reduced (R323A) binding of the DBD to the site 1 probe (Figures 6 and 7A). Other mutations either had no effect on site binding (R331A) or reduced site 1 affinity by 2-fold to 8-fold (based on the shifts-to-the right in the DBD titration curves; Figure 7A).
Figure 6.

Binding of Pho7 mutants to pho1 promoter site 1. EMSAs were performed using the 32P-labeled site 1 DNA probe shown at the top. The 32P label is indicated by •. The Pho7 binding motif is shown in white font on black background. Reaction mixtures (10 μl) containing 0.24 pmol 32P-labeled DNA, 0.34 μg poly(dI-dC), 50 mM NaCl, and 0, 8, 16, 32 or 64 ng Pho7-DBD were incubated for 10 min at room temperature. The mixtures were analyzed by native PAGE in 0.25× TBE. Autoradiographs of the dried gels are shown.
Figure 7.

Mutational effects on Pho7 binding to three target sites. EMSAs were performed using the pho1 site 1 (A), pho1 site 2 (B), and tgp1 site (C) DNA probes as described in the legends to Figure 6, Supplementary Figures S5 and S6. The extents of DNA binding were quantified and are plotted as function of input Pho7. For clarity, the WT and mutant binding curves for each site are plotted in two groups in side-by-side graphs. Each datum in the graphs is the average of three independent binding experiments ±SEM.
The EMSA results with pho1 site 2 (shown in Supplementary Figure S5 and quantified in Figure 7B) indicated, as noted previously (6), that the extent of binding was greater for site 2 than site 1 at all DBD concentrations tested. Whereas the R306A mutant was unable to bind site 2, the R326A, K300A, and R323A DBDs (that were defective for site 1 binding) did bind site 2, with affinities within a factor of two of the wild-type DBD. The other Ala mutants bound as well or nearly as well as wild-type to the site 2 probe. These results suggest that Pho7 binding to site 1 in the pho1 promoter is an Achilles heel with respect to the pho1 response to phosphate starvation.
Finally, we also gauged mutational effects on DBD binding to the tgp1 promoter site (EMSAs shown in Supplementary Figure S6 and quantified in Figure 7C). The R306A mutant was unable to bind the tgp1 DNA. From this and preceding results, we infer that loss of Arg306 destabilizes the DBD fold and precludes recognition of any of the Pho7 target sites. The other mutations elicited a range of tgp1 site binding phenotypes; from no effect of R331A (consistent with the pho1 site 1 and site 2 data) to a sharp decrement (∼16-fold) in the cases of R323A and R326A (consistent with the pho1 site 1 results).
DISCUSSION
The 738-aa Pho7 protein is the key transcriptional activator underlying fission yeast phosphate homeostasis, a physiological response to phosphate starvation in which the pho1, pho84, and tgp1 genes are upregulated. Here, we delineated a minimized 61-aa Pho7 DNA-binding domain (DBD) and determined the atomic structure of the DBD in complex with its target site in the tgp1 promoter. The structure reveals the basis for target site specificity and highlights distinctive properties and principles of DNA binding by Pho7 vis à vis other Zn2Cys6 transcription factors. Two features of Pho7 stand out: (i) it binds DNA as a monomer, unlike most other fungal zinc-cluster factors that bind DNA as homodimers, e.g. Gal4, Leu3, Ppr1, Hap1 and Put3 (8–13); and (ii) it makes contact with its target site over a 14-bp footprint that entails nucleobase contacts remote from the CGG triplet typically recognized by other Zn2Cys6 DBDs.
The Pho7 DBD resembles the canonical Gal4 DBD (8,9) with respect to the virtually identical folds of their Zn2Cys6 modules and the constituents of their zinc coordination complexes (see Supplementary Figure S7 for a stereo view of the aligned Pho7 and Gal4 modules). In both cases, secondary structure elements in the module are limited to two α-helices (Supplementary Figure S7). The primary structures of the Pho7 and Gal4 modules are similar to the extent of 13 positions of amino acid identity (including the 6 zinc-coordinating cysteines) and 5 positions of side chain similarity across a 44-amino acid protein segment (Supplementary Figure S7).
A vertically offset superposition of the Pho7•DNA and Gal4•DNA complexes with respect to their zinc modules and the 5′-CGG base pair triplet that they recognize in the major groove is shown in Figure 8, in which only one Gal4 protomer of the DNA-bound homodimer is included. The DNA-interacting portions of the Pho7 and Gal4 proteins are colored green and magenta, respectively. The Pho7 DBD, which engages its target DNA as a monomer, has no counterpart of the coiled-coil homodimerization domain at the C-terminus of the Gal4 DBD (colored gray in Figure 8). The only amino acid side chain contact that Gal4 makes to target site nucleobases is a bifurcated hydrogen bond from Lys18-Nζ to the guanine-N7 atom of the second base of the 5′-CGG triplet and to the guanine-O6 atom of the third base of the 5′-CGG triplet (8,9). The equivalent residue in Pho7 is Asn299, which donates a hydrogen bond from Nδ to guanine-O6 of the second base of the 5′-CGG triplet. The corresponding side chain in other Zn2Cys6 transcription factors also makes base-specific DNA interactions to this second guanine; whether from a histidine side chain in the case of Put3 (11), or a lysine side chain in Ppr1, Hap1, Leu3 and AlcR (10,12–14). All of the Zn2Cys6 proteins make a pair of hydrogen bonds from adjacent main-chain carbonyls to the cytosine-N4 of the first C:G pair of the triplet and the cytosine-N4 of the second G:C pair: these are the equivalent of the main-chain Pho7•DNA contacts made by Asp298-O and Asn299-O (Figure 2B).
Figure 8.
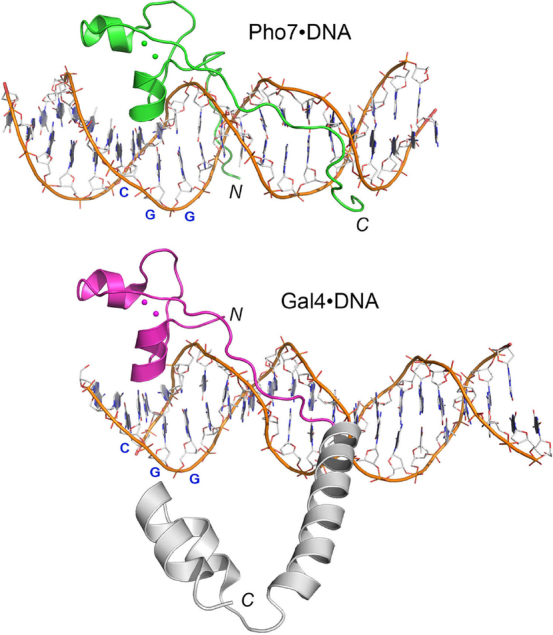
Comparison of Pho7 and Gal4 DNA binding modes. A vertically offset superposition of the Pho7•DNA and Gal4•DNA (pdb: 3COQ) complexes with respect to their zinc modules and the 5′-CGG base pair triplet that they recognize in the major groove is shown. Only one Gal4 protomer of the DNA-bound homodimer is included. The DNA-interacting portions of the Pho7 and Gal4 proteins are colored green and magenta, respectively. The Pho7 DBD has no counterpart of the coiled-coil homodimerization domain at the C-terminus of the Gal4 DBD (colored gray).
A key difference between the DNA interfaces of Pho7 and Gal4 is that Pho7 makes additional contacts with the nucleobases in the major groove via Lys300 (Figure 2B) that account for Pho7’s preference for a 5′-T:A pair preceding the CGG triplet in the consensus Pho7 recognition element (6). Our mutational studies here underscore the importance of Lys300 for Pho7 activity in vitro and in vivo. An even more striking distinction is that the extended peptide segment in Gal4 downstream of the zinc-binding module (i.e. the linker to the dimerization module) tracks above the minor groove without directly contacting the DNA (Figure 8). By contrast, the homologous segment of Pho7 hugs closely to and penetrates the DNA minor groove, as does the N-terminal peptide preceding the Pho7 zinc-binding module (of which there is no counterpart in the Gal4 structure). These two Pho7 segments make numerous contacts to the backbone phosphates of both DNA strands and to seven of the nucleobases downstream of the 5′-CGG triplet (Figure 3A–C).
The footprint of Pho7–DNA atomic interactions spans 14 nucleotides and entails hydrogen bonding to 13 individual nucleobases by a monomeric DBD. The sequence of the Pho7 DNA binding site is asymmetric and has only one CGG triplet, in keeping with the monomeric binding mode, as opposed to the DNA sites consisting of two triplets, in various orientations and with variable spacing between them, that are recognized by homodimeric Zn2Cys6 transcription factors (7–13). The NMR structure of the Zn2Cys6 protein AlcR showed that it bound to DNA as a monomer (14). Yet AlcR’s structure and DNA interface differ from Pho7’s (see Supplementary Figure S8). For example, the AlcR DBD fold includes two ‘extra’ α-helices located between and downstream of the zinc-binding α-helices (14) that have no counterpart in Pho7 (or most other Zn2Cys6 proteins). AlcR recognizes a shorter consensus sequence, the pentamer 5′-(A/T)GCGG (27), than does Pho7. The AlcR structure bound to a 10-bp duplex containing this element pinpointed four arginine side chains that make hydrogen bonds to four nucleobases within the consensus pentamer (14), in addition to the lysine cited above that contacts the CGG guanine. The five side chains in AlcR that contact the bases are situated within or upstream of the folded zinc-binding module. Unlike the situation with Pho7, the segment of the AlcR DBD downstream of the last zinc-binding cysteine makes no direct contacts with the DNA target site (14).
The functional studies inspired by the Pho7•DNA complex underscore the importance of the 5′-CGG triplet for Pho7 binding in vitro and for Pho7-dependent gene expression in vivo. One of the triplet mutations that permits lowered affinity binding by Pho7-DBD in vitro corresponds to the 5′-CGC variant that is present naturally in Pho7 binding site 1 of the pho1 promoter (6). Our mutagenesis of Pho7 (though not exhaustive) identifies amino acids at which alanine substitution effaces or strongly attenuates the pho1 phosphate starvation response in vivo and concordantly reduce Pho7 binding in vitro to site 1 in the pho1 promoter. The hierarchy of mutational effects on binding to different promoter elements tested is consistent with site 1 (with its variant CGC triplet) being most sensitive to Pho7 alterations.
In summary, the present study provides a structural framework for understanding Pho7 control of fission yeast phosphate homeostasis, reveals distinctive features of the Pho7–DNA interface, and presages further efforts to delineate how the full-length Pho7 protein activates transcription and responds to regulatory cues.
DATA AVAILABILITY
Coordinates and structure factors have been deposited in the Protein Data Bank under accession code 6E33.
Supplementary Material
SUPPLEMENTARY DATA
Supplementary Data are available at NAR Online.
FUNDING
NIH grants [R35-GM126945 to S.S. and RO1-GM52470 to B.S.]. The MSKCC structural biology core laboratory is supported by National Cancer Institute grant [P30-CA008748]. X-ray diffraction data were collected at synchrotron facilities supported by grants and contracts from the National Institutes of Health [P41GM103403, HEI-S10RR029205]; Department of Energy [DE-AC02-06CH11357]. Funding for open access charge: NIH grant [R35-GM126945].
Conflict of interest statement. None declared.
REFERENCES
- 1. Tomar P., Sinha 2H.. Conservation of PHO pathway in ascomycetes and the role of Pho84. J. Biosci. 2014; 39:525–536. [DOI] [PubMed] [Google Scholar]
- 2. Jain A., Nagarajan V.K., Raghothama K.G.. Transcriptional regulation of phosphate acquisition by higher plants. Cell. Mol. Life Sci. 2012; 69:3207–3224. [DOI] [PMC free article] [PubMed] [Google Scholar]
- 3. Carter-O’Connell I., Peel M.T., Wykoff D.D., O’Shea E.K.. Genome-wide characterization of the phosphate starvation response in Schizosaccharomyces pombe. BMC Genomics. 2012; 13:697. [DOI] [PMC free article] [PubMed] [Google Scholar]
- 4. Henry T.C., Power J.E., Kerwin C.L., Mohammed A., Weissman J.S., Cameron D.M., Wykoff D.D.. Systematic screen of Schizosaccharomyces pombe deletion collection uncovers parallel evolution of the phosphate signal pathways in yeasts. Euk. Cell. 2011; 10:198–206. [DOI] [PMC free article] [PubMed] [Google Scholar]
- 5. Schwer B., Sanchez A., Shuman S.. RNA polymerase II CTD phospho-sites Ser5 and Ser7 govern phosphate homeostasis in fission yeast. RNA. 2015; 21:1770–1780. [DOI] [PMC free article] [PubMed] [Google Scholar]
- 6. Schwer B., Sanchez A.M., Garg A., Chatterjee D., Shuman S.. Defining the DNA binding site recognized by the fission yeast Zn2Cys6 transcription factor Pho7 and its role in phosphate homeostasis. mBio. 2017; 8:e01218-17. [DOI] [PMC free article] [PubMed] [Google Scholar]
- 7. MacPherson S., Larochelle M., Tyrcotte B.. A fungal family of transcriptional regulators: the zinc cluster proteins. Microbiol. Mol. Biol. Rev. 2006; 70:583–604. [DOI] [PMC free article] [PubMed] [Google Scholar]
- 8. Marmorstein R, Carey M, Ptashne M, Harrison S.C.. DNA recognition by GAL4: structure of a protein–DNA complex. Nature. 1992; 356:408–414. [DOI] [PubMed] [Google Scholar]
- 9. Hong M., Fitzgerald M.X., Harper S., Luo C., Speicher D.W., Marmorstein R.. Structural basis for dimerization in DNA recognition by Gal4. Structure. 2008; 16:1019–1026. [DOI] [PMC free article] [PubMed] [Google Scholar]
- 10. Marmorstein R., Harrison S.C.. Crystal structure of a PPR1-DNA complex: DNA recognition by proteins containing a Zn2Cys6 binuclear cluster. Genes Dev. 1994; 8:2504–2512. [DOI] [PubMed] [Google Scholar]
- 11. Swaminathan K., Flynn P., Reece R.J., Marmorstein R.. Crystal structure of a PUT3-DNA complex reveals a novel mechanism for DNA recognition by a protein containing a Zn2Cys6 binuclear cluster. Nat. Struct. Biol. 1997; 4:751–759. [DOI] [PubMed] [Google Scholar]
- 12. King D.A., Zhang L., Guarente L., Marmorstein R.. Structure of a HAP1-DNA complex reveals dramatically asymmetric DNA binding by a homodimeric protein. Nat. Struct. Biol. 1999; 6:64–71. [DOI] [PubMed] [Google Scholar]
- 13. Fitzgerald M.X., Rojas J.R., Kim J.M., Kohlhaw G.B., Marmorstein R.. Structure of a Leu3-DNA complex: recognition of everted CGG half-sites by a Zn2Cys6 binuclear cluster protein. Structure. 2006; 14:725–735. [DOI] [PubMed] [Google Scholar]
- 14. Cahuzac B., Cerdan R., Felenbok B., Guittet E.. The solution structure of an AlcR-DNA complex sheds light onto the unique tight and monomeric DNA binding of a Zn2Cys6 protein. Structure. 2001; 9:827–836. [DOI] [PubMed] [Google Scholar]
- 15. Otwinowski Z., Minor W.. Processing of X-ray diffraction data collected in oscillation mode. Methods Enzymol. 1997; 276:307–326. [DOI] [PubMed] [Google Scholar]
- 16. Sheldrick G.M. Experimental phasing with SHELXC/D/E: combining chain tracing with density modification. Acta Crystallogr. 2010; D66:479–485. [DOI] [PMC free article] [PubMed] [Google Scholar]
- 17. Potterton L., Agirre J., Ballard C., Cowtan K., Dodson E., Evans P.R., Jenkins H.T., Keegan R., Krissinel E., Stevenson K. et al. CCP4i2: the new graphical user interface to the CCP4 program suite. Acta Crystallogr. 2018; D74:68–84. [DOI] [PMC free article] [PubMed] [Google Scholar]
- 18. Jones T.A., Zou J.Y., Cowan S.W., Kjeldgaard M.. Improved methods for building protein models in electron density maps and the location of errors in these models. Acta Crystallogr. 1991; A47:110–119. [DOI] [PubMed] [Google Scholar]
- 19. Adams P.D., Afonine P.V., Bunkóczi G., Chen V.B., Davis I.W., Echols N., Headd J.J., Hung L.W., Kapral G.J., Grosse-Kunstleve R.W. et al. PHENIX: a comprehensive Python-based system for macromolecular structure solution. Acta Crystallogr. 2010; D66:213–221. [DOI] [PMC free article] [PubMed] [Google Scholar]
- 20. Schwer B., Schneider S., Pei Y., Aronova A., Shuman S.. Characterization of the Schizosaccharomyces pombe Spt5-Spt4 complex. RNA. 2009; 15:1241–1250. [DOI] [PMC free article] [PubMed] [Google Scholar]
- 21. Blanchet C., Pasi M., Zakrzewska K., Lavery R.. CURVES+ web server for analyzing and visualizing the helical, backbone and groove parameters of nucleic acid structures. Nucleic Acids Res. 2011; 39:W68–W73. [DOI] [PMC free article] [PubMed] [Google Scholar]
- 22. Lu X.J., Olson W.K.. 3DNA: a software package for the analysis, rebuilding and visualization of three-dimensional nucleic acid structures. Nucleic Acids Res. 2003; 31:5108–5121. [DOI] [PMC free article] [PubMed] [Google Scholar]
- 23. Sanchez A.M., Shuman S., Schwer B.. Poly(A) site choice and Pol2 CTD Serine-5 status govern lncRNA control of phosphate-responsive tgp1 gene expression in fission yeast. RNA. 2018; 24:237–250. [DOI] [PMC free article] [PubMed] [Google Scholar]
- 24. Chatterjee D., Sanchez A.M., Goldgur Y., Shuman S., Schwer B.. Transcription of lncRNA prt, clustered prt RNA sites for Mmi1 binding, and RNA polymerase II CTD phospho-sites govern the repression of pho1 gene expression under phosphate-replete conditions in fission yeast. RNA. 2016; 22:1011–1025. [DOI] [PMC free article] [PubMed] [Google Scholar]
- 25. Schwer B., Bitton D.A., Sanchez A.M., Bähler J., Shuman S.. Individual letters of the RNA polymerase II CTD code govern distinct gene expression programs in fission yeast. Proc. Natl. Acad. Sci. U.S.A. 2014; 111:4185–4190. [DOI] [PMC free article] [PubMed] [Google Scholar]
- 26. Garg A., Sanchez A.M., Shuman S., Schwer B.. A long noncoding (lnc) RNA governs expression of the phosphate transporter Pho84 in fission yeast and has cascading effects on the flanking prt lncRNA and pho1 genes. J. Biol. Chem. 2018; 293:4456–4467. [DOI] [PMC free article] [PubMed] [Google Scholar]
- 27. Nikolaev I., Lenouvel F., Felenbok B.. Unique DNA binding specificity of the binuclear zinc AlcR activator of the ethanol utilization pathway in Aspergillus nidulans. J. Biol. Chem. 1999; 274:9795–9802. [DOI] [PubMed] [Google Scholar]
Associated Data
This section collects any data citations, data availability statements, or supplementary materials included in this article.
Supplementary Materials
Data Availability Statement
Coordinates and structure factors have been deposited in the Protein Data Bank under accession code 6E33.