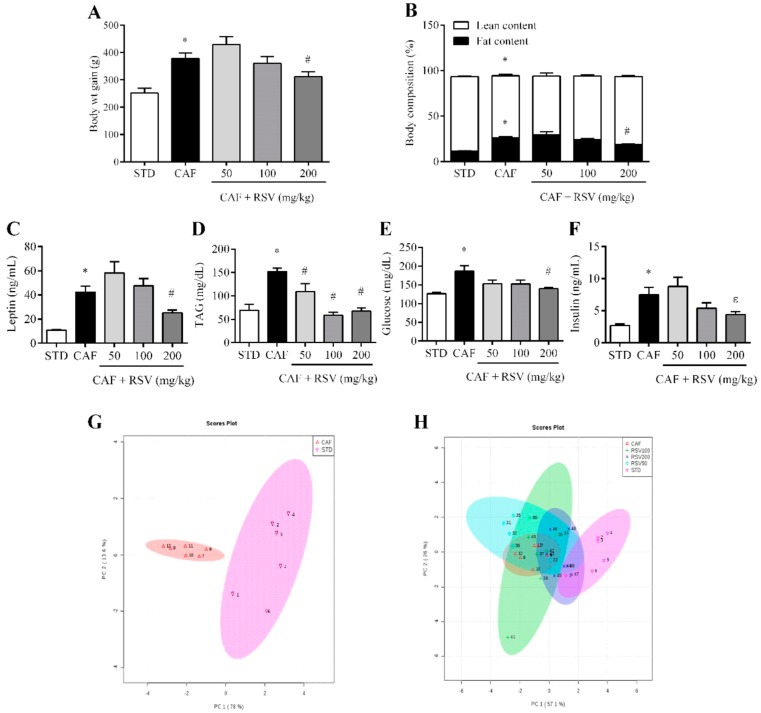
Figure 1.
Metabolic parameters. The rats were fed the STD or CAF diet for 9 weeks. Then, the rats in the STD and CAF groups were treated orally with RSV (50, 100 or 200 mg per kg of body weight) or vehicle for 3 weeks. (A) Body weight gain (g) from the first day of the experiment until the last day; (B) Body composition (%) assessed by NMR, including fat and lean content; Serological levels of (C) leptin, (D) TAG, (E) glucose and (F) insulin. (G) and (H) are PCAs representing the clusters between the different groups according to the studied biometric parameters. Data are expressed as the mean ± SEM, n = 6. * denotes p < 0.05, Student’s t-test comparing the CAF group to the STD group. # denotes p < 0.05 and ε p < 0.1, Student’s t-test comparing the RSV group to the CAF group. CAF: cafeteria diet; NMR: nuclear magnetic resonance; RSV: resveratrol; STD: standard chow diet; TAG: triacylglycerol.

