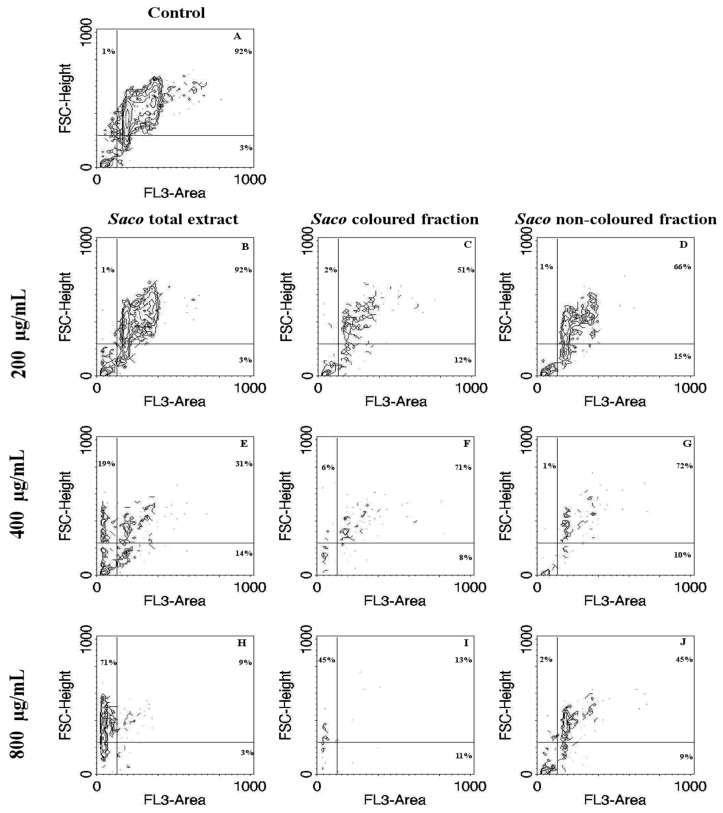
Figure 4.
Correlation of size with Propidium Iodide (PI)-staining contour plots obtained by flow cytometric assay in Caco-2 cells treated with cherry extracts for 24 h. Untreated cells control (A) and cell treated with 200 (B–D), 400 (E–G), and 800 (H–J) µg/mL of each extract are shown. The extracts were Saco total extract (B,E,H), the colored extract (C,F,I) and the non-colored extract (D,G,J). The percentage of events in each quadrant is shown for a representative sample. PI-stained and normal sized events correspond to the upper right quadrant (potential live cells). PI-stained debris (potential apoptotic cells) correspond to the lower right quadrant. Left upper (potentially resulting from necrosis) and lower left quadrants are PI-negative events (potential cytoplasmic debris). FSC, forward scatter; FL3, fluorescence channel 3.

