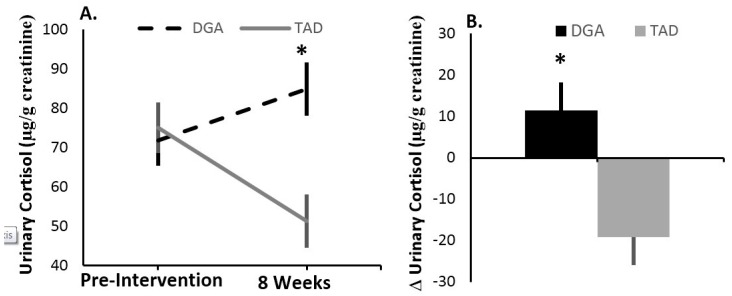
Figure 3.
After controlling for the pre-intervention to intervention dietary shift in HEI for sodium, urinary cortisol concentration increased in the DGA group, while this stress marker declined in the TAD group. (A) shows pre-intervention and 8 week values (lsmean ± s.e.); (B) displays the delta (lsmean ± s.e.) between 8 week and pre-intervention values. All statistical models included diet group (DGA vs. TAD) and the covariates age, education, BMI, baseline stress marker, and the pre-intervention to intervention dietary change in HEI for sodium. * Indicates a significant (p < 0.02) difference between the DGA and TAD groups. DGA, Dietary Guidelines for Americans intervention group. TAD, Typical American Diet intervention group.

