Abstract
Objective: To evaluate the effect of vitamin D supplementation (alone or with co-supplementation) on insulin resistance in patients with polycystic ovary syndrome (PCOS). Methods: We performed a literature search of databases (Medline, Scopus, Web of Knowledge, Cochrane Library) and identified all reports of randomized controlled trials (RCTs) published prior to April 2018. We compared the effects of supplementation with vitamin D alone (dose from 1000 IU/d to 60,000 IU/week) or with co-supplements to the administration of placebos in women diagnosed with PCOS. The systematic review and meta-analysis protocol was registered in the International Prospective Register of Systematic Reviews (Prospero) as number CRD42018090572. Main results: Eleven of 345 identified studies were included in the analysis; these involved 601women diagnosed with PCOS. Vitamin D as a co-supplement was found to significantly decrease fasting glucose concentrations and the HOMA-IR value. HOMA-IR also declined significantly when vitamin D was supplemented with a dose lower than 4000 IU/d. Conclusions: Evidence from RCTs suggests that the supplementation of PCOS patients with continuous low doses of vitamin D (<4000 IU/d) or supplementation with vitamin D as a co-supplement may improve insulin sensitivity in terms of the fasting glucose concentration (supplementation with vitamin D in combination with other micronutrients) and HOMA-IR (supplementation with vitamin D in continuous low daily doses or as co-supplement).
Keywords: vitamin D, 25(OH)D, insulin resistant, glucose, polycystic ovary syndrome
1. Introduction
Polycystic ovary syndrome (PCOS) is a common endocrine disorder frequently diagnosed among women of reproductive age, and has a prevalence of 5–20% [1,2]. The 2003 Rotterdam diagnostic criteria for PCOS are based on the presence of at least two of the following criteria: irregular or lack of ovulation, increased levels of androgen hormones, and enlarged ovaries containing at least 12 follicles each. As many as 50 to 70% of women with PCOS are insulin resistant [3]. Most of the evidence shows that insulin resistance appears to potentiate excess androgen production in adolescent and adult PCOS patients. It has been repeatedly indicted that treatment of insulin resistance leads to an improvement in reproductive and metabolic abnormalities, and probably reduces the future risk of developing diabetes and cardiovascular disease in PCOS women [4,5,6,7]. Thus, every action that might reduce hyperinsulinemia and its consequences in PCOS patients should be taken into consideration [5].
So far, the first line of treatment for women with PCOS and insulin resistance has been the administration of an antihyperglycemic agent called metformin. Numerous studies in adults have shown the favorable effect of metformin on glucose tolerance in type-2 diabetes, and other data also indicate that metformin is an effective agent in reducing insulin resistance and hyperandrogenism in adult women with PCOS [8]. However, it has been observed that metformin is also often poorly tolerated because of gastrointestinal side effects, such as nausea (61%), vomiting (30%), and diarrhea (65%) [9,10]. New economical and safe therapeutic approaches to treating insulin resistance in women with PCOS are therefore needed. To this end, the role of vitamin D in the regulation of insulin secretion has recently attracted much attention. It has been suggested that vitamin D supplementation could affect insulin secretion and improve glucose homeostasis in obese people with type-2 diabetes [11,12,13,14]. Low levels of 25-hydroxycholecalicferol (25(OH)D) are also commonly seen in women suffering from both PCOS and insulin resistance [15,16,17,18,19,20,21,22,23,24]. Several studies on PCOS have demonstrated that serum 25-hydroxyvitamin D (25OHD) concentrations are negatively correlated with body mass index (BMI), body fat, and insulin resistance [25,26]. However, the effects of vitamin D supplementation on insulin resistance treatment in women with PCOS are ambiguous.
We thus wish to answer the following question: can oral supplementation of vitamin D, alone or as a co-supplement, be beneficial in the treatment of insulin resistance in women with PCOS?
The aim of this study was to assess the effect of vitamin D supplementation on insulin resistance in women with PCOS, based on data available in randomized controlled trials.
2. Methods
2.1. Protocol and Registration
Our systematic review and meta-analysis protocol was registered in the International Prospective Register of Systematic Reviews (Prospero) as number CRD42018090572 [27]. The systematic review and meta-analysis process and manuscript development are consistent with the PRISMA guidelines [28].
2.2. Eligibility Criteria
Potential studies were identified from February to April 2018 by conducting a systematic search using PubMed (Medline), Scopus, Web of Science, and the Cochrane Library. During this process, we identified publications that describe the effect of vitamin D supplementation (alone or as a co-supplement) on insulin resistance in women with PCOS, without any limitation on the date of study publication or age of study participants.
The following index terms were used: vitamin D OR ergocalciferol OR cholecalciferol OR 25-hydroxyvitamin D 2 OR hydroxycholecalciferol OR calcifediol OR calcitriol OR 24,25-dihydroxyvitamin D 3 OR dihydrotachysterol AND polycystic ovary syndrome OR PCOS AND OR insulin resistance OR diabetes OR fasting insulin OR fasting glucose OR oral glucose test OR OGTT OR homeostasis model assessment ORHOMA-IR OR quantitative insulin sensitivity check index ORQUICKI OR fasting insulin resistance index ORFIRI OR insulinogenic index ORIGI OR hemoglobin A1c OR glycosylated hemoglobin ORHbA1c.
In addition, we also scanned the reference lists of the retrieved articles to identify additional relevant studies. The date of the final search was 30 April 2018.
2.3. Inclusion Criteria
The following were the inclusion criteria:
Intervention studies (randomized controlled trials (RCTs) and double-blind randomized controlled trials (DB-RCTs)) that compared vitamin D supplementation (alone or in combination with other vitamins and minerals) with a placebo without any limitations on time of supplementation.
English-language articles.
Studies that enrolled women with a strict diagnosis of PCOS using the Rotterdam criteria of the European Society of Human Reproduction and Embryology (ESHRE)/American Society of Reproductive Medicine (ASRAM) [29].
The vitamin D was administered orally as cholecalciferol (vitamin D3), ergocalciferol (vitamin D2), or an active form of vitamin D (1α-hydroxyvitamin D and 1,25-dihydroxyvitamin D (1,25(OH)2D)). Studies in which vitamin D was combined with other vitamins and minerals were also taken into consideration. Finally, we included studies that reported the most often assessed parameters in insulin resistance, such as fasting glucose, fasting insulin, and HOMA-IR.
2.4. Exclusion Criteria
The exclusion criteria were as follows:
Studies performed in specific groups of patients (e.g., subjects with hyperparathyroidism, subjects suffering from hepatic disease or kidney disease, those with a history of bariatric surgery, pregnant or breast-feeding women, and studies performed in women with PCOS but without insulin resistance).
Studies in which vitamin D was combined with metformin.
Conference papers, and articles only available in abstract form (where the authors could not be contacted) were also excluded.
2.5. Data Extraction and Analysis
The data was extracted independently by two reviewers (J.B. and M.J.) based upon the exclusion and inclusion criteria. Publications were assessed according to their titles, abstracts, and full texts in subsequent stages. Doubts were resolved by consensus between reviewers. Each selected publication was studied critically. If the publications included for full-text analysis were not available in the full version, the authors were contacted directly. To assess the study quality, a nine-point scoring system with the Newcastle–Ottawa scale was used. The top score was 9, and a high-quality study was defined by a threshold of at least seven points [30].
Two of the authors (K.Ł., J.B.) independently evaluated the eligibility of all retrieved studies from the databases and extracted the relevant data from each included study. During the data abstraction process, no attempt was made to contact the authors for further information beyond what had been published. Disagreements were resolved by consensus or arbitration. We abstracted the following data from each study: the first author’s name; year of publication; journal name; country; study design; sample size; diagnostic criteria for PCOS; full descriptions of participants enrolled (age, weight, and BMI); the interventions used (type and frequency); the placebo interventions; and the main outcomes—such as serum vitamin D, fasting glucose, fasting insulin, and HOMA-IR.
In our meta-analysis, results from RCTs were also classified by type of dose—low (<4000 IU/d vitamin D) or high dose (otherwise); supplementation frequency (daily or weekly); and type of supplementation (vitamin D alone or as a co-supplement in combination with calcium, vitamin K, zinc, or magnesium).
In assessing the changes in serum 25(OH)D concentrations following vitamin D supplementation, the recommendations of the Endocrine Society were used, as they can be applied to both the general population and groups at risk of vitamin D deficiency [31]. Vitamin D deficiency was defined as a serum 25(OH)D concentrationof20–30 ng/mL, insufficiency as <20 ng/mL, and sufficiency as 30–80ng/mL. However, according to Sempos et al. [32], 25(OH)D values below 12 ng/mL should be considered as being associated with an increased risk of rickets or osteomalacia, while 25(OH)D concentrations between 20 ng/mL and 50 ng/mL appear to be safe and sufficient. The recommendations of the American Diabetes Association (ADA) were used to assess fasting plasma glucose and insulin concentrations [33]. Impaired glucose tolerance (IGT) was defined as a fasting plasma glucose concentration of 100–125 mg/dL. A reference range for fasting insulin of <25 μLU/mL was assumed. The changes in the HOMA-IR index during supplementation were used to assess the alterations in insulin resistance within the studied populations. Following ATP III-Met (Adult Treatment Panel III and the Metabolic Equivalent of Task), we defined the cut-off values of HOMA-IR for the diagnosis of insulin resistance as ≥1.8 [34].
2.6. Assessment of the Risk of Bias in Studies
To assess the methodological quality of the included RCTs, we used the Cochrane risk-of-bias assessment tool to evaluate the randomization performance and methods, allocation concealment, extent of blinding (participants, data collectors, outcome assessors, and data analysis), incomplete outcome data, selective reporting, and other biases. The evaluations were scaled as a low, unclear, and high risk of bias, according to the criteria for judging the risk of bias provided by the Cochrane handbook [35].
2.7. Statistical Analysis
Statistical analysis was carried out using Statistica 13.0 software (StatSoft, Tulsa, OK, USA), and the therapeutic effect of vitamin D on the PCOS patients was estimated by the standardized mean difference (SMD) with 95% confidence intervals (CI). The overall SMD was evaluated by the Z-test. Heterogeneity across studies was evaluated using Cochran’s Q-statistic (with p < 0.1 implying a significant difference) and the I2-statistic (with I2 = 0% meaning no heterogeneity and I2 = 100% meaning maximal heterogeneity). A random-effect model was employed when p < 0.1 and I2 > 70%; p > 0.1 meant there was no heterogeneity among the studies, so a fixed-effect model was applied. Publication bias was assessed by a funnel plot. All statistical tests were two-sided, and p values below 0.05 were considered statistically different.
3. Results
3.1. Search Results
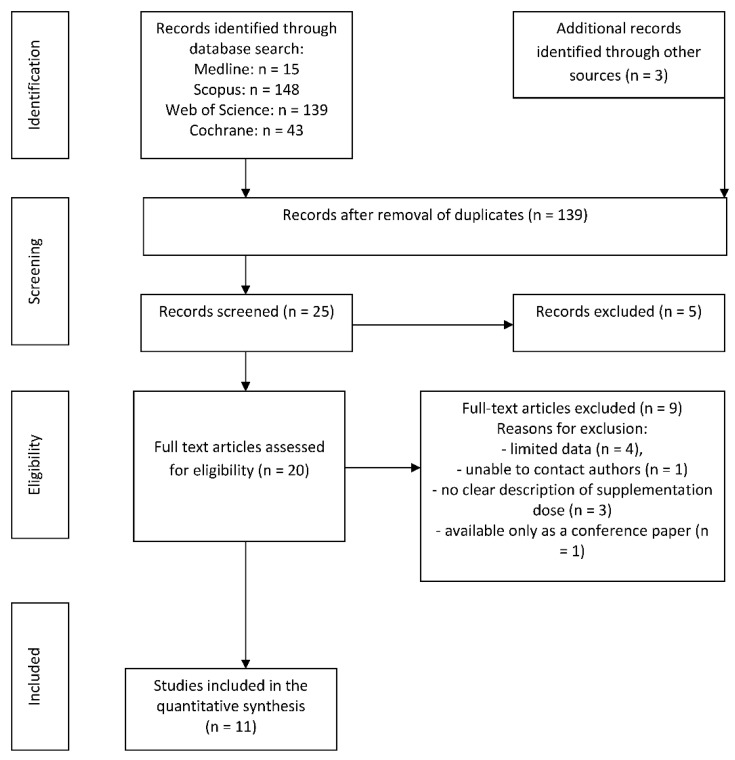
A flow chart of the extraction is presented in Figure 1. Through out the initial search strategy, we identified 348 articles; following analysis of their titles and abstracts section, twenty publications were selected for full-text review. Finally, after the removal of duplicates and publications with insufficient data, 11 RCTs met the inclusion criteria and were included in the final analysis.
Figure 1.
The search process.
3.2. Population and Study Characteristics
Baseline characteristics, number of study participants, study duration, type of intervention, and weight-loss outcomes are presented in Table 1, Table 2 and Table 3, respectively. Overall, 601 patients were included from the eleven selected studies. Although the date of publication of the selected papers was not limited, all the articles included in the systematic review were published after 2012. The number of participants in the studies ranged from 28 to 90 [20,22]. The age of the women ranged from 18 to 40 and the BMI value ranged from 24.2 [19] to 37.2 kg/m2 [20]. Patients were of the following ethnicities: Asian (89%) [16,17,18,19,21,22,23,24], African-America (0.5%) [15], and Hispanic (6%) [15]. The study of Raja-Khan et al. [20] lacked information on the ethnicity of the study population. Studies were designed as RCTs. In interventions employing supplementation with cholecalciferol, the dose ranged from 200 IU/d [24] to 60,000 IU/weekly [21], with 2000 IU/d (0.5 μd/d) calcitriol [24] and 200 IU/d as a co-supplementation [2,19].
Table 1.
Characteristics of the included studies and study populations (n = 601).
| Study | Country | Subjects (n) | Intervention | Supplemented Dose of Vitamin D | Vitamin D Supplements: Formulation and Manufacturer | Time of Intervention | Ethnicity |
|---|---|---|---|---|---|---|---|
| Abootorabi et al. [16], 2017 | Iran | 36 | Cholecalciferol (n = 19) Placebo (n = 17) | 50,000 IU/weekly | Capsules: D-Vitamin 50,000; Zahravi Pharm Co, Tabriz, Iran | 8 weeks | Asian: 100% |
| Ardabili et al. [17], 2012 | Iran | 50 | Cholecalciferol (n = 24) Placebo (n = 26) | 50,000 IU every 20 days Placebo | Capsules: D-Vitin 50,000, Zahravi Pharm Co, Tabriz, Iran | 60 weeks | Asian: 100% |
| Asemi et al. [18], 2014 a | Iran | 78 | Cholecalciferol (n = 26) Cholecalciferol + Calcium(n = 26) placebo (n = 26) |
50,000 IU/week 50,000 IU/week + 1000 mg/d Placebo |
Tablets: Dana Pharmaceutical Company (Tabriz, Iran) and Barij Essence Pharmaceutical Company (Kashan, Iran). | 8 weeks | Asian: 100% |
| Bonakdaran et al. [24], 2012 b | Iran | 31 | Calcitriol (n = 15) Placebo (n = 16) |
200 IU/d Placebo |
Capsules: Zahravi, Tabriz, Iran | 12 weeks | Asian: 100% |
| Gupta et al. [21], 2017 | India | 50 | Cholecalciferol (n = 25) Placebo (n = 25) | 60,000 IU/weekly Placebo | Not given | 12 weeks | Asian: 100% |
| Irani et al. [15], 2015 | USA | 53 | Cholecalciferol (n = 35) Placebo (n = 18) | 50,000 IU/weekly Placebo | Capsules: manufacturer not given | 8 weeks | Vitamin D group: Hispanic: 69.4%; Asian: 25%; Black: 5.5% Placebo group: Hispanic: 72.2%; Asian: 22.2%; Black: 5.5% |
| Jamilian et al. [2], 2017 | Iran | 90 | Cholecalciferol (n = 30) Cholecalciferol (n = 30) Placebo (n = 30) | 1000 IU/d 4000 IU/d Placebo |
Capsules: Zahravi Pharmaceutical Company (Tabriz, Iran) and Barij Essence Pharmaceutical Company Kashan, Iran | 12 weeks | Asian: 100% |
| Jamilian et al. [22], 2017 | Iran | 60 | Cholecalciferol+Magnesium+Zinc+Calcium (n = 30) Placebo (n = 30) | 200 IU + 100 mg + 4 mg + 400 mg/d Placebo |
Tablets: Vitane (Wolfratshausen, Germany) and Barij Essence Pharmaceuticals (Kashan, Iran), | 12 weeks | Asian: 100% |
| Karamali et al. [19], 2018 | Iran | 55 | Cholecalciferol + Calcium + Vitamin K (n = 28) Placebo (n = 27) | 200 IU + 500 mg + 90 μg/d Placebo |
Capsules: Arian SalamtSina (Tehran, Iran) and Barij Essence Pharmaceutical Company(Kashan, Iran) | 8 weeks | Asian: 100% |
| Maktabi et al. [23], 2017 | Iran | 70 | Cholecalciferol (n = 35) Placebo (n = 35) | 50,000 IU every 2 weeks Placebo |
Capsules: Zahravi, Tabriz, Iran | 12 weeks | Asian: 100% |
| Raja-Khan et al. [20], 2014 | USA | 28 | Cholecalciferol (n = 13) Placebo (n = 15) | 12,000 IU/d Placebo |
Gel caps: Maximum D3 (with soy lecithin oil): BTR Group, Inc. (Pittsfield, IL, USA) | 12 weeks | N/A |
N/A: Not available. a In this study, additional supplementation with calcium alone was also tested. These results were not taken into account in this meta-analysis. b In this study, asecond control grouponly took metformin. These results were not taken into account in this meta-analysis.
Table 2.
Mean changes in 25(OH)D (ng/mL) concentration after supplementation with vitamin D in the supplemented and placebo groups of the selected studies.
| Study | Supplemented Dose of Vitamin D | Study Groups | Age (Years) Mean ± SD |
BMI (kg/m2) Mean ± SD |
Serum 25(OH)D (ng/mL)Concentration Mean ± SD |
|
|---|---|---|---|---|---|---|
| Before Supplementation | After Supplementation | |||||
| Abootorabi et al. [16], 2017 | Cholecalciferol Placebo |
SG PG |
26.2 ± 4.6 22.8 ± 4.4 |
N/A | 8.65 ± 4.3 9.80 ± 5.1 |
36.9 ± 8.4 *** 13.4 ± 7.1 |
| Ardabili et al. [17], 2012 | Cholecalciferol Placebo |
SG PG |
26.8 ± 4.7 27.0 ± 3.7 |
29.1 ± 4.6 28.3 ± 3.5 |
6.9 ± 2.8 | 23.4 ± 6.1 *** |
| Asemi et al. [18], 2014a | Cholecalciferol Cholecalciferol + Calcium placebo |
SG SG PG |
25.6 ± 4.4 24.9 ± 5.1 24.3 ± 5.2 |
29.3 ± 3.9 27.3 ± 5.3 27.5 ± 5.2 |
11.6 ± 4.7 15.1 ± 3.6 14.0 ± 4.1 |
23.4 ± 7.1 ** 26.8 ± 7.8 *** 14.4 ± 4.7 |
| Bonakdaran et al. [24], 2012b | Calcitriol Placebo |
SG PG |
24.7 ± 3.3 25.2 ± 7.9 |
24.8 ± 5.3 25.3 ± 5.1 |
11.4 ± 8.2 19.9 ± 16.5 |
20.1 ± 16.2 19.0 ± 15.3 |
| Gupta et al. [21], 2017 | Cholecalciferol Placebo |
SG PG |
26.0 ± 3.7 26.6 ± 3.7 |
24.9 ± 2.8 25.6 ± 2.0 |
18.56 ± 9.7 | 44.90 ± 9.04 *** |
| Irani et al. [15], 2015 | Cholecalciferol Placebo |
SG PG |
30.5 ± 1.0 29.6 ± 1.7 |
30.0 ± 1.0 28.0 ± 1.6 |
16.3 ± 0.9 17.0 ± 1.8 |
43.2 ± 2.4 ** 17.4 ± 1.9 |
| Jamilian et al. [22], 2017 | Cholecalciferol+Magnesium+Zinc+Calcium Placebo |
SG PG |
18–40 | N/A | +7.9 ± 8.4 *** b +0.1 ± 8.4 |
|
| Jamilian et al. [2], 2017 | Cholecalciferol Cholecalciferol Placebo |
SG low dose SG high dose PG |
26 ± 5.0 28 ± 5.0 25 ± 5.0 |
33 ± 5 31 ± 6 30 ± 6 |
12.6 ± 3.4 12.6 ± 2.7 12.9 ± 2.4 |
18.5 ± 4.9 * 24.6 ± 3.3 * 13.1 ± 2.5 |
| Karamali et al. [19], 2018 | Cholecalciferol + calcium + vitamin K Placebo |
SG PG |
23.5 ± 4.2 23.3 ± 3.4 |
24.2 ± 4.8 24.3 ± 3.9 |
14.7 ± 2.5 14.8 ± 3.9 |
20.0 ± 3.0 *** 14.5 ± 5.0 |
| Maktabi et al. [23], 2017 | Cholecalciferol Placebo |
SG PG |
18–40 a | N/A | 12.8 ± 4.5 14.5 ± 5.1 |
27.5 ± 9.8 *** 14.4 ± 5.2 |
| Raja-Khan et al. [20], 2014 | Cholecalciferol Placebo |
SG PG |
28.2 ± 5.2 28.7 ± 5.6 |
37.2 ± 4.5 35.1 ± 9.8 |
19.95 ± 9.5 22.20 ± 6.9 |
67.4 ± 28.6 *** 22.5 ± 7.0 |
N/A: not available. SG: supplemented group. PG: placebo group. a In this study, additional supplementation with calcium alone was also tested. These results were not taken into account in this meta-analysis. b In this study, a second control group only took metformin, * p < 0.05; ** p < 0.01; *** p < 0.001.
Table 3.
Mean changes in fasting glucose concentration (mg/dL), fasting insulin level (μLU/L), and value of HOMA-IR index before and after supplementation with vitamin D in the supplemented and placebo groups in the selected studies.
| Study | Supplemented Dose of Vitamin D | Study Groups | Fasting Glucose (mg/dL) Mean ± SD |
Fasting Insulin (μLU/mL) Mean ± SD |
HOMA-IR Mean ± SD |
|||
|---|---|---|---|---|---|---|---|---|
| Before | After | Before | After | Before | After | |||
| Abootorabi et al. [16], 2017 | Cholecalciferol Placebo |
SG PG |
86.7 ± 6.8 84.2 ± 5.9 |
79.1 ± 7.1 *** 85.9 ± 7.9 |
14.7 ± 7.5 8.2 ± 5.8 |
15.9 ± 7.3 9.6 ± 3.3 |
2.8 ± 1.3 1.7 ± 1.2 |
2.8 ± 1.4 2.0 ± 0.7 |
| Ardabili et al. [17], 2012 | Cholecalciferol Placebo |
SG PG |
99.8 ± 10.1 101.5 ± 10.6 |
96.6 ± 9.9 98.8 ± 14.6 |
12.5 ± 15.1 9.9 ± 5.3 |
13.3 ± 9.7 10.0 ± 4.1 |
3.2 ± 4.1 2.5 ± 1.4 |
3.2 ± 2.6 2.5 ± 1.1 |
| Asemi et al. [18], 2014 a | Cholecalciferol Cholecalciferol + calcium placebo |
SG SG PG |
87.3 ± 16.4 81.6 ± 10.0 67.6 ± 11.7 |
86.8 ± 16.1 76.4 ± 13.3 * 73.5 ± 23.8 |
13.5 ± 9.9 11.1 ± 14.2 12.0 ± 5.6 |
12.4 ± 5.5 * 7.8 ± 3.6 * 15.1 ± 7.1 |
3.1 ± 2.8 2.2 ± 2.8 2.0 ± 1.1 |
2.8 ± 1.6 * 1.5 ± 0.7 * 2.8 ± 1.9 |
| Bonakdaran et al. [24], 2012 b | Calcitriol Placebo |
SG PG |
81.7 ± 8.6 86.3 ± 5.4 |
89.0 ± 12.3 87.3 ± 5.3 |
18.3 ± 30.4 13.6 ± 14.6 |
13.1 ± 14.8 8.6 ± 5.0 |
4.2 ± 6.8 2.8 ± 2.9 |
2.7 ± 3.1 1.9 ± 1.0 |
| Gupta et al. [21], 2017 | Cholecalciferol Placebo |
SG PG |
88.2 ± 9.3 91.3 ± 8.4 |
82.4 ± 8.0 * 87.6 ± 9.9 |
10.3 ± 20.0 4.6 ± 0.6 |
5.0 ± 3.2 * 4.6 ± 0.6 |
2.4 ± 4.9 1.0 ± 0.6 |
1.0 ± 0.6 * 1.0 ± 0.2 |
| Irani et al. [15], 2015 | Cholecalciferol Placebo |
SG PG |
N/A | N/A | N/A | N/A | 2.1 ± 0.4 1.6 ± 0.3 |
2.0 ± 0.2 1.5 ± 0.2 |
| Jamilian et al. [22], 2017 | Cholecalciferol Cholecalciferol Placebo |
SG low dose SG high dose PG |
N/A | N/A | N/A | N/A | 3.2 ± 0.4 3.2 ± 0.4 3.0 ± 0.3 |
2.9 ± 0.6 2.7 ± 0.4 * 3.1 ± 0.7 |
| Jamilian et al. [2], 2017 | Cholecalciferol+Magnesium+Zinc+Calcium Placebo |
SG PG |
86.6 ± 6.9 90.0 ± 4.8 |
86.7 ± 7.5 91.1 ± 5.9 |
12.9 ± 4.4 11.2 ± 3.9 |
11.0 ± 4.6 11.6 ± 4.5 |
2.8 ± 0.9 2.5 ± 0.9 |
2.4 ± 1.1 2.6 ± 1.0 |
| Karamali et al. [19], 2018 | Cholecalciferol + calcium + vitamin K Placebo |
SG PG |
84.2 ± 6.9 83.6 ± 13.0 |
84.5 ± 6.7 88.6 ± 20.5 |
11.8 ± 4.7 10.4 ± 5.3 |
9.9 ± 3.7 ** 12.2 ± 6.1 |
2.4 ± 1.0 2.1 ± 1.0 |
2.0 ± 0.8 ** 2.5 ± 1.3 |
| Maktabi et al. [23], 2017 | Cholecalciferol Placebo |
SG PG |
91.0 ± 6.1 93.8 ± 7.8 |
87.8 ± 7.6 * 94.3 ± 9.8 |
9.6 ± 4.5 9.1 ± 7.3 |
8.2 ± 2.8 ** 11.7 ± 6.5 |
2.2 ± 1.1 2.1 ± 1.7 |
1.8 ± 0.6 ** 2.7 ± 1.6 |
| Raja-Khan et al. [20], 2014 | Cholecalciferol Placebo |
SG PG |
84.9 ± 9.5 83.7 ± 9.3 |
83.8 ± 8.0 77.6 ± 14.7 |
26.31 ± 9.6 27.1 ± 15.8 |
38.1 ± 37.6 28.7 ± 14.6 |
5.5 ± 1.8 5.8 ± 3.9 |
7.8 ± 7.4 5.7 ± 3.0 |
N/A: not available. SG: supplemented group. PG: placebo group. a In this study, additional supplementation with calcium alone was also tested. These results were not taken into account in this meta-analysis. b In this study, a second control group only took metformin. These results were not taken into account in this meta-analysis. * p < 0.05; ** p < 0.01; *** p < 0.001.
3.3. Effects of Vitamin D Supplementation on 25(OH)D Levels
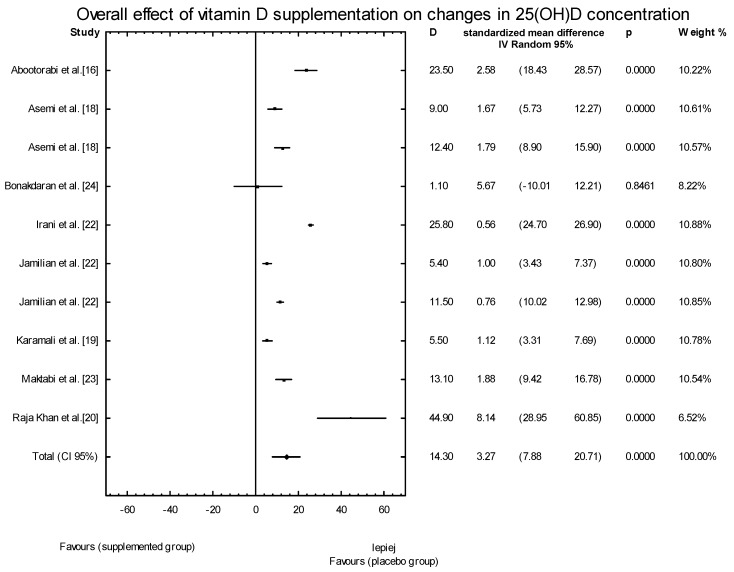
In the eleven studies, we assessed the effects of vitamin D supplementation on 25(OH)D serum concentrations. The baseline serum concentrations of 25(OH)D in the supplemented groups (SG) ranged from 6.9 ± 4.3 ng/mL [17] to 19.9 ± 9.5 ng/mL [20], and were similar to the values observed in the placebo groups. The low concentrations of 25(OH)D suggest the widespread presence of vitamin D deficiency or insufficiency in these groups of women with PCOS. In ten of the eleven studies, we observed an increase in the serum concentrations of 25(OH)D following supplementation with vitamin D, leading to improved serum levels ranging from 18.5 ± 4.9 ng/mL [22] to 67.4 ± 28.6 ng/mL [20] (Table 2). When the meta-analysis was conducted, significant overall effects of vitamin D supplementation on 25(OH)D concentrations were seen (SMD: 4.16, 95% CI: 3.92, 20.23, p = 0.0037; Figure 2).
Figure 2.
Overall effect of vitamin D supplementation on changes in 25(OH)D concentration in PCOS patients. Heterogeneity: Q = 902.5137, T2 = 163.1096, df = 9 (p < 0.0001); I2 = 99.0%.
3.4. Effects of Vitamin D Supplementation on Changes in Parameters Related to Insulin Resistance
Changes in fasting plasma glucose concentrations after vitamin D supplementation were analyzed in the nine studies determined to be eligible during the search process [11,12,13,14,15,16,17,18,19,20].
The average baseline blood glucose concentration ranged from 81.6 ± 10.00 mg/dL [14] to 99.8 ± 10.1 mg/dL [13] in the SG. Similar results were observed in the placebo groups. Following the intervention, mean fasting glucose concentrations decreased (by 6.3%) in individuals who received vitamin D supplementation alone (three selected studies) or as a co-supplement (two selected studies), while seven studies showed no differences in fasting blood glucose levels (Table 3).
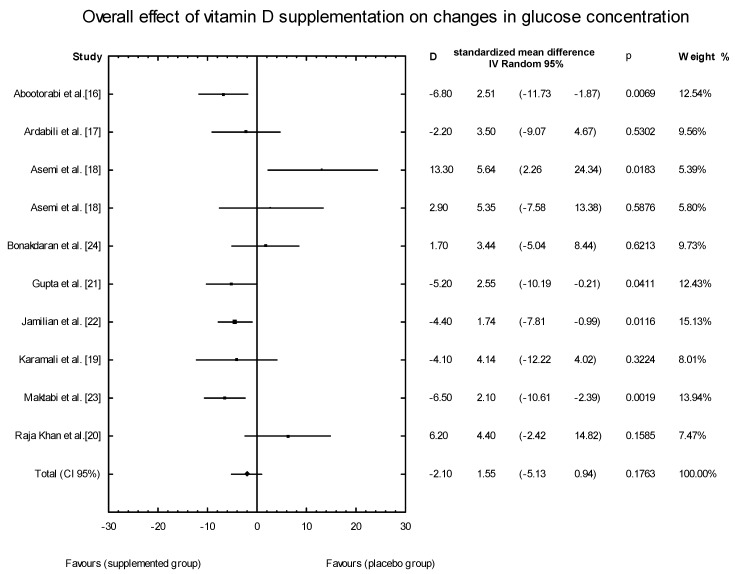
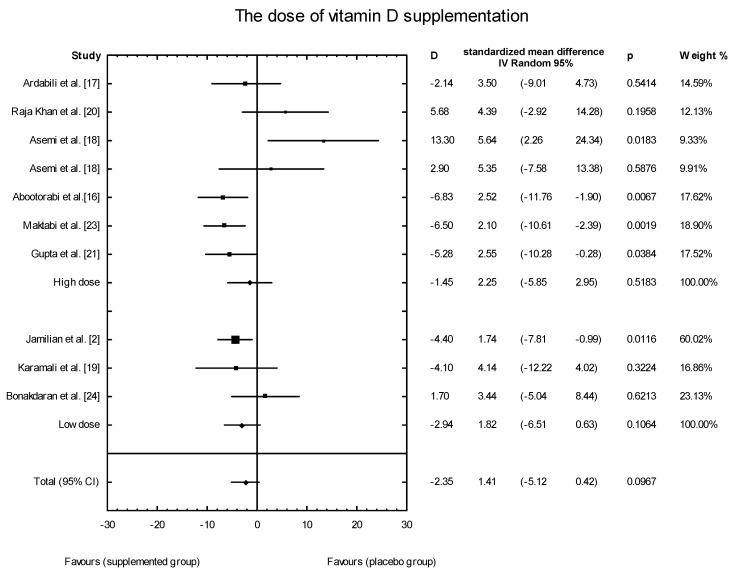
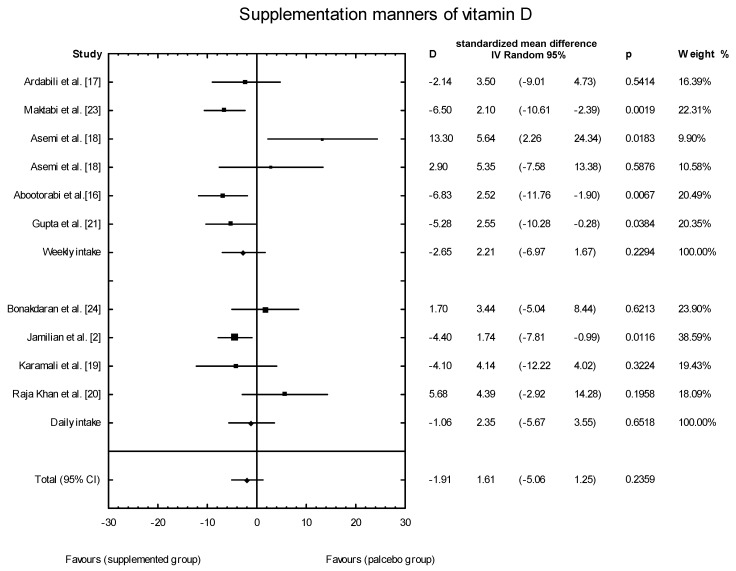
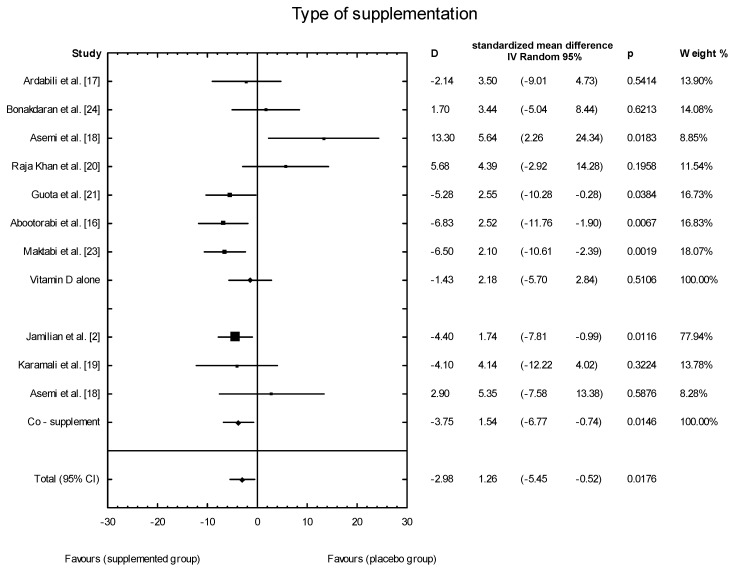
The meta-analysis showed no significant overall effect of vitamin D supplementation on fasting glucose concentrations (SMD: 1.54, 95% CI: −5.17, 0.85, p = 0.16, Figure 3), or when different doses of vitamin D were considered (high dose: SMD: 2.25; 95% CI: −5.85, 2.95; p = 0.52; low dose: SMD: 1.82; 95% CI: −6.51, 0.63; p = 0.11) (Figure 4), or when supplementation manner was considered (weekly dose: SMD:2.21; 95% CI: −6.97, 1.67; p = 0.23; daily dose: SMD: 2.35; 95% CI: −5.67, 3.55; p = 0.65) (Figure 5). However, the type of supplementation proved significant (vitamin D alone: SMD: 2.18; 95% CI: −5.70, 0.28; p = 0.51; co-supplement: SMD: 1.54; 95% CI: −6.77, −0.74; p = 0.0146) (Figure 6).
Figure 3.
Overall effect of vitamin D supplementation on changes in glucose concentration in PCOS patients. Heterogeneity: Q = 21.6993, T2 = 12.4443, df = 9 (p = 0.0099); I2 = 58.52%.
Figure 4.
The effect of different doses of vitamin D supplementation on glucose concentration in PCOS patients. High dose D = −1.45, p = 0.5183, T2 = 22.30; Low dose = D = −2.94, p = 0.1064; T2 = 2.49, Test for overall effects: Z = 0.4933 (p = 0.6218).
Figure 5.
The effect of supplementation manners on glucose concentration in PCOS patients. Daily intake D = −1.06, p = 0.6518, T2 = 11.29; Weekly intake D = −2.65, p = 0.229; T2 = 17.24, Test for overall effects: Z = 0.4933 (p = 0.6218).
Figure 6.
The effect of different types of supplementation on glucose concentration in PCOS patients. Vitamin D alone: D = −1.43, p = 0.5106, T2 = 21.86, Co-supplementation: D = −1.43, p = 0.0146, T2 = 0, Test for overall effects: Z = 0.8704 (p = 0.3841).
The effect of vitamin D supplementation on fasting insulin secretion was evaluated in nine studies. In the SG, whether alone or as a co-supplement, the mean fasting plasma insulin concentrations ranged from 9.60 ± 4.5 μLU/L [23] to 26.31 ± 9.60 μLU/L [20]. After the intervention, the mean fasting insulin levels had decreased significantly (by 22%) in individuals who received vitamin D supplementation alone (two studies) and as a co-supplement (two studies), while seven of the studies showed no differences in fasting blood insulin levels (Table 3).
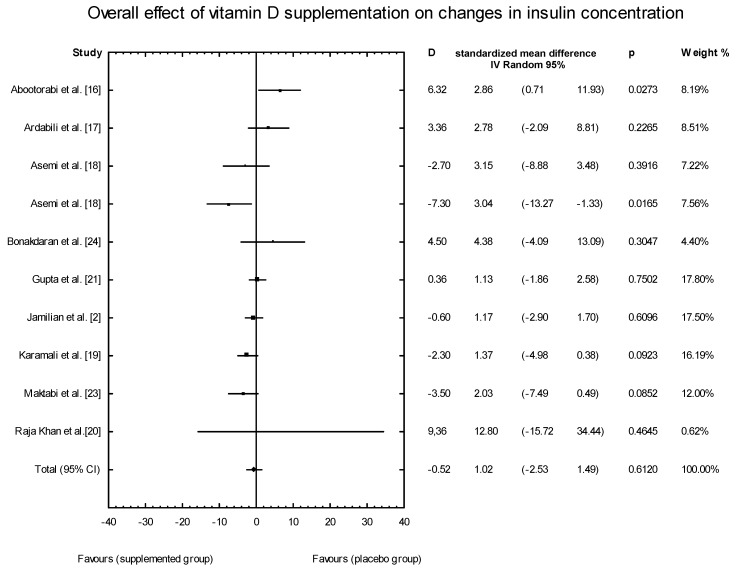
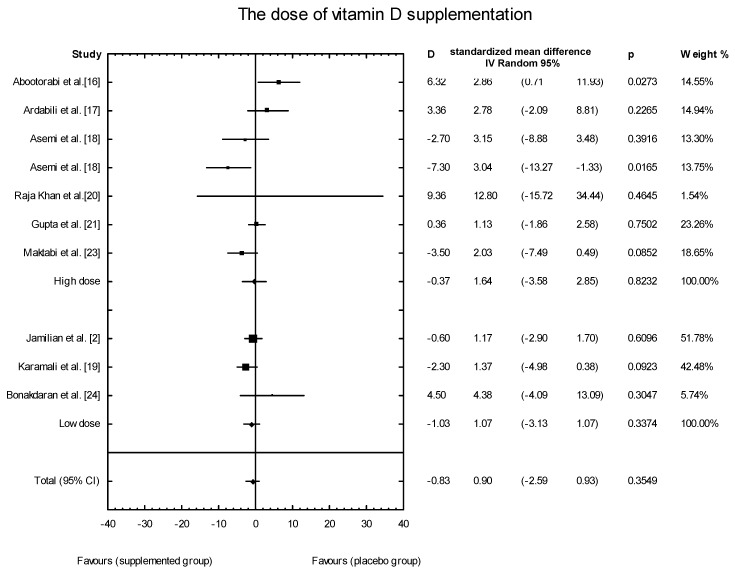
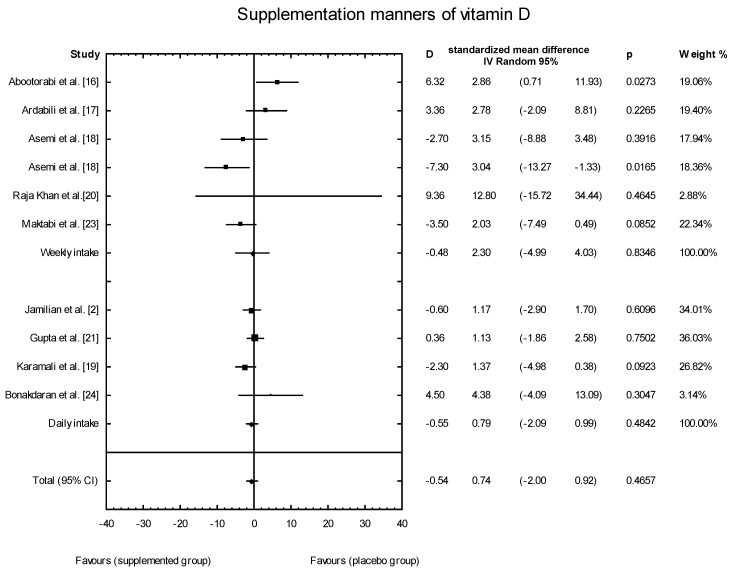
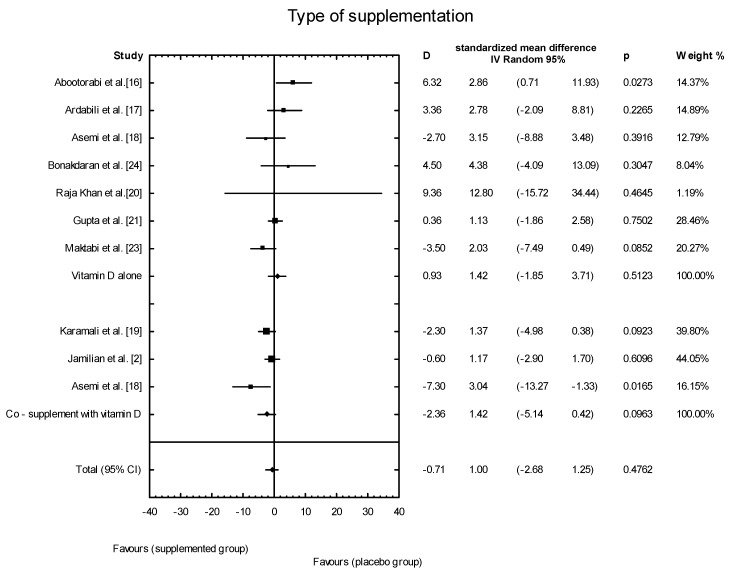
The meta-analysis showed no significant overall effect of vitamin D supplementation on insulin levels (SMD: 1.02, 95% CI: −2.53, 1.49, p = 0.6120, Figure 7), and no such effect when the different doses of vitamin D were taken into consideration (high dose: SMD:1.64; 95% CI: −3.58, 2.85; p = 0.82; low dose: SMD: 0.90; 95% CI: −2.59, 0.93; p = 0.35) (Figure 8), when supplementation manners were considered (weekly intake: SMD: −2.30; 95% CI: −4.99, 4.03; p = 0.83;daily intake: SMD: 0.79; 95% CI: −2.08, 0.99; p = 0.48) (Figure 9), or when the type of supplementation was considered (vitamin D alone: SMD: 1.42; 95% CI: −1.85, 3.71; p = 0.51; co-supplement: SMD: 1.42; 95% CI: −5.14, 0.42; p = 0.09) (Figure 10).
Figure 7.
Overall effect of vitamin D supplementation on changes in insulin concentration in PCOS patients. Heterogeneity: Q = 19.4134; T2 = 4.6214, df = 9 (p = 0.0219); I2 = 53.64%.
Figure 8.
Effect of different doses of vitamin D supplementation on insulin concentration in PCOS patients, high dose D = −0.37, p = 0.8232, T2 = 10.28, low dose D = −1.03, p = 0.3374, T2 = 0.84. Test for overall effects: Z = 33.84 (p = 0.7351).
Figure 9.
Effect of different supplementation manners on insulin concentration of vitamin D in PCOS patients. Daily in take D = −0.55, p = 0.4842, T2 = 0.44; weekly in take D = −0.48, p = 0.8346, T2 = 19.51; Test for overall effects: Z = 0.0287 (p = 0.9771).
Figure 10.
Effect of different types of supplementation on insulin concentration in PCOS patients. Vitamin D alone: D = 0.93, p = 0.5123, T2 = 3.19; co-supplement: D = −0.93, p = 0.5123, T2 = 5.78; Test for overall effects: Z = 1.6394 (p = 0.1011).
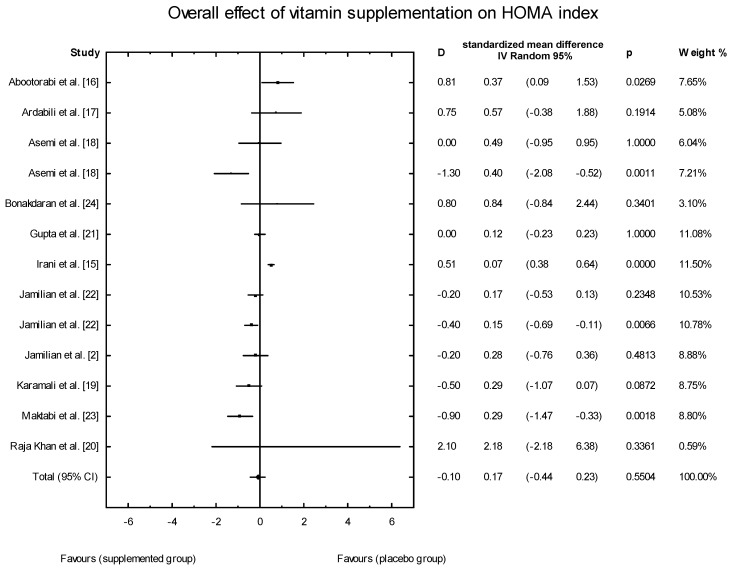
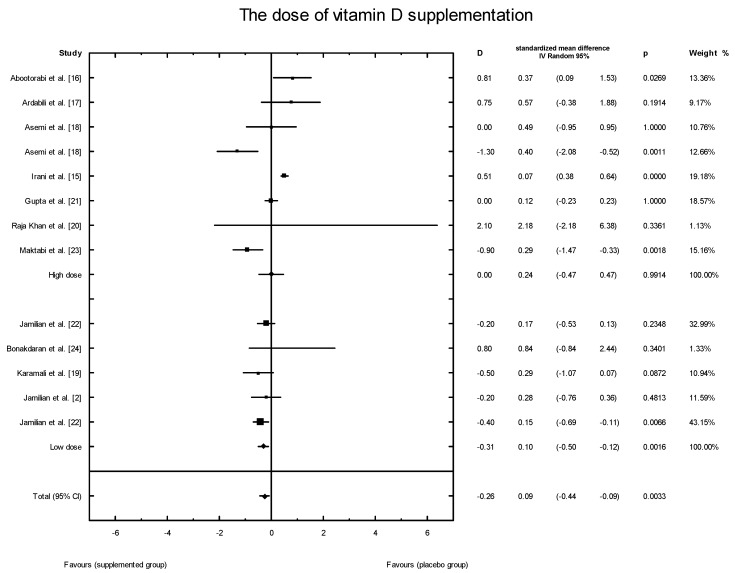
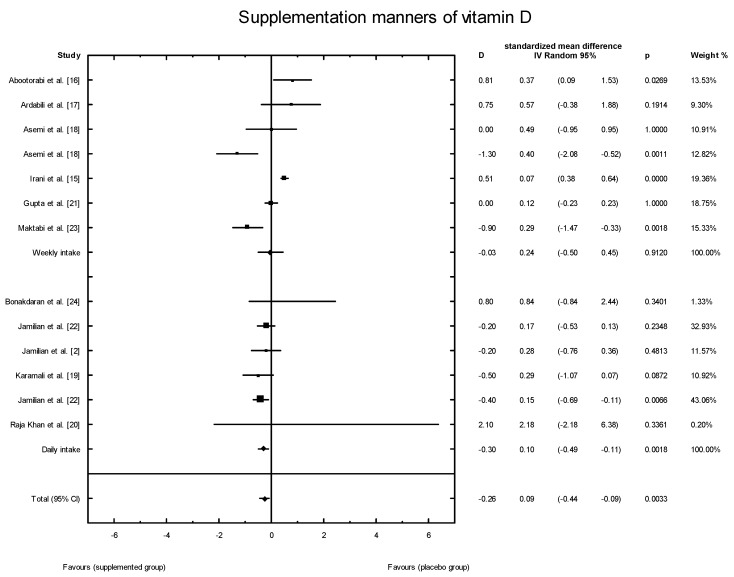
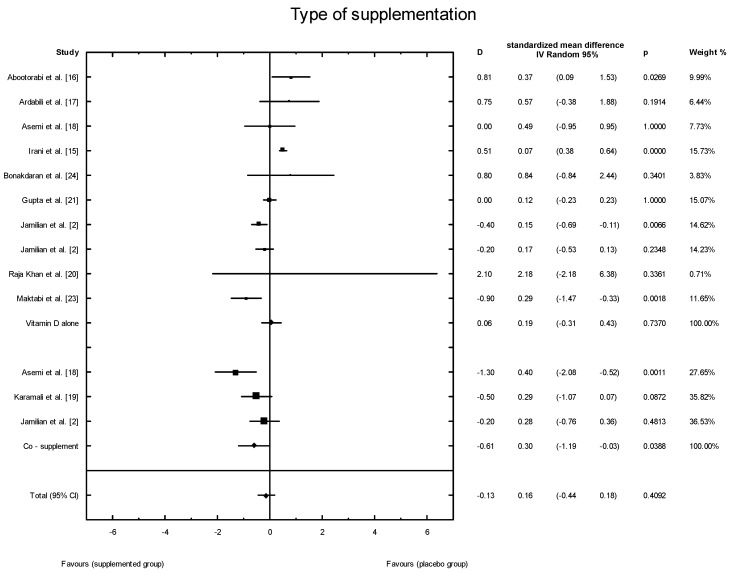
The effects of vitamin D supplementation on the HOMA-IR index were analyzed in all the selected studies. In the SG, the mean HOMA-IR ranged from 2.07 ± 0.37 to 5.47 ± 1.82 (Table 3). In five of the analyzed studies, the values of the HOMA-IR index decreased after vitamin D supplementation, but there were no significant effects of vitamin D supplementation on the HOMA-IR index overall (SMD: 0.17; 95% CI: −0.44, 0.23; p = 0.55, Figure 11). However, when the meta-analysis was conducted in specific subgroups, it was found that the dosage, supplementation manner, and type of vitamin D had a significant effect on HOMA-IR value (high dose of vitamin D: SMD: 0.24; 95% CI: −0.47, 0.47; p = 0.99; low dose: SMD: 0.10; 95% CI: −0.50, −0.12; p = 0.001; Figure 12;weekly intake: SMD: 0.24; 95% CI: −0.50, 0.45; p = 0.91; Figure 13; daily intake: SMD: 0.10; 95% CI: −0.49, −0.11; p = 0.002). Furthermore, the type of vitamin D supplement was also an important factor (vitamin D alone: SMD: 0.19; 95% CI: −0.31, 0.43; p = 0.74; co-supplement: SMD: 0.30; 95% CI: −1.19, −0.03; p = 0.04) (Figure 14).
Figure 11.
Overall effect of vitamin D supplementation on the HOMA-IR index in PCOS patients. Heterogeneity: Q = 86.9395; T2 = 0.2529, df = 12 (p = 0.000); I2 = 86.20%.
Figure 12.
Effect of different doses of vitamin D supplementation on HOMA-IR index in PCOS patients. High dose D = 0.18, p = 0.9914, T2 = 0.29; Low dose D = −0.31, p = 0.0016, T2 = 0.00; Test for overall effects: Z = 1.1770 (p = 0.2392).
Figure 13.
Effect of different manners of supplementation with vitamin D on HOMA-IR index in PCOS patients. Weekly in take D = −0.03, p = 0.9120, T2 = 0.30; Daily in take D = −0.30, p = 0.0018, T2 = 0.00; Test for overall effects: Z = 1.0570 (p = 0.2905).
Figure 14.
Effect of different types of vitamin D supplementation on HOMA-IR index in PCOS patients. Vitamin D alone: D = 0.06, p = 0.7370, T2 = 0.22; Co-supplement: D = −0.61, p = 0.0388, T2 = 0.16; Test for overall effects: Z = 1.9241 (p = 0.0543).
3.5. Publication Bias
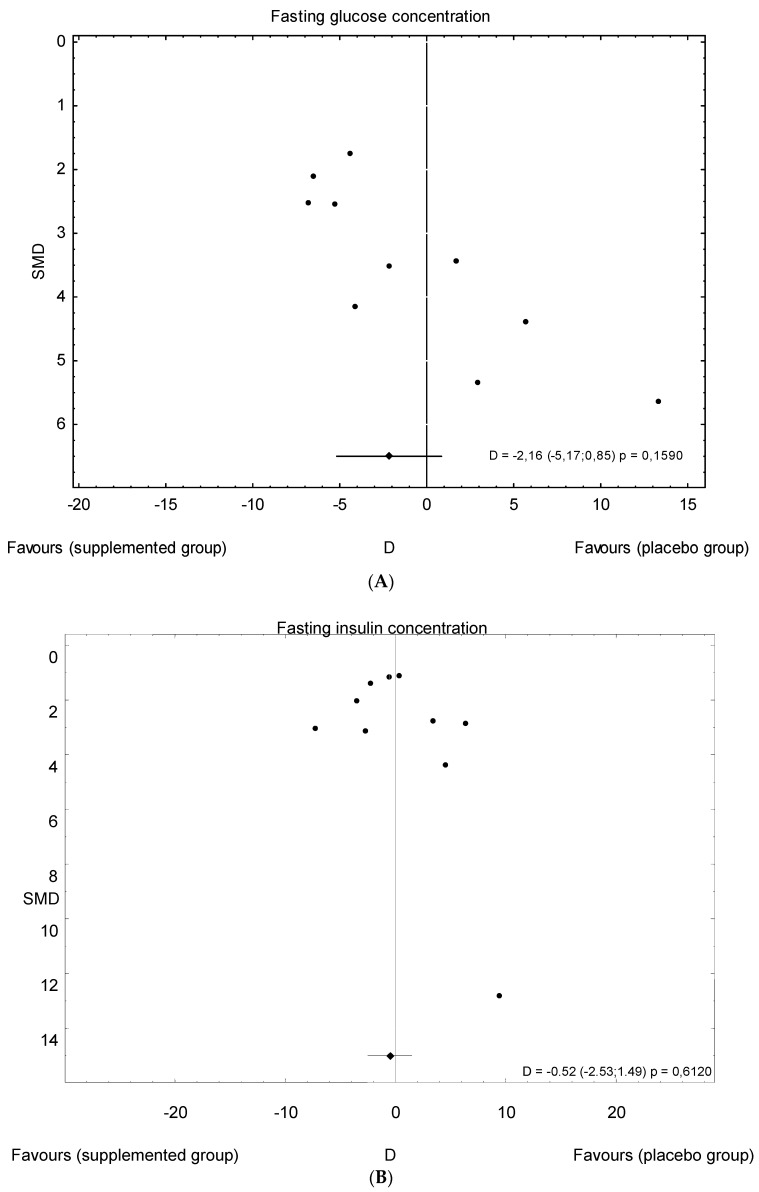
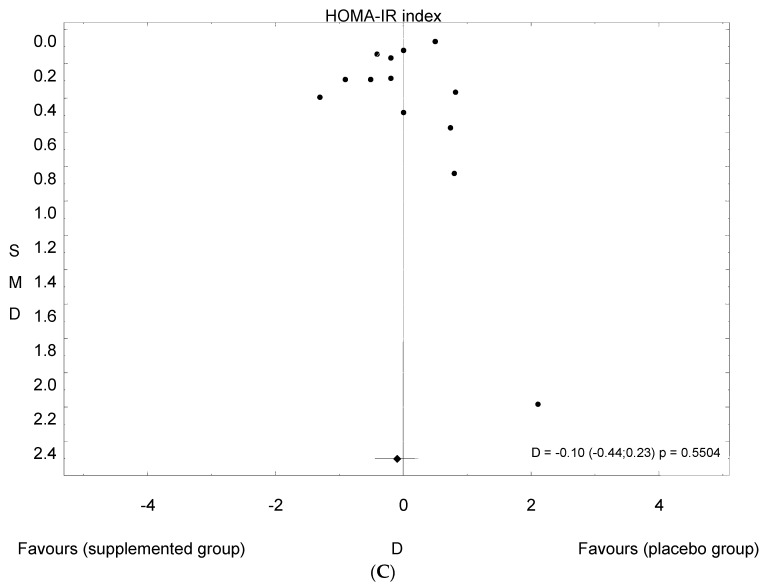
The funnel plots for serum vitamin D and fasting glucose, fasting insulin concentrations, and HOMA-IR indicate that there is a lack of smaller studies showing negative effects of vitamin D supplementation on vitamin D levels and positive effects on fasting glucose, fasting insulin concentrations, and HOMA-IR; this suggests that there is a possible, though minimal, publication bias. However, the number of studies available for each meta-analysis was no more than seven, which may be too small to assess the publication bias through funnel plots (Figure 15A–C).
Figure 15.
Funnel plot of standard error by standard differences in the means of plasma: (A) fasting glucose concentrations; (B) fasting insulin concentrations; and (C) HOMA-IR index in selected randomized controlled trials.
4. Discussion
We have presented here the effect of vitamin D supplementation on insulin resistance in women with PCOS. Our results indicate that vitamin D supplementation, in combination with the supplementation of calcium, vitamin K, zinc, and magnesium, may help improve the metabolic profile of women diagnosed with PCOS in terms of glucose concentration and HOMA-IR. Lower daily doses (<4000 IU/d) of vitamin D also helped lower the HOMA index.
Vitamin D deficiency is a common health problem that may affect up to half of the general adult population [36]. A relatively higher prevalence of vitamin D deficiency is observed among women with PCOS: approximately 67–85% of women with PCOS have insufficient levels of vitamin D [36]. In our meta-analysis, all patients had insufficient 25(OH)D levels. However, according to Sempos et al. [32], most but not all women had insufficient 25(OH)D levels (only in Raja-Khan et al. (2014)did women with PCOS receiving placebo have a mean of 25(OH)D concentrations above 20 ng/mL). Sempos et al. [32] indicate that, if this controversy over the definition of hypovitaminosis D is to be resolved, it will be necessary: (i) to standardize the measurement of serum total 25(OH)D in vitamin D research, as well as harmonize the measurement of other possible markers of vitamin D status; and (ii) to develop a rickets registry that includes a precise case definition of nutritional rickets, including other risk factors for nutritional rickets, and standardized measurements of 25(OH)D and vitamin D metabolites. Yet, even taking this into account, there are rational premises for supplementing women with PCOS with vitamin D.
Data from the collected trials with 601 women with PCOS show that vitamin D supplementation significantly increased 25(OH)D levels compared to the placebo group, with a mean difference of 17.27 ng/mL (95% CI, D = 12.07; Figure 1). This response was highly heterogeneous (Q = 902.5137, I2 = 99.0% and T2 test for heterogeneity 103.1096).
Many authors have suggested that there is an association between vitamin D status and metabolic dysfunctions—particularly insulin resistance—in women with PCOS. However, the results of randomized controlled trials that assessed the effect of vitamin D treatment of PCOS patients on glucose homeostasis remain inconclusive [15,18,24,37]. In a previous meta-analysis that only included the results of controlled randomized trials, the fasting glucose, fasting insulin, serum HOMA-IR, and QUICKI of PCOS patients did not change after supplementation with vitamin D [38,39]. The authors of that analysis suggested that several factors might explain these contrary results, including the different follow-up period of vitamin D supplementation, or supplementation with vitamin D alone or with other micronutrients. Similarly, in our meta-analysis, when the vitamin D supplementation was considered in the overall view, the regime did not significantly affect fasting glucose, fasting insulin, or HOMA-IR in women with PCOS. We thus decided to conduct a much more detailed analysis. It was recognized that the dose of vitamin D (low or high), the frequency of supplementation (daily or weekly), and the form in which vitamin D was given (alone or as a co-supplement) all held a crucial significance for glucose homeostasis. It was also seen that HOMA-IR decreased for low doses of vitamin D (≤4000 IU/d).This could be the result of the more regular absorption of vitamin D3 in the gut or better compliance.
Moreover, vitamin D in combination with other nutrients (especially calcium) significantly affected fasting glucose levels and HOMA-IR. There is still some conjecture as to whether calcium and vitamin D, alone or in combination, can affect insulin-secreting cells. It is known that insulin secretion is a calcium-dependent process; thus, vitamin D may influence pancreatic β-cells via the regulation of calcium concentrations [40]. Also, a beneficial effect of combined vitamin D and calcium on markers of glucose metabolism and lipid profiles in patients with type 2 diabetes mellitus [41] has previously been reported, but data on the effect of co-supplementation with vitamin D, vitamin K, magnesium, and zinc on markers of insulin metabolism and lipid profiles among vitamin D-deficient subjects with PCOS are still scarce.
It should be highlighted that the Endocrine Society Guidelines [31] recommend supplementation with 50,000 IU vitamin D3 once per week for eight weeks (this was the minimum time of supplementation in our meta-analysis).The results of the meta-analysis of Xue et al. [34] show that supplementation with a low dose of vitamin D was enough to reduce triglyceride levels, while supplementation with high doses was not beneficial. Sanders et al. [42] pointed out that high doses of vitamin D supplementation were harmful to health, because bolus doses of more than 500,000 IU of vitamin D3might increase the risk of fracture, alter biochemical markers, and caused issues with tolerability, such as gastrointestinal upset. However, in the studies included in our meta-analysis, no side effects of high doses of vitamin D supplementation were observed and weekly high doses also proved ineffective in lowering HOMA-IR.
In seeking to justify the combination of vitamin D with other ingredients and the use of co-supplementation in the treatment of insulin resistance in women with PCOS, it should be noted that magnesium participates in phosphorylation reactions of the signaling pathway of insulin; it is also part of the Mg2+-ATP complex. In addition, zinc intake may modulate the protein tyrosine phosphatase 1B, a key regulator of the phosphorylation state of the insulin receptor. Zinc has been documented to inhibit 5-α-reductase, which catalyzes the transformation of testosterone to its nonaromatizable form, dihydrotestosterone (DHT). Thus, elevated levels of zinc may help reduce PCOS-associated hyperandrogenemiaby inhibiting the transformation of testosterone to its active form, DHT. Furthermore, both animal and human studies have suggested that the adipokine regulatory ability, anti-inflammatory properties, and lipid-lowering effects of the vitamin K-dependent protein (osteocalcin) may mediate the beneficial functions of vitamin K in insulin sensitivity and glucose tolerance. It has also been reported that supplementation with vitamin D, vitamin K, and calcium may improve metabolic status through their effects on the up-regulation of the insulin receptor genes, the regulation of insulin secretion from pancreatic β-cells, and the enhancement of β-cell proliferation and adiponectin expression [18,38,39].
The strengths of this meta-analysis include its comprehensive literature search, the specified inclusion and exclusion criteria for the studies, the explicit methods of data extraction, the measures taken to reduce the influence of bias, and the assessment of heterogeneity. Our work also has some limitations. Firstly, it is possible that some studies published in the grey literature were omitted in the literature search. Secondly, there were many variations between the studies, including the nationality and race of the patients, age, methodology, drug doses, duration of treatment, and follow-up, as well as vitamin D formulation. Grossmann and Tangpricha identified four clinical studies that compared two different vehicles for delivering vitamin Din their systematic review. In healthy subjects, vitamin D in an oil vehicle produced a greater 25(OH)D response than vitamin D in a powder or an ethanol vehicle [43]. On the other hand, Coelho et al. indicated that vitamin D3 entering the bloodstream is not affected by capsule formulation [44]. Since there have been limited studies that have compared the effect of the vehicle substance on vitamin D bioavailability, future studies should examine bioavailability across different vehicle substances, such as oil, lactose powder, and ethanol [43]. Moreover, most studies included in the meta-analysis were conducted in Iran, where women’s skin is largely covered with clothes, thus preventing the sun stimulating vitamin D production; this may be associated with vitamin D deficiency. It may thus be incorrect to assume that the results of these Iranian studies can be directly compared with those of studies on Caucasian women.
However, in general, there have been very few works dealing with the effect of co-supplementation on the parameters of insulin resistance in PCOS women. Our results thus need to be further validated by larger prospective studies.
5. Conclusions
In conclusion, this systematic review provides evidence that vitamin D co-supplementation among PCOS women is effective in decreased fasting glucose concentration and HOMA-IR treatment. Additionally, HOMA-IR also decreased when vitamin D alone was taken every day (not once a week) and in low doses (<4000 IU/d).
Author Contributions
Conceptualization, K.Ł.; Methodology K.Ł., J.B. and M.J.; Software K.Ł., J.B. and M.J.; Validation K.Ł., J.B. and M.J.; Formal Analysis, K.Ł.; Investigation K.Ł.; Resources, K.Ł., J.B., M.J.; Data Curation, K.Ł.; Writing-Original Draft Preparation, K.Ł., J.B., M.J.; Writing-Review & Editing, K.Ł., J.B., M.J.; Visualization, K.Ł., J.B., M.J.; Supervision, J.B., M.J.; Project Administration K.Ł., J.B., M.J.; Funding Acquisition, K.Ł., J.B.
Funding
This research received no external funding
Conflicts of Interest
The authors declare no conflicts of interest.
References
- 1.Pan M.L., Chen L.R., Tsao H.M., Chen K.H. Relationship between polycystic ovarian syndrome and subsequent gestational diabetes mellitus: A nationwide population based study. PLoS ONE. 2015;21:e0140544. doi: 10.1371/journal.pone.0140544. [DOI] [PMC free article] [PubMed] [Google Scholar]
- 2.Jamilian M., Maktabi M., Asemi Z. A trial on the effects of magnesium-zinc-calcium-vitamin d co-supplementation on glycemic control and markers of cardio-metabolic risk in women with polycystic ovary syndrome. Arch. Iran. Med. 2017;20:640–645. [PubMed] [Google Scholar]
- 3.Song D.K., Hong Y.S., Sung Y.A., Lee H. Insulin resistanceaccording to β-cellfunction in women with polycystic ovary syndrome and normalglucosetolerance. PLoS ONE. 2017;12:e0178120. doi: 10.1371/journal.pone.0178120. [DOI] [PMC free article] [PubMed] [Google Scholar]
- 4.Baptiste C.G., Battista M.C., Trottier A., Baillargeon J.P. Insulin and hyperandrogenism in women with polycystic ovary syndrome. J. Steroid Biochem. Mol. Biol. 2010;122:42–52. doi: 10.1016/j.jsbmb.2009.12.010. [DOI] [PMC free article] [PubMed] [Google Scholar]
- 5.Marshall J.C., Dunaif A. Should all women with PCOS be treated for insulin resistance? Fertil. Steril. 2012;97:18–22. doi: 10.1016/j.fertnstert.2011.11.036. [DOI] [PMC free article] [PubMed] [Google Scholar]
- 6.Diamanti-Kandarakis E., Dunaif A. Insulin resistance and the polycystic ovary syndrome revisited: An update on mechanisms and implications. Endocr. Rev. 2012;33:981–1030. doi: 10.1210/er.2011-1034. [DOI] [PMC free article] [PubMed] [Google Scholar]
- 7.Traub M.L. Assessing and treating insulin resistance in women with polycystic ovarian syndrome. World J. Diabetes. 2011;2:33–40. doi: 10.4239/wjd.v2.i3.33. [DOI] [PMC free article] [PubMed] [Google Scholar]
- 8.Ito-Yamaguchi A., Suganuma R., Kumagami A., Hashimoto S., Yoshida-Komiya H., Fujimori K. Effects of metformin on endocrine, metabolic milieus and endometrial expression of androgen receptor in patients with polycystic ovary syndrome. Gynecol. Endocrinol. 2015;31:44–47. doi: 10.3109/09513590.2014.951321. [DOI] [PubMed] [Google Scholar]
- 9.Legro R., Barnhart H., Schlaff W., Carr B.R., Diamond M.P., Carson S.A., Steinkampf M.P., Coutifaris C., McGovern P.G., Cataldo N.A., et al. Clomiphene, metformin, or both for infertility in the polycystic ovary syndrome. N. Engl. J. Med. 2007;6:551–556. doi: 10.1056/NEJMoa063971. [DOI] [PubMed] [Google Scholar]
- 10.Kung J., Henry R.R. Thiazolidinedione safety. Expert Opin. Drug Saf. 2012;11:565–579. doi: 10.1517/14740338.2012.691963. [DOI] [PubMed] [Google Scholar]
- 11.Wamberg L., Kampmann U., Stødkilde-Jørgensen H., Rejnmark L., Pedersen S.B., Richelsen B. Effects of vitamin D supplementation on body fat accumulation, inflammation, and metabolic risk factors in obese adults with low vitamin D levels: Results from a randomized trial. Eur. J. Intern. Med. 2013;24:644–649. doi: 10.1016/j.ejim.2013.03.005. [DOI] [PubMed] [Google Scholar]
- 12.Mason C., Xiao L., Imayama I., Duggan C., Wang C.Y., Korde L., McTiernan A. Vitamin D3 supplementation during weight loss: A double-blind randomized controlled trial. Am. J. Clin. Nutr. 2014;99:1015–1025. doi: 10.3945/ajcn.113.073734. [DOI] [PMC free article] [PubMed] [Google Scholar]
- 13.Nagpal J., Pande J.N, Bhartia A. A double-blind, randomized, placebo-controlled trial of the short-term effect of vitaminD3 supplementation on insulin sensitivity in apparently healthy, middle-aged, centrally obese men. Diabet. Med. 2009;26:19–27. doi: 10.1111/j.1464-5491.2008.02636.x. [DOI] [PubMed] [Google Scholar]
- 14.Beilfuss J., Berg V., Sneve M., Jorde R., Kamycheva E. Effects of a 1-year supplementation with cholecalciferol on interleukin-6, tumor necrosis factor-alpha and insulin resistance in overweight and obese subjects. Cytokine. 2012;60:870–874. doi: 10.1016/j.cyto.2012.07.032. [DOI] [PubMed] [Google Scholar]
- 15.Irani M., Seifer D.B., Grazi R.V., Julka N., Bhatt D., Kalgi B., Irani S., Tal O., Lambert-Messerlian G., Tal R. Vitamin D supplementation decreases TGF-β1 bioavailability in PCOS: A randomized placebo-controlled trial. J. Clin. Endocrinol. Metab. 2015;11:11–4307. doi: 10.1210/jc.2015-2580. [DOI] [PubMed] [Google Scholar]
- 16.Abootorabi M., Ayremlou P., Behroozi-Lak T., Nourisaeidlou S. The effect of vitamin D supplementation on insulin resistance, visceral fat and adiponectin in vitamin D deficient women with polycystic ovary syndrome: A randomized controlled trial. Gynecol. Endocrinol. 2018;34:489–494. doi: 10.1080/09513590.2017.1418311. [DOI] [PubMed] [Google Scholar]
- 17.Ardabili H.R., Gargari B.P., Farzadi L. Vitamin D supplementation has no effect on insulin resistance assessment in women with polycystic ovary syndrome and vitamin D deficiency. Nutr. Res. 2012;32:195–201. doi: 10.1016/j.nutres.2012.02.001. [DOI] [PubMed] [Google Scholar]
- 18.Asemi Z., Foroozanfard F., Hashemi T., Bahmani F., Jamilian M., Esmaillzadeh A. Calcium plus vitamin D supplementation affects glucose metabolism and lipid concentrations in overweight and obese vitamin D deficient women with polycystic ovary syndrome. Clin. Nutr. 2015;34:586–592. doi: 10.1016/j.clnu.2014.09.015. [DOI] [PubMed] [Google Scholar]
- 19.Karamali M., Ashrafi M., Razavi M., Jamilian M., Kashanian M., Akbari M., Asemi Z. The effects of calcium, vitamins D and K co-supplementation on markers of insulin metabolism and lipid profiles in vitamin D-deficient women with polycystic ovary syndrome. Exp. Clin. Endocrinol. Diabetes. 2017;125:316–321. doi: 10.1055/s-0043-104530. [DOI] [PubMed] [Google Scholar]
- 20.Raja-Khan N., Shah J., Stetter C.M., Lott M.E., Kunselman A.R., Dodson W.C., Legro R.S. High-dosevitamin Dsupplementation and measures of insulin sensitivity in polycystic ovary syndrome: A randomized, controlledpilottrial. Fertil. Steril. 2014;101:1740–1746. doi: 10.1016/j.fertnstert.2014.02.021. [DOI] [PMC free article] [PubMed] [Google Scholar]
- 21.Gupta T., Rawat M., Gupta N., Arora S. Study of effect of vitaminDsupplementation onthe clinical, hormonal and metabolicprofile of the PCOSWomen. J. Obstet.Gynaecol. India. 2017;67:349–335. doi: 10.1007/s13224-017-1008-1. [DOI] [PMC free article] [PubMed] [Google Scholar]
- 22.Jamilian M., Foroozanfard F., Rahmani E., Talebi M., Bahmani F., Asemi Z. Effect of two different doses of vitamin D supplementation on metabolic profiles of insulin-resistant patients with polycystic ovary syndrome. Nutrients. 2017;24:1280. doi: 10.3390/nu9121280. [DOI] [PMC free article] [PubMed] [Google Scholar]
- 23.Maktabi M., Chamani M., Asemi Z. The effects of vitamin D supplementation on metabolic status of patients with polycystic ovary syndrome: A randomized, double-blind, placebo-controlled trial. Horm. Metab. Res. 2017;49:493–498. doi: 10.1055/s-0043-107242. [DOI] [PubMed] [Google Scholar]
- 24.Bonakdaran S., MazloomKhorasani Z., Davachi B., MazloomKhorasani J. The effects of calcitriol on improvement of insulinresistanc, ovulation and comparison with metformintherapy in PCOSpatients: A randomizedplacebo-controlledclinicaltrial. Iran. J. Reprod. Med. 2012;10:465–472. [PMC free article] [PubMed] [Google Scholar]
- 25.Hahn S., Haselhorst U., Tan S., Quadbeck B., Schmidt M., Roesler S., Kimmig R., Mann K., Janssen O.E. Low serum 25-hydroxyvitamin D concentrations are associated with insulin resistance and obesity in women with polycystic ovary syndrome. Exp. Clin. Endocrinol. Diabetes. 2006;114:577–583. doi: 10.1055/s-2006-948308. [DOI] [PubMed] [Google Scholar]
- 26.Hassan N.E., El-Orabi H.A., Eid Y.M., Mohammed N.R. Effect of 25-hydroxyvitamin D on metabolic parameters and insulin resistance in patients with polycystic ovarian syndrome. Middle East Fertil. Soc. J. 2012;17:176–180. doi: 10.1016/j.mefs.2012.04.005. [DOI] [Google Scholar]
- 27.Łagowska K., Bajerska J. The Role of Vitamin D Supplementation on Insulin Resistance in Women with Polycystic Ovary Syndrome: A Systematic Review. [(accessed on 15 March 2018)]; Prospero 2018 CRD 42018090572. Available online: http://www.crd.york.ac.uk/PROSPERO/display_record.php?ID = CRD42018090572.
- 28.Moher D., Liberati A., Tetzlaff J., Altman D.G. PRISMA Group. Preferred reporting items for systematic reviews and meta-analyses: The PRISMA statement. Ann. Intern. Med. 2009;151:264–269. doi: 10.7326/0003-4819-151-4-200908180-00135. [DOI] [PubMed] [Google Scholar]
- 29.Geisthovel F., Rabe T. The ESHRE/ASRMconsensus on polycysticovarysyndrome (PCOS)-an extended critical analysis. Reprod. Biomed. Online. 2007;14:522–535. doi: 10.1016/S1472-6483(10)60902-9. [DOI] [PubMed] [Google Scholar]
- 30.Wells G.A., Shea B., O’Connell D., Peterson J., Welch V., Losos M., Tugwell P. The Newcastle-Ottawa Scale (NOS) for assessing the quality of non randomised studies in meta-analyses. Eur. J. Epidemiol. 2011;25:603–605. [Google Scholar]
- 31.Holick M.F., Binkley N.C., Bischoff-Ferrari H.A., Gordon C.M., Hanley D.A., Heaney R.P., Murad M.H., Weaver C.M. EndocrineSociety.Evaluation,treatment, and prevention of vitamin D deficiency: An EndocrineSociety clinical practice guideline. J. Clin. Endocrinol. Metab. 2011;96:1911–1930. doi: 10.1210/jc.2011-0385. [DOI] [PubMed] [Google Scholar]
- 32.Sempos C.T., Heijboer A.C., Bikle D.D., Bollerslev J., Bouillon R., Brannon P.M., DeLuca H.F., Jones G., Munns C.F., Bilezikian J.P., et al. Vitamin D assays and the definition of hypovitaminosis D: Results from the First International Conference on Controversies in Vitamin D. Br. J. Clin. Pharmacol. 2018;84:2194–2207. doi: 10.1111/bcp.13652. [DOI] [PMC free article] [PubMed] [Google Scholar]
- 33.American Diabetes Association Diagnosis and classification of diabetes. Diabetes Care. 2016;39:513–521. [Google Scholar]
- 34.Gayoso-Diz P., Otero-González A., Rodriguez-Alvarez M.X., Gude F., García F., De Francisco A., Quintela A.G. Insulin resistance (HOMA-IR) cut-off values and the metabolic syndrome in a general adult population: Effect of gender and age: EPIRCE cross-sectional study. BMC Endocr. Disord. 2013;16:13–47. doi: 10.1186/1472-6823-13-47. [DOI] [PMC free article] [PubMed] [Google Scholar]
- 35.Jørgensen L., Paludan-Müller A.S., Laursen D.R., Savović J., Boutron I., Sterne J.A., Higgins J.P., Hróbjartsson A. Evaluation of the Cochrane tool for assessingrisk of bias in randomizedclinicaltrials: Overviewof publishedcomments and analysis of userpracticein Cochrane and non-Cochranereviews. Syst. Rev. 2016;5:80. doi: 10.1186/s13643-016-0259-8. [DOI] [PMC free article] [PubMed] [Google Scholar]
- 36.He C., Lin Z., Robb S.W., Ezeamama A.E. Serumvitamin Dlevels and polycystic ovary syndrome: A systematic review and meta-analysis. Nutrients. 2015;7:4555–4577. doi: 10.3390/nu7064555. [DOI] [PMC free article] [PubMed] [Google Scholar]
- 37.Selimoglu H., Duran C., Kiyici S., Ersoy C., Guclu M., Ozkaya G., Tuncel E., Erturk E., Imamoglu S. The effect of vitamin D replacement therapy on insulin resistance and androgen levels in women with polycystic ovary syndrome. J. Endocrinol. Investig. 2010;33:234–238. doi: 10.1007/BF03345785. [DOI] [PubMed] [Google Scholar]
- 38.Fang F., Ni K., Cai Y., Shang J., Zhang X., Xiong C. Effect of vitamin D supplementation on polycystic ovary syndrome: A systematic review and meta-analysis of randomized controlled trials. Complement. Ther. Clin. Pract. 2017;26:53–60. doi: 10.1016/j.ctcp.2016.11.008. [DOI] [PubMed] [Google Scholar]
- 39.Xue Y., Xu P., Xue K., Duan X., Cao J., Luan T., Li Q., Gu L. Effect of vitamin D on biochemical parameters in polycystic ovary syndrome women: A meta-analysis. Arch. Gynecol. Obstet. 2017;295:487–496. doi: 10.1007/s00404-016-4247-y. [DOI] [PubMed] [Google Scholar]
- 40.Jamka M., Woźniewicz M., Walkowiak J., Bogdański P., Jeszka J., Stelmach-Mardas M. The effect of vitamin D supplementation on selected inflammatory biomarkers in obese and overweight subjects: A systematic review with meta-analysis. Eur. J. Nutr. 2016;55:2163–2176. doi: 10.1007/s00394-015-1089-5. [DOI] [PubMed] [Google Scholar]
- 41.Gagnon C., Daly R.M., Carpentier A., Lu Z.X., Shore-Lorenti C., Sikaris K., Jean S., Ebeling P.R. Effects of combined calcium and vitamin D supplementation on insulin secretion, insulin sensitivity and β-cell function in multi-ethnic vitamin D-deficient adults at risk for type 2 diabetes: A pilot randomized, placebo-controlled trial. PLoS ONE. 2014;9:e109607. doi: 10.1371/journal.pone.0109607. [DOI] [PMC free article] [PubMed] [Google Scholar]
- 42.Sanders K.M., Nicholson G.C., Ebeling P.R. Is high dose vitamin D harmful? Calcif. Tissue Int. 2013;92:191–206. doi: 10.1007/s00223-012-9679-1. [DOI] [PubMed] [Google Scholar]
- 43.Grossmann R.E., Tangpricha V. Evaluation of vehicle substances on vitamin D bioavailability: A systematic review. Mol. Nutr. Food Res. 2010;54:1055–1061. doi: 10.1002/mnfr.200900578. [DOI] [PMC free article] [PubMed] [Google Scholar]
- 44.Coelho I.M., Andrade L.D., Saldanha L., Diniz E.T., Griz L., Bandeira F. Bioavailability of vitamin D3 in non-oily capsules: The role of formulated compounds and implications for intermittent replacement. Arq. Bras. Endocrinol. Metabol. 2010;54:239–243. doi: 10.1590/S0004-27302010000200022. [DOI] [PubMed] [Google Scholar]


