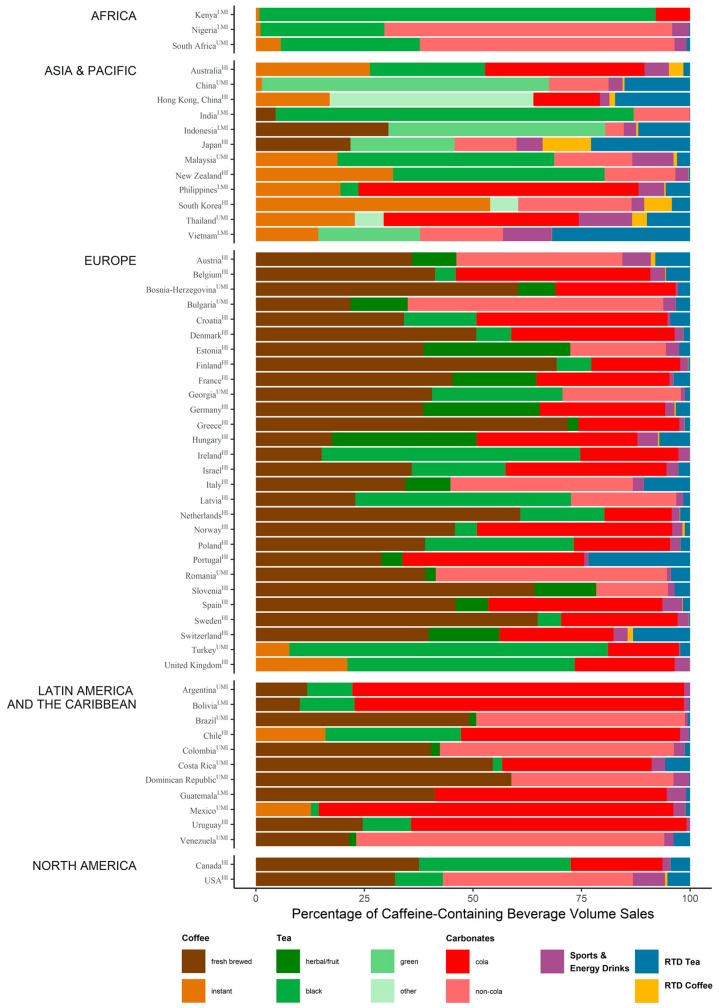
Figure 1.
Percentage of caffeine-containing beverage volume sales per beverage (Euromonitor 2017). Subcategories of coffee, tea, and carbonates were assigned according to the most commonly, but not exclusively, consumed beverage type in that category. Countries were classified by income based on World Bank 2017. HI: high-income; LI: low-income; LMI: lower-middle-income; UMI: upper-middle-income. Data for RTD beverages were incomplete for Kenya, Nigeria, South Africa, India, Bosnia-Herzegovina, Croatia, Estonia, Georgia, Latvia, Slovenia, Bolivia, Costa Rica, Dominican Republic, Guatemala, Uruguay, and Venezuela.

