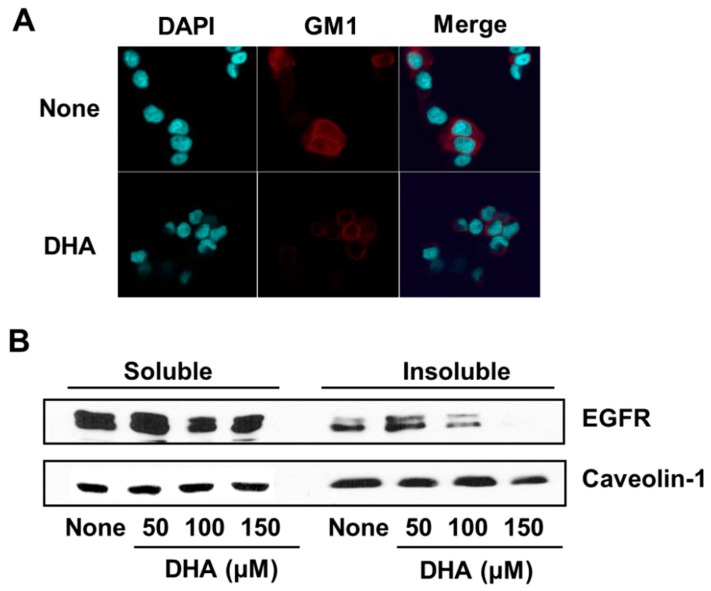
Figure 4.
The effect of DHA on monosialotetrahexosylganglioside (GM1) and EGFR levels in the lipid rafts of PANC-1 cells. Cells were treated for 4 h with 150 µM DHA (A) or the indicated concentrations of DHA (B). (A) Confocal microscope images. Fixed cells were stained with Alexa-fluor 555-conjugated cholera toxin subunit B (CTB-555) to identify the GM1 of lipid rafts, and with 4′,6-diamidino-2-phenylindole (DAPI) to locate the nucleus. The row of images labeled “None” corresponds to the extract from untreated cells and that labeled “DHA” to the extracts of cells treated with 150 µM DHA. (B) Western blot detection of EGFR associated with the soluble vs. insoluble fractions of PANC-1 cellular membranes generated using the detergent Triton X-100. Caveolin-1 was used as a marker for the plasma membrane. The column labeled “None” corresponds to the extract from untreated cells, and the columns labeled “50”, “100”, and “150” correspond to the extracts of cells treated with 50, 100, and 150 µM DHA, respectively.

