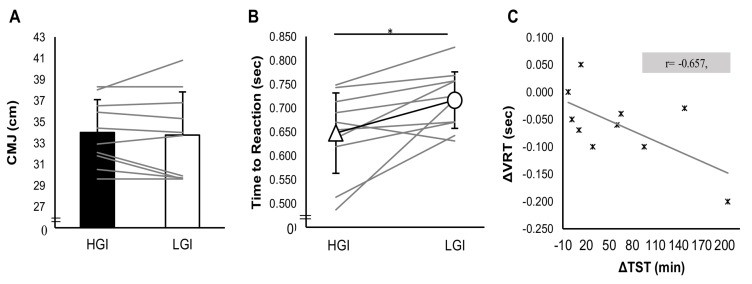
Figure 3.
Exercise performance in (A) countermovement jump test; (B) visual reaction test, between trials, and (C) the correlation of the difference between HGI and LGI total sleep time with the difference between the HGI and LGI visual reaction test. * Denotes statistical significant differences at the 0.05 level (2-tailed).

