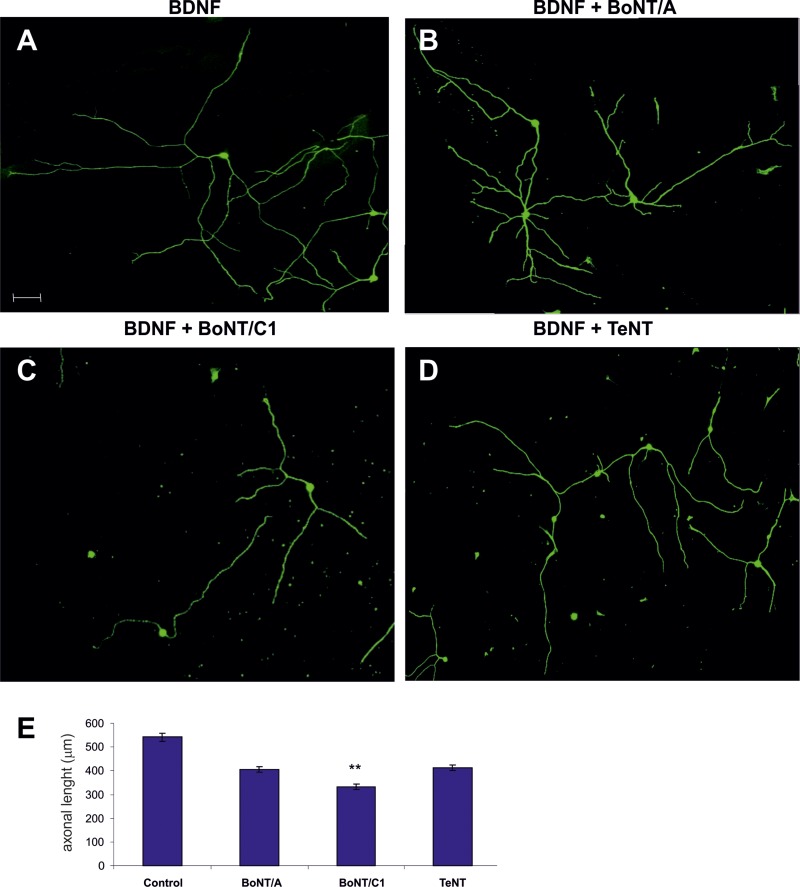
Figure 6.
Examples of Nodose primary cultures supplemented with BDNF (A) and treated with BoNT/A (B), BoNT/C1 (C) and TeNT (D–E) Bar graph showing the quantification of neurite length when treated with neurotoxins compared with control. Significant differences are labeled by asterisks (**p ≤ 0.01). An average of thirty neurons per condition were quantified in five separate experiments. Scale bar: A, 50 μm. Error bars indicate SEM.

