

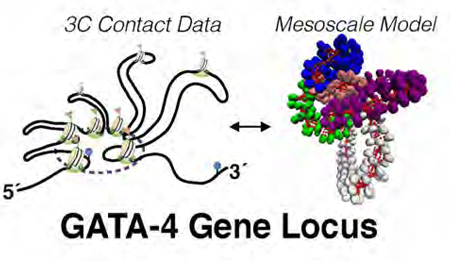
Abstract
While it is well recognized that chromatin loops play an important role in gene regulation, structural details regarding higher order chromatin loops are only emerging. Here we present a systematic study of restrained chromatin loops ranging from 25–427 nucleosomes (fibers of 5–80 Kb DNA in length), mimicking gene elements studied by 3C contact data. We find that hierarchical looping represents a stable configuration that can efficiently bring distant regions of the GATA-4 gene together, satisfying connections reported by 3C experiments. Additionally, we find that restrained chromatin fibers larger than 100 nucleosomes (~20Kb) form closed plectonemes, whereas fibers shorter than 100 nucleosomes form simple hairpin loops. By studying the dependence of loop structures on internal parameters, we show that loop features are sensitive to linker histone concentration, loop length, divalent ions, and DNA linker length. Specifically, increasing loop length, linker histone concentration, and divalent ion concentration is associated with increased persistence length (or decreased bending), while varying DNA linker length in a manner similar to experimentally observed ‘Nucleosome Free Regions’ (found near transcription start sites) disrupts intertwining and leads to loop opening and increased persistence length in linker histone depleted (−LH) fibers. Chromatin fiber structure sensitivity to these parameters, all of which vary throughout cell cycle, across tissue type and across species, suggests that caution is warranted when using uniform polymer models to fit chromatin conformation capture genome-wide data. Furthermore, the folding geometry we observe near the transcription initiation site of the GATA-4 gene suggests that hierarchical looping provides a structural mechanism for gene inhibition, and offers tunable parameters for design of gene regulation elements.
Graphical Abstract
Introduction
The hierarchical nature of DNA packaging in eukaryotic cells is not only remarkably efficient, but also remarkably precise. Nuclear chromatin is compacted by a factor of 4–5 orders of magnitude, yet it can still coordinate and manage a host of cellular processes with astonishing spatial and temporal precision. Despite fifty years of research, however, only a partial understanding of chromatin folding has been achieved, and structural details of the most condensed chromatin structures are still largely debated.1–3
At the the lowest levels of chromatin structure (0.1–1Kb), much is known, namely that ~147bp of double stranded DNA is wrapped tightly around 8 core histone proteins (H2A,H2B,H3 and H4), known as the nucleosome. Several of these nucleosomes in regular spacing along genomic DNA constitute chromatin primary structure, also referred to as ‘beads-on-a-string’ where nucleosomes are the beads and the string is DNA.4 Folding this primary structure so that nucleosomes come into contact with each other producing chromatin secondary structure takes various forms. The most common models include the two-start ‘zigzag’ organization, in which linker DNA is straight and crosses the fiber axis,5 and the one-start ‘solenoid’ organization, whose linker DNA is bent and does not cross the fiber axis.6 Secondary structure folding, however, can only partially account for the astonishing compaction found in the cell nucleus; interphase DNA is compacted 4 orders of magnitude, while metaphase DNA is compacted 5 orders of magnitude. In total, human genomic DNA undergoes 5 levels of folding, which are not only necessary to account for DNA packaging, but also for control and coordination of a wide variety of functional roles.7 Details of these structures, however, are still largely obscure.3,8
This obscurity is due in large part to the fact that tertiary chromatin features have only recently become accessible, due to advances in microscopy techniques,9 computational modeling,10 and chromosome conformation capture techniques (3C).11 Chromatin conformation capture techniques in particular provide information about long-range chromatin connections at the Kb-Mb level, confirming the presence of chromatin looping within the nucleus necessary for genetic function and inheritance.12–18 Currently, about a dozen specific gene loci with contact maps at Kb resolution have been reported (summarized in Table 1). These gene loci, which are thought to form the structural basis of genetic expression,19 form long-range contacts necessary for genetic activation and repression.20
Table 1.
| Gene Locus | Length (Kb) | N. of Loops | Function | [Ref] |
|---|---|---|---|---|
| Igκ | 35 | 1 | Mouse Ig Expression | 16 |
| GATA-4 | 80 | 5 | Hemoglobin expression | 12 |
| 𝛾-globin | 100 | 3 | Hemoglobin expression | 47 |
| Igf2/H19 | 100 | 4 | Insulin expression | 19 |
| b1 | 110 | 5 | Maize tissue formation | 48 |
| IFNG | 182 | 5 | Cytokine expression | 49 |
| β-globin | 190 | 4 | Hemoglobin expression | 50,51 |
| TH2 | 200 | 4 | Cytokine Activation | 22 |
| MHC class 1 | 300 | 5* | Immuno-response | 14 |
| PRE | 340 | 9 | Drosophila Thorax dev | 17 |
| α-globin | 443 | 9 | Hemoglobin expression | 52 |
| RARβ2 | 447 | 8 | DNA repair | 21 |
Contacts form with Nuclear Lamin as opposed to forming intrinsically.
The largest gene elements reported are around 400Kb, forming at least 8 loops,21 while the smallest gene elements are single loop structures of average size ~35Kb.16 Strikingly, there is a positive correlation between the number of loops observed at each gene loci and their size, with an average of one loop per 20–50 Kb, or roughly 1 loop per 100–200 nucleosomes. It is also interesting to note that in active gene loci functional regions (e.g., gene promoters and transcription start sites) are often found in the loop region furthest from chromatin contacts, or the distal part of the loop (e.g., the T-helper 2 cytokine locus.)22 In contrast, when chromatin folding inhibits gene expression (such as the GATA-4 gene locus),12 functional gene elements tend to be near the center of the folding hub, suggesting a unique structure/function relationship between the gene locus and gene expression: active functional regions tend to be situated around the periphery of the gene hub, while inactive functional regions are sequestered inward.23
One main difficulty in studying the underlying structure of gene loci is that the techniques used for sequencing or imaging DNA contacts may destroy higher-order chromatin structure. It is thus difficult to derive atomic/mesoscale resolution information beyond the number of nucleosomal contacts observed.24,25 Computational models can provide important structural information to help interpret chromatin contact data; in turn, conformation capture techniques provide validation measures for computational models of chromatin structure.1,3
Both all-atom models and coarse-grained mesoscale models have been used to study chromatin structure with great success (see reviews1,3,26). Additionally, macroscopic polymer models have been developed to fit experimental contact data and thus propose structures compatible with the data.8 All-atom models are limited by current computational capacities and thus are generally only applicable to a few nucleosomes. Mesoscale models can treat larger systems (1–100 nucleosomes, or 0.15–20Kb) while incorporating many internal fiber conditions such as DNA linker length,27 post-translational histone modifications,28 histone tail dynamics,29 linker histone concentration,30 and solvent/ion concentrations.31 Polymer models can simulate DNA systems as large as the cell nucleus, but cannot incorporate internal fiber conditions as well as many other aspects that affect chromatin structure.32 Moreover, while all-atom and mesoscale models rely on clear physical forces and energies, polymer models are more simplistic, and their interpretation warrants caution. Although no general consensus for the basic subunit of polymer models has yet been reached, many suggestions have been proposed. These include random polymer globular melts with confined volume,33 rosette like multi-looped structures,34 and globular structures with random loop lengths.8,35 Thus, the subject of chromatin looping on the level of 10–100Kb remains largely unknown.
Undoubtedly, chromatin structures are affected profoundly by nuclear proteins. Long-lived chromatin loops are often restrained by polycomb group proteins and cohesins,12 and the formation of these structures is integral in determining the fate of stem cell lines.15 Chromatin remodeling factors such as the ISWI and Chd1 remodeler complexes actively ensure regular nucleosomal spacing via an ATP-dependent reaction,36 while other chromatin remodelers such as chromodomain proteins (e.g., HP, Chd1,2,4,6,9, Brg1, and Ep400) bind nucleosomes or partially assembled nucleosomes to block or enhance transcription near the transcription start site.37,38 Super-enhancer proteins (e.g., Oct4 or Sox2) form another class of regulators that control chromatin folds by methylation and acetylation of histone tails,39 and details of the structural effects of these marks have only recently begun to be explored.28
To study these structures in mesoscopic detail, we have enhanced our chromatin mesoscale model27,29,30,40 by incorporating long-range chromatin contact data reported in experimental systems. Simulated restrained chromatin fiber loops ranging from 25–200 nucleosomes (~5–40Kb of DNA) allow us to explore the effects of variable parameters − loop length, linker histone concentration, divalent ion concentration, and DNA linker length − on structural characteristics of chromatin fibers near gene regulatory elements.
For example, the Nucleosome Repeat Length (NRL=147bp + linker DNA),41 exhibits changes as cellular machinery depletes chromatin of nucleosomes in small concentrated areas. These Nucleosome Free Regions (NFRs, also sometimes called nucleosome depleted regions) correlate with published DNAase hypersensitive sites and are typically found at both ends of the gene encoding region.42 Broadly classified narrow NFRs lack 1–2 nucleosomes while wide NFRs show sparse or short-lived histone variants across a stretch of ~1Kb. Both types have recently been implicated in embryonic stem cell differentiation.37,43 Despite their well demonstrated biochemical roles in transcription, their structural roles have only been suggested.8,27,44,45 Here we examine such structural effects of variable NRL at the apex of a 125 nucleosome loop by adjusting linker lengths to match the recently characterized ‘wide’ NFRs reported in bivalent embryonic stem cell genes by Dieuleveult et. al.37 We find that small regions of variable linker lengths open the plectoneme structure, increasing the associated persistence length. This response suggests a structural mechanism by which gene expression can be directly modulated at long range via nucleosome depletion, particularly in linker histone depleted (−LH) fibers.
The GATA-4 gene locus is an example of a gene hub which encodes transcription factors important for embryonic development and differentiation of myocardial tissue, which resides on the short arm of chromosome 8.46 Recently Tiwari et al. characterized the long-range connection data near this gene locus, reporting 5 distinct chromatin loops nucleated around one central connection hub enriched in H3 tail methylation (H3K27Me3), DNA methylation, and polycomb group proteins (for a schematic summary of these data, see supplemental Figure S1).12 Starting from the 5′ end of the chromatin fiber (direction of transcription) they find 3 short consecutive loops of length 8, 12, and 11 Kb (~ 41, 63, and 57 nucleosomes respectively), followed by 2 larger loops 30 and 21 Kb long (~157 and 109 nucleosomes, respectively). The transcription start site at the boundary between the third and fourth loop is thought to be enveloped by the formation of the complex, which inhibits gene expression. The precise mechanism for gene inhibition, however, remains speculative.
To investigate this structure in more detail, we built a mesoscale model of the GATA-4 gene locus by implementing 5 loop restraints mimicking connection data while simultaneously incorporating our previously developed mesoscopic energy function.27,29,30,40 We find that this looped complex has reduced persistence length and features a hierarchical looping folding motif, a motif recently reported by our modeling combined with cross-linking experiments for interphase and metaphase chromatin.10 These higher-order loops of loops are analogous to rope ‘flaking’ employed by mountain climbers to avoid tangling when folding long lengths of rope. Hierarchical looping can incorporate elevated long-range contacts while maintaining local zigzag geometry.10 In both the GATA-4 gene locus and individual loops studied here, we find that linker histone (LH) density and divalent ion concentrations affect the overall structures as measured by persistence lengths, internal energies, and folding characteristics. Specifically, linker histone depletion and magnesium presence are associated with increased higher-order folding. Furthermore, the folding geometry we observe near the transcription start site of the GATA-4 mesoscale model suggests that hierarchical looping provides a mechanism by which chromatin can completely envelop the transcription start site, helping to modulate gene activity via chromatin architecture.
Computational Methods
Mesoscale Chromatin Model
Energy Potential.
Our validated mesoscale chromatin model27,29,53 contains four distinct energy components; a modified worm-like chain polymer treatment to represent linker DNA residues that connect nucleosomes, energy terms determined by the Discrete Surface Charge Optimization algorithm (DiSCO)54 to represent the nucleosome core as a rigid electrostatic object, Cα coarse-graining energy terms to represent nucleosomal histone tails, and Cα coarse-grained energy terms to represent linker histone residues (See Figure 1). The total energy function is composed of DNA terms, histone tail terms, linker histone terms, excluded volume terms, Debye-Hückel electrostatic terms, and artificial restraint terms: E = EdnaS + EdnaB + EdnaT + EtS + EtB + ElhS + ElhB + EV + EC + ER, where the subscripts refer to DNA stretching, DNA bending, DNA torsion, histone tail stretching, histone tail bending, linker histone stretching, linker histone bending, excluded volume, electrostatic (coulombic), and restraint energies, respectively.
Figure 1:
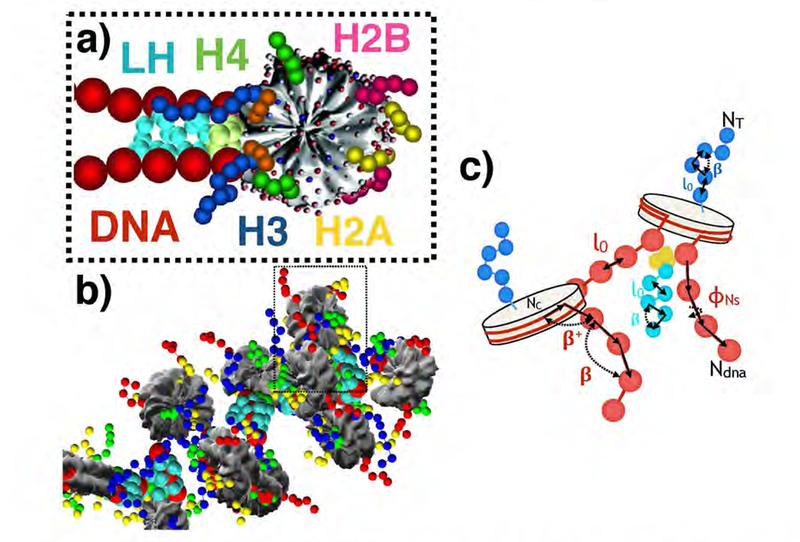
Nucleosome fiber model. a) Basic building block nucleosomes are represented as coarse-grained rigid cores with pseudo-charges approximating the electric field of the nucleosome core particle (PDB 1KX5)59 without histone tails. Linker DNA beads are drawn in red, while the linker histone globular head domain is shown in gold and the intrinsically disordered C-terminal domain of the linker histone is shown in teal.30 Histone tails are drawn in green, yellow, blue and red, corresponding to H4, H2A, H3 and H2B tails, respectively. b) Nine nucleosome fiber with tails and linker histones. c) Two nucleosome component with reference length and angles. Bending angles are labelled as β, while l0 refers to equilibrium distances and ϕNs refers to equilibrium torsions. DN terms are labelled in red, tail terms in blue, linker histone terms in teal, and indices are in black.
The properties of linker DNA are represented with three modified worm-like-chain terms, namely stretching, bending, and twisting. The DNA stretching energy is given by:
| (1) |
which ensures proper spacing between DNA beads, where h is the stretching rigidity of DNA, l0 is the equilibrium spacing between DNA residues, and Ndna is the total number of linker DNA residues in the chromatin polymer (See Figure 1). The energy of DNA bending, which depends on bending rigidity term g, is similarly given by:
| (2) |
where g depends on the persistence length LP of linker DNA and is given by .
The angle β refers to bending between consecutive linker DNA residues, and β+ refers to the bending angle between a linker DNA residue and the nucleosome, where IC indexes all nucleosome particles within the oligonucleosome chain. The energy of torsional strain between DNA residues depends on the number of base pairs represented. The DNA twist 10.3 bp per turn is used to determine the residual twist ϕNs per term. As such the energy of DNA twisting is given by:
| (3) |
where s is the twisting rigidity of linker DNA, and l0 is the DNA-residue separation distance, which corresponds to ~ 9 bp. The sum of Euler angles αi + γi defines the DNA twist value per residue. Further discussion is available in Ref.53 The energy of stretching between bonded histone tail residues is given by two sums:
| (4) |
The first term refers to tail-tail stretching of the k and (k + 1)th residues of the jth tail on the ith nucleosome core with force constant kbjk. The second sum represents the tail residues bonded directly to a nucleosome core which are held at a constant distance relative to the core by force constant htc, where the distance is determined by vector tij. The energy of bending between histone tail residues is given by:
| (5) |
where βijk refers to bending between the k and (k + 1)th residue of the jth histone tail of the ith nucleosome core. For more information on mesoscale representation and validation of histone tail residues see previous references.29,40 The energy of linker histones can similarly be calculated via stretch and bend terms:
| (6) |
| (7) |
where li0 and βi0 refer to equilibrium stretch and bend values for the ith linker histone residue respectively. Electrostatics in the mesoscale regime are described efficiently by the Debye-Hückel treatment, which takes the form:
| (8) |
where indices i and j run across all residues N in the system (LH, DNA, tail, and nucleosome core). Effective charges qi and qj, which are separated by distance rij, are screened by the dielectric constant ϵ, the electric permittivity of vacuum ϵ0, and the inverse Debye length κ. Note that bonded terms are not counted in the above summation. Residues are kept from overlapping in space by a standard Lennerd-Jones 12–6 potential:
| (9) |
where σij is the effective diameter for each bead type, and the parameter kij is used to ensure proper steepness of the excluded volume potential. Finally, distance restraints are represented with a harmonic spring potential of the form:
| (10) |
where k is a force constant between restrained nucleosome cores i and j separated by distance rij, and NRes is the total number of restraints implemented.
Model Parameters.
Linker DNA parameters were developed using Stigter’s procedure for electrostatic parameters,55 and a modified worm-like chain polymer model53,56 for mechanical terms, taking into account the persistence length of naked double stranded DNA (LP =50 nm) in bending terms. A value of l0 = 3.0 nm was used, corresponding to ~ 9 base pairs per coarse grained unit. Further details are discussed in reference.53 Twist terms are parameterized based on natural variations in DNA helical character, using 10.3 base pairs per turn, with some natural variation as reported in the literature.53,57 Additional DNA terms include s, h and g, which are taken from experimental values where DNA twisting rigidity s =14.3 Kcal/mol, bending rigidity g = 5.8 Kcal/mol, and stretching rigidity h =6.47 Kcal*nm2/mol (note that this term is computational, to ensure proper DNA-spacing). Histone tail bend, stretch, excluded volume, and partial charge parameters were developed by coarse-graining of brownian dynamics simulations.29 A total of 50 histone tail beads are used to represent the 8 histone tails (two copies each of H2A,H2B,H3, and H4). Linker histones are represented with 28 residues in total, 6 beads representing the rigid globular head domain and 22 beads representing the intrinsically disordered C-terminal domain.30 The N-terminal domain, which is relatively neutral in charge, is not represented explicitly as it has been shown that it is not crucial in chromatin fiber formation.58 Equilibrium values for linker histone residues were optimized from all-atom MD simulations as detailed in a previous reference by Luque et. al.30 The nucleosome core particles are represented as rigid electrostatic objects where the coarse-grained shape and surface charge are solved by our Discrete Surface Charge Optimization (DiSCO) algorithm,54 which approximates the electric field of the atomistic nucleosome (PDB 1KX5) without histone tails by a screened Coulomb potential, thereby placing pseudo-charges along the surface of the complex as a function of monovalent salt values.40,59 Divalent ions, if included, are treated by shortening the naked dsDNA persistence length to LP =30 nm and decreasing DNA-DNA electrostatic repulsion terms as has been observed experimentally and detailed in previous references.24,53,60
Restraints are implemented such that a harmonic energy penalty is applied to the separation distance between the center of two specified nucleosome cores. As such a non-zero equilibrium distance is needed to allow for steric overlap. To ensure that that we had fully minimized distances between nucleosome cores without introducing spurious energies due to steric clashing, the equilibrium restraint distance was decreased until the observable restraint distance converged, which coincided with 20 nm for individual loop systems and 50 nm for intra-fiber looping such as in the GATA-4 locus systems. These distances are close to radii reported for polycomb condensed nucleosome structures imaged by electron-microscopy (~40nm).61 A force constant of kij =10kcal/mol*nm2, was used for all individual loop restraints, and a force constant of kij =100kcal/mol*nm2 was used for GATA-4 mesoscale structures. For all systems studied the resulting energy penalties due to restraints applied account for <1% of total system energy.
Sampling Methods.
Four types of Monte Carlo (MC) moves are implemented to ensure efficient sampling, namely a global ‘pivot’ move, a configurationally biased ‘regrow’ routine,62 translation moves, and rotation moves. The global ‘pivot’ move consists of randomly choosing one DNA residue or nucleosome core and a random axis passing through the chosen component. The shorter half of the bisected oligonucleosome chain is then rotated around the randomly chosen axis. Regrow moves are only applied to histone tails, in which a tail chosen at random is ‘regrown’ bead by bead according to the Rosenbluth method.63 All DNA and linker histone beads are also sampled by translation and rotation moves, where the chosen bead is either translated or rotated a random distance or angle. All moves are then subject to standard Metropolis acceptance/rejection criteria.64
Starting Configurations, Simulation Parameters, and Convergence Checks.
All system starting coordinates were designed as idealized 2-start zigzag conformations with a z-rise of 2nm and an entry-exit angle of 43.15, as detailed in a previous reference.53 For all structures studied, a Nucleosome Repeat Length (NRL=DNA linker length + 147 bp) of 191 bp was used corresponding to the average human NRL,53 with the exception of simulated nucleosome depletion, the values of which are given in Figure 6. Individual loop structures were simulated at physiological salt conditions, [NaCl]=150mM with linker histone depleted (−LH), one linker histone per 2 nucleosomes , 1 linker histone per nucleosome (+LH), and 1 linker histone per nucleosome with divalent magnesium ions (+LH+Mg2+). GATA-4 gene structures were simulated with the above conditions and two more additional systems, namely linker histone depleted with divalent ions (−LH+Mg2+) and 1 linker histone per 2 nucleosomes with divalent ions . Individual loop structures were built of sizes 25, 50, 75, 100, 125, 150, and 200 nucleosomes in length which were then restrained end to end. Residual twist values were adjusted by −12, 0, or +12 degrees and run for additional steps to mimic natural variations in residual DNA twist.57 All individual loop systems were run for 60–120 million steps, were GATA-4 systems were run in excess of 120 million MC steps. Energies and local/global geometric parameters were carefully monitored to ensure convergence. Depending on system size, convergence was generally observed within the first 30–40 million steps for individual loops studied, where 427 nucleosome fibers converged within 60 million steps. For a sample energy evolution and convergence of geometric parameters see supplemental material Figure S3. The last 10 million frames of each structure was used for averaging and data analysis. Error bars are derived from the variance across the last 10 million MC steps.
Figure 6:
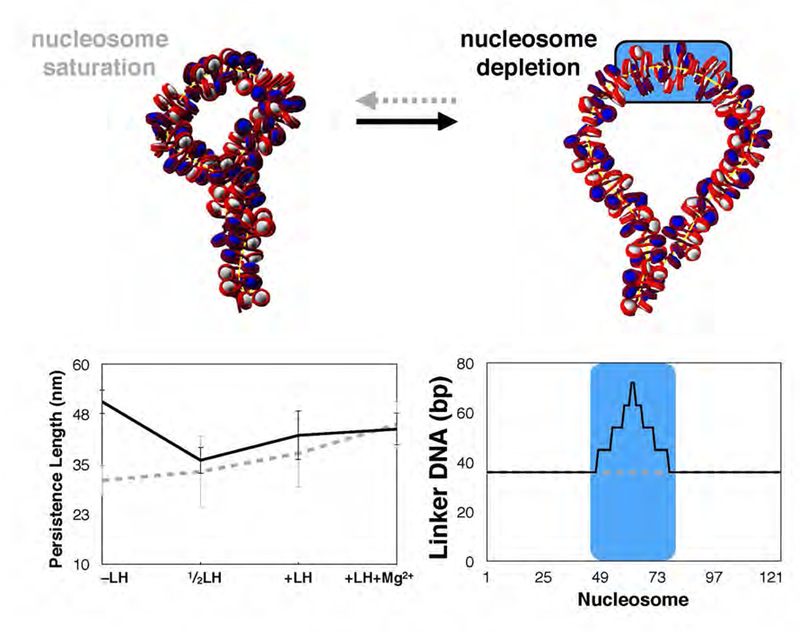
Loop architecture with “Nucleosome Free Regions” (NFR)73 modeled by increasing the DNA linker length at that region. The NFR increases persistence length, especially for −LH fibers (left). This manifests as an opening of the otherwise condensed plectoneme, suggesting a possible structural role for nucleosome depleted region.
GATA-4 Gene Locus Mesoscale Model.
We built our mesoscale model of the GATA-4 gene locus by combining 3C data published by Tiwari et al.12 with our own mesoscale potential and Monte Carlo (MC) sampling. Tiwari et al. report contacts spaced at 8,12,11,30 and 21 Kb, corresponding to chromatin loops of the size 41,63,57, 157 and 109 nucleosome fibers, respectively (for a schematic, see supplemental material S1). We built a corresponding 427 nucleosome fiber, where 5 separate restraints were implemented corresponding to chromatin contacts observed by Tiwari et. al. The resulting fiber and folding was driven only by the mesoscale energy function and specified restraints. All restraints implemented in the GATA-4 locus model are given in the Table 2 where a force constant Fk=100 Kcal/mol*nm2 and distance r0= 50 nm was used.
Table 2.
| Nucleosome 1 | Nucleosome 2 | Loop Length (Nucleosomes) |
|---|---|---|
| 1 | 43 | 43 |
| 43 | 104 | 61 |
| 104 | 161 | 57 |
| 161 | 318 | 157 |
| 318 | 427 | 109 |
| 427 | 1 | - |
Data Analysis and Computation.
To further characterize folding and analyze attributes of the fiber, we treat the polymer axis as a 3D parametric curve where with j = 1, 2 and 3 refers to the x, y, and z component parametric curves respectively. We fit these polynomials of the form:
| (11) |
where the degree of the polynomial is chosen such that it is appropriate for fitting of the fiber axis (longer, bent axes require higher polynomials of order n ≈ 10, where short fibers require n ≈ 3) by a standard least squares fitting procedure. The resulting polynomial is then used to compute the fiber axis length, compaction ratios, and persistence length. More specifically, the persistence length of polymers is defined as the decay time of the correlated vectors tangent to the polymer axis:
| (12) |
where θ refers to the angle subtended by subsequent tangent lines along the index of the polymer position vector s, or the angle subtended by and , while brackets indicate a mean. Persistence length Lp is a measure of bending flexibility and describes the distance on which correlations of tangent vectors are maintained. Thus, polymers with a short persistence length have a high occurrence of folding, whereas long persistence lengths indicate a stiff fiber with low occurrence of folding. Contact matrices are calculated by counting a “contact” for each fiber snapshot whose elements (tail, core or linker DNA) are within the sum of the van der Waals radius (~2 nm) and normalized across all frames, as discussed in Ref.10
All individual loop MC simulations and fiber analysis calculations were performed on the local NYU High performance computing cluster, a mixed architecture platform consisting of 230 Dell Intel Nehalem nodes (2,528 cores) and 79 SUN AMD Barcelona nodes (1,264 cores) mixed architecture, while the GATA-4 MC runs used Los Alamos National Labs Institutional Computing resources. Individual chromatin loop simulations run on the NYU cluster for 100 million steps require ~1800 processor-hours with 12 processors per run. GATA-4 fibers were run on Los Alamos National Lab Internal Computing resources, where computation of 100 million MC steps requires ~90,000 processor hours using 300 processors per run.
Results and Discussion
Restrained chromatin structures exhibit higher order folding.
For the wide variety of structural conditions investigated, resulting chromatin loops display robust features (See Figures 2a, 2b, 3a and 3b). We consider individual loops with no linker histones (−LH), one linker histone per 2 nucleosomes , 1 linker histone per nucleosome (+LH), and 1 linker histone per nucleosome with magnesium ions (+LH+Mg2+). Our chromatin fibers of varying lengths were restrained such that end to end nucleosomes are in contact without introducing external strain (see Methods). Results of individually restrained loop structures fall into two categories, those larger than 100 nucleosomes, which have several features of higher-order folding (Figure 2b), and restrained loops smaller than 100 nucleosomes, which form simple loops with few higher order features (Figure 2a). Structural characteristics are sensitive to the linker histone and divalent ion concentrations, both of which affect chromatin structure profoundly.24,65 Specifically, −LH fibers tend to form hierarchical folds due to the absence of stabilizing linker histone stems.66 The sub-saturated or fully saturated (+LH) fibers form twisted plectonemes, showing features of supercoiling, as is shown in interaction matrices given in Fig. 3a. Divalent ions enhance chromatin compaction through some gentle linker DNA bending.24
Figure 2a:
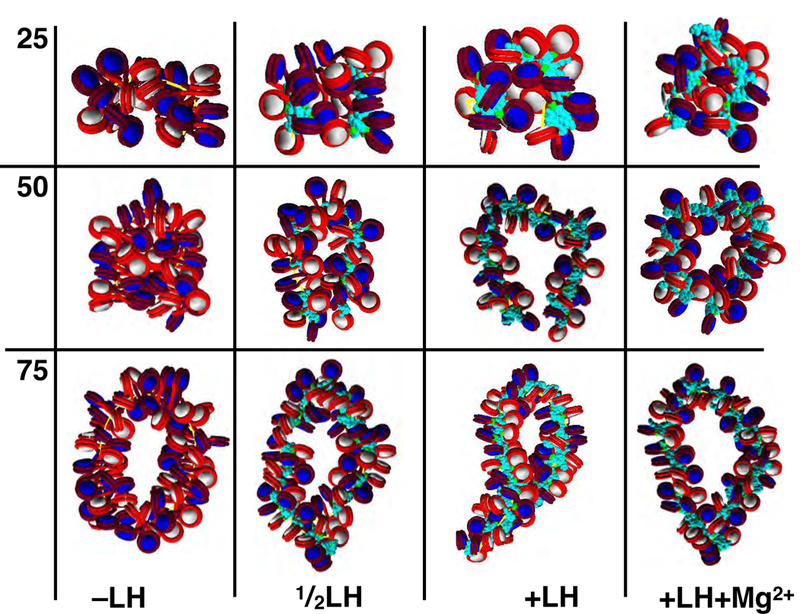
Space filling representation of restrained loop structures of 25, 50, and 75 nucleosomes (~.5, 10, 15Kb) for −LH, LH, +LH, and +LH+Mg2+ fibers. We find that for all loop lengths smaller than ~100 nucleosomes (~ 20Kb), restrained loops do not form higher order folds.
Figure 2b:
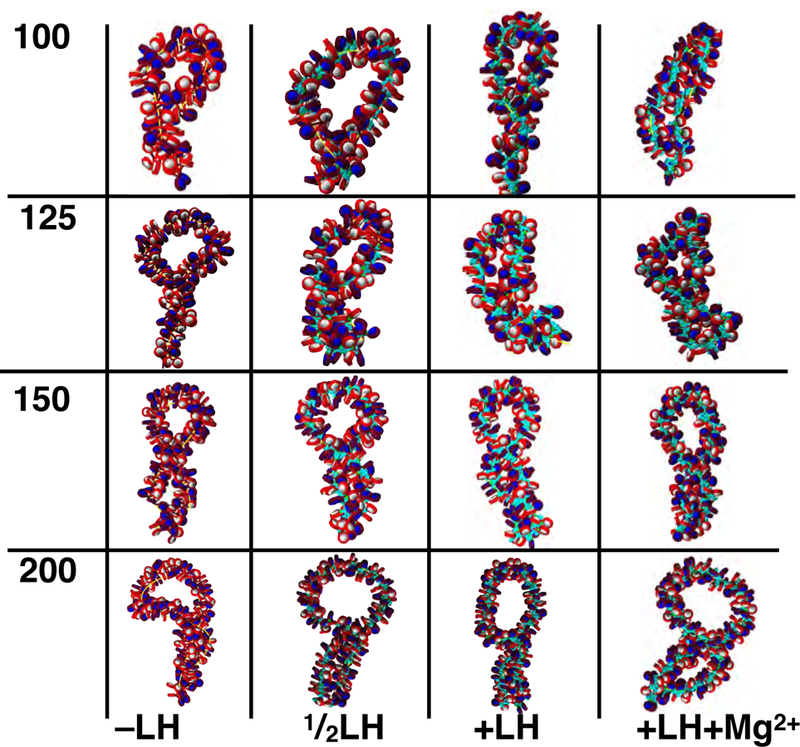
Space filling representation of restrained loop structures of 100, 125, 150 and nucleosomes (~ 20, 25, 30, 40 Kb) for−LH, LH, +LH, and +LH+Mg2+ fibers. We find that for all loop lengths larger than 100 nucleosomes (~ 20Kb), restrained fibers form twisted plectonemes, with interdigitation near the base and mini-loops near the distal part of the loop. These mini-loops can undergo further folding, which is modulated by increasing linker histone (LH) and divalent ion (+Mg2+) concentration.
Figure 3a:

Representative internucleosome interaction matrices for 50-nucleosome restrained-loop fibers with −LH, LH, +LH, and +LH+Mg2+. Local contacts cluster along the diagonal, where fibers show dominant zigzag organization, and simple hairpins are evident by regions perpendicular to the main diagonal. For both systems, divalent ions and linker histones decrease the strength (percentage of occurrence) of higher-order interactions, shown as weaker diagonal hairpins. Additional interaction matrices for other loops sizes are provided in Supporting Information.
Figure 3b:
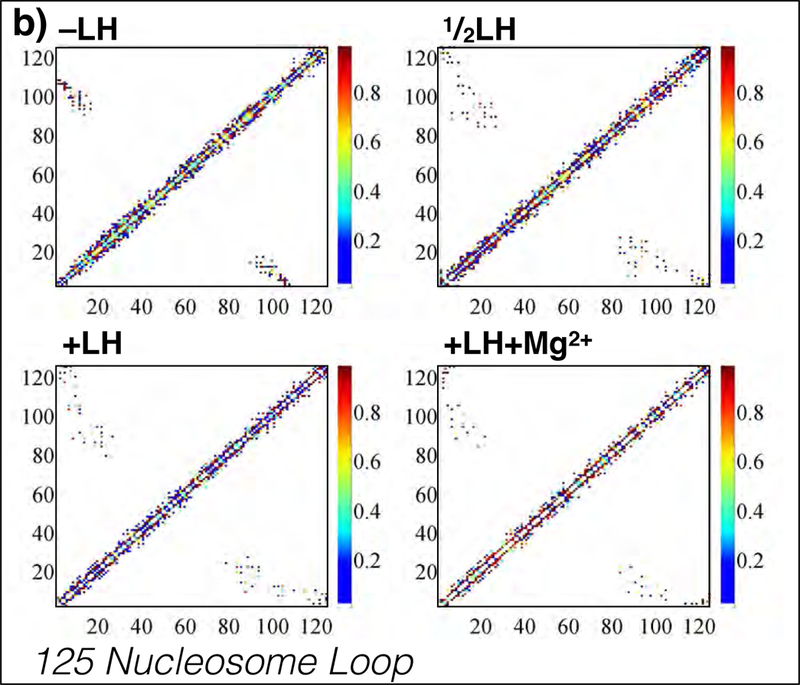
Representative internucleosome interaction matrices for 125-nucleosome restrained-loop fibers with −LH, LH, +LH, and +LH+Mg2+. Local contacts cluster along the diagonal, where fibers show dominant zigzag organization, and simple hairpins are evident by regions perpendicular to the main diagonal. For both systems, divalent ions and linker histones decrease the strength (percentage of occurrence) of higher-order interactions, shown as weaker diagonal hairpin regions. Additional interaction matrices for other loop sizes are provided in Supporting Information.
More specifically, Figs. 3a and 3b show all pairwise internucleosome contact strengths for two representative fibers of 50 and 125 nucleosomes. Local contacts (primarily dominated by i+2 contacts) fall along the diagonal. Hairpins are indicated as regions running perpendicular to the main diagonal. In fibers <100 nucleosomes long, simple hairpins running the length of the fiber are present (Fig. 3a), whereas in longer fibers the hairpin regions extend slightly toward the bottom left of the plot, indicating plectoneme twisting or fiber supercoiling (Fig. 3b). Both features are evident in the fiber snapshots (see Fig. 2b). Furthermore we note that linker histone and divalent ions act to modulate the nature of hairpin contact and intradigitation, seen here as a widening of the hairpin region.
Figure 4 depicts the results of incorporating 3C connectivity data observed by Tiwari et. al.12 near the GATA-4 gene locus into a single 427 nucleosome fiber, where the 5 loop regions are shown in 5 colors from the 5′ to 3′ ends (direction of transcription), also labeled as 1–4, respectively. The transcription start site resides on the boundary between green and white regions in panel (a). Subsequent folding is drawn in panels (b-e) of the figure. Strikingly, the fiber adopts a series of stacked loops similar to folding motifs recently observed in chromatin by our combination of Electron Microscopy Assisted Nucleosome Interaction Capture (EMANIC) data and mesoscale modeling.10 Three small consecutive loops (labeled as 1, 2 and 3 or in pink, blue and green) stack via one large hierarchical fold, defining a compact environment near the connection hub, while linker histone presence encourages additional stacking with the right-most (4, purple) loop, establishing a dense local hub. The largest loop (3, white), does not stack with the rest of the loops, extending further than 150 nm away from the connection hub (see panel f). In panel g, the hierarchical looping formation is shown schematically, where the red line represents the fiber axis.
Figure 4:
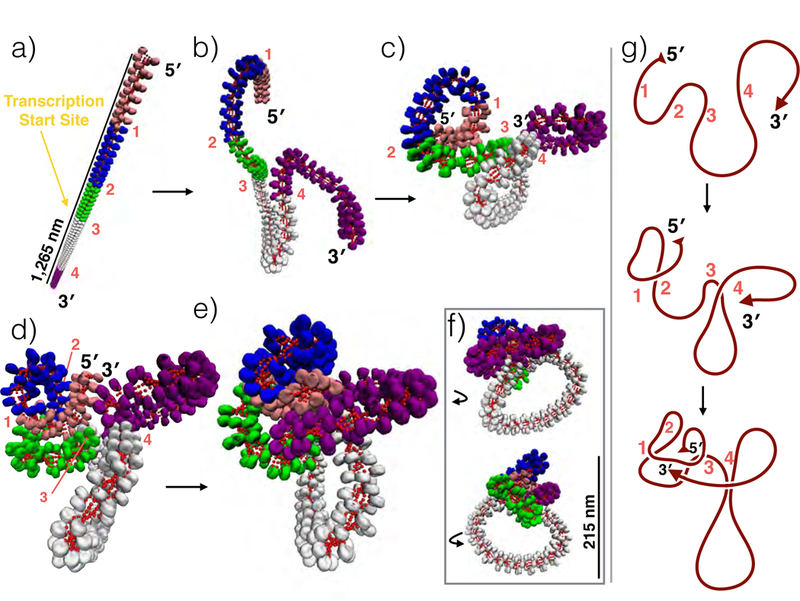
Folding schematic of the GATA-4 mesoscale gene locus model. a) Linear GATA-4 gene locus (80Kb) with 3C loop regions reported by Tiwari et al.12 indicated in pink, blue, green, white, and purple (indicated with 1,2,3, and 4). Artificial restraints were placed on the fiber to bring each boundary region to within 50 nm of one another. b-d) Intermediate states drawn to show formation of hierarchical folds and e) final structure observed by mesoscale modeling. f) Same as e) but rotated left and right. g) Cartoon of the chromatin fiber axis showing formation of the fold. This folding scheme decreases total fiber length by >1,000 nm and blocks access to the transcription start site, located at the boundary of green and white loop regions.
It has been proposed that interphase chromosomes are organized into rosette-like sets of chromatin loops with random sizes restrained by local environment.67 By necessity these proposals often simplify certain aspects of chromatin structure such as nucleosome positioning or other internal conditions in attempting to fit the long-range connection data. Our results support the hypothesis that chromatin folding at the tertiary level (1–100Kb) forms a series of stacked loops, where hierarchical looping acts as the main mechanism by which sequential small loops (>100 nucleosomes) form higher-order contacts. Additionally, these structures are sensitive to internal conditions such as linker histone and divalent ion presence, which vary throughout the cell and cell cycle stage. Hierarchical looping not only allows for efficient compaction, but also for reversible enveloping of the transcription start site near the connection hub (Figure 4). This is particularly relevant because formation of this complex inhibits gene activation upon formation.
Restrained loop persistence length depends on linker histone concentration, loop length, and NRL.
Figure 5 presents the persistence length of individually restrained loops of sizes varying from 25–200 nucleosomes in length. Persistence length Lp is a statistical measure of fiber stiffness, formally given as the distance over which axis tangent vector correlations are maintained. We see that LP increases as the length of the restrained loop increases, where small loops have a persistence length ~25 nm, and large fibers have persistence lengths as large as 75 nm. This is in agreement with previously estimated persistence lengths, which vary widely depending on the type of method used for estimation.25,67,68 Primarily, these data suggest that persistence length is affected by the size of loop. This is in contrast to longer unrestrained fibers (100 nucleosomes) where inter-fiber loops have been observed to form spontaneously.10 Together, these observations suggest that higher-order tertiary chromatin folding is thermodynamically stabilized by emergent interactions not present for small isolated fibers.
Figure 5:
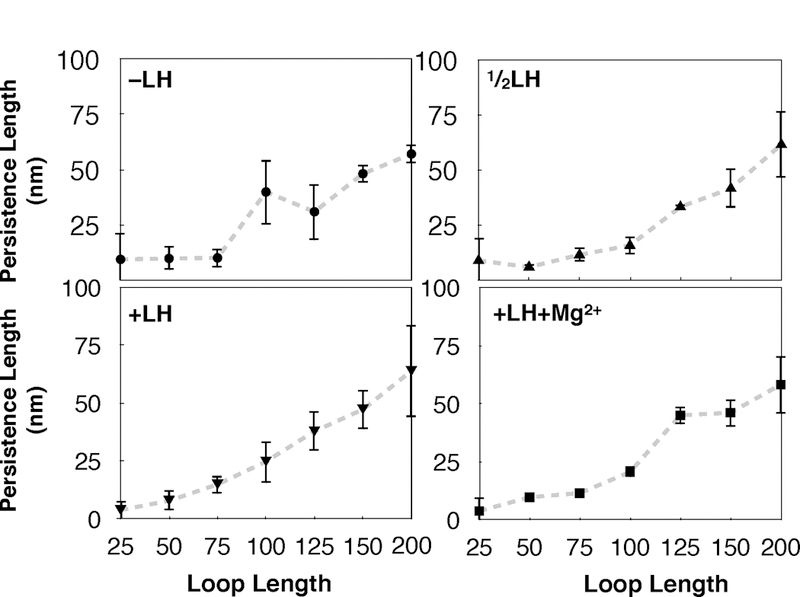
Persistence lengths LP calculated for restrained loops ranging from 25–200 nucleosomes in length. LP is a measurement of bending probability, formally given as the length by which correlations of the vectors which are tangent to the fiber axis are lost. All fibers show increasing persistence length with increasing loop length. Linker histone depleted (−LH) fibers and linker histone and divalent ion saturated fibers (+LH+Mg2+) show a sharp increase in persistence length around 100–150 nucleosome loops, while subsaturated linker histone fibers (LH) and saturated linker histone (+LH) fibers show more gradual increase in LP around the same regions.
Noting that internal restraints on the fiber can affect total persistence length by as much as 25 nm (~1.5Kb), we suggest that care be taken when interpreting polymer models that employ persistence length values that are only relevant for much longer fibers.25 Interestingly, our −LH fibers show increased persistence length and variance at the 100–125 nucleosome mark; see plateaus in the curve (top left and bottom right of Figure 5). This sensitivity to size corresponds to our observation that restrained fibers smaller than 100 nucleosomes cannot form higher-order folds. In +LH+Mg2+ fibers, this plateau is shifted to the right, where 125 nucleosomes fibers show a marked increase in persistence length. It is well known that linker histones stiffen chromatin fibers due to stem formation where Mg2+ mitigates this effect to some degree.24
One additional parameter, namely DNA linker length, has also been shown to affect chromatin fiber structure on the 25 nucleosome level.27 In vivo, variations in NRL are often found in concentrated regions flanking gene encoding regions, called Nucleosome Free Regions. To test the effects of non-uniform NRLs on the folding of restrained chromatin fibers, we built a simulated ‘wide’ Nucleosome Free Region (NFR) as observed recently by Dieuleveult et. al.37 spanning a stretch of genomic sequence ~1Kb in length. This corresponds to the longest linker lengths observed near the center of the NFR (Figure 6 bottom right). Figure 6 (top and bottom left) shows the effects of the simulated NFR on structure and persistence length. We see that the NFR triggers loop opening rather than intertwining, increasing the persistence length in −LH fibers by 20 nm (∼1.3 Kb) and 5 nm in LH and +LH fibers. Much has been reported regarding chromatin fiber sensitivity to locally varying DNA linker length between nucleosomes, but this observation has not previously been extended to chromatin loops and its role in transcription. Such regions have been connected to embryonic stem cell gene activation and repression,69 but the structural mechanisms by which nucleosome depletion is incorporated into transcription have been elusive.
Our work suggests that nucleosome depletion may be necessary for transcription initiation not only due to steric reasons, as previously assumed, but also for structural relaxation of the chromatin fiber loop. Thus, nucleosome depletion could play a role similar to topoisomerases in DNA replication and knotting/unknotting. These observations open a new avenue for research of structural effects of post-translational modifications in combination with nucleosome depletion and protein loading to fully characterize the process of transcription by structural manipulation of higher-order folds by internal and external parameters.
Together, these trends in Figures 5 and 6 suggest a complex interplay between bending flexibility and internal parameters of the chromatin fiber (linker histones, divalent ions, DNA linker length, etc.). Thus it is important to consider the structural roles of local chromatin features such as bound transcriptions factors, nucleosome positions, linker histones, and ion concentrations when characterizing chromatin folding on the 1–100Kb level in order to interpret chromosome conformation capture data.
Gata-4 mesoscale model is sensitive to internal conditions.
Figure 7 shows the internal energy (total potential energy/number of nucleosomes), packing ratio (nucleosomes/11 nm) and persistence length for longer fibers (427 nucleosomes) incorporating the GATA-4 gene locus connectivity data with no linker histones (−LH), no linker histones and magnesium ions (−LH+Mg2+), one linker histone per 2 nucleosomes , one linker histone per 2 nucleosomes and magnesium ions , 1 linker histone per nucleosome (+LH) and 1 linker histone per nucleosome with divalent magnesium ions (+LH+Mg2+). Internal energy is here defined as the sum of all potential energy terms divided by the total number of nucleosomes. Linker histones and divalent ions significantly decrease the internal energy of the structure by as much as 40 Kcal/mol: −LH fibers have the highest internal energy and +LH+Mg2+ fibers have the lowest internal energy. Packing ratios are significantly increased by linker histones and divalent ions by as much as 1 nucleosome per nm, underscoring effect of fiber conditions on fiber architecture. Persistence lengths for all 427 nucleosome fibers also fall into the accepted range but exhibit variations as large as 75 nm (20%) in −LH fibers. Thus, the local curvature of the GATA-4 fibers is sensitive to linker histone presence; linker histones and divalent ions decrease the variance of observed persistence lengths.
Figure 7:
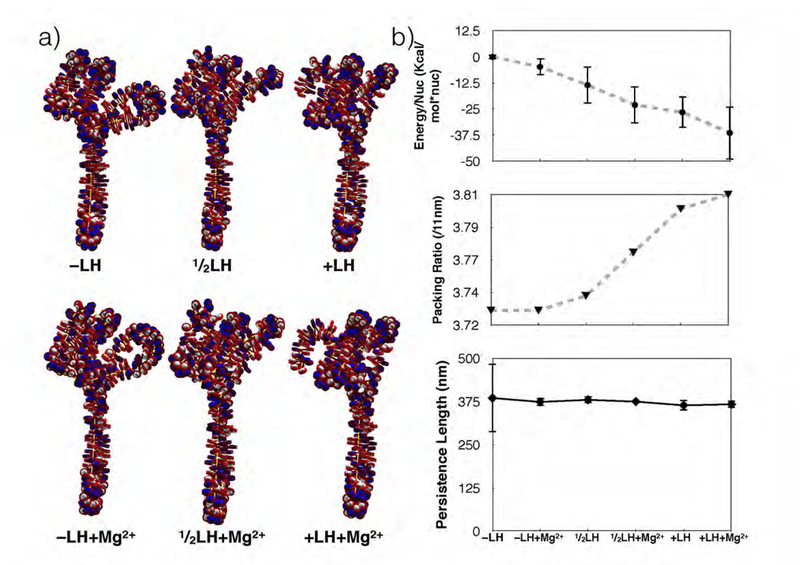
a) Space filling representations of the mesoscale GATA-4 gene locus models both with divalent ions (bottom row), and without divalent ions (top row). DNA is drawn in red and nucleosome cores are drawn in either blue or white. Histone tails are not shown. b) Linker histone and divalent ion (Mg2+) concentration affect global attributes of the gene-locus. Computed persistence lengths, packing ratios, and internal energy are presented in the order of decreasing potential energy (increasing linker histone and magnesium concentration). Energy/nucleosome steadily decreases with linker histone and divalent ion presence, while the compaction ratios increase. Persistence length, which varies by as much as 100 mm in linker histone depleted fibers, shows decreased variance for all other fibers, with an average value of 375nm.
Conclusion
By studying the architecture, persistence lengths, and structural characteristics of chromatin loops, we have demonstrated that chromatin loop structures and persistence lengths are sensitive to internal conditions such as linker histone density, magnesium ion concentration, DNA linker lengths, and loop length/orientation. While these trends may be intuitive, they are often simplified when polymer models are used to fit genome wide chromatin capture data. Chromatin loops of various sizes offer unique structural mechanisms via their folding for biological regulation. They are also natural candidates for design of gene inhibition and activation. By implementing restraints from experimental 3C data, we have shown that hierarchical looping is a viable mechanism for condensing chromatin fibers near gene regulatory elements without tangling the fiber. Thus, our hierarchical looping model10 accommodates experimentally observed contacts while remaining firmly grounded in validated physical chemistry based energy functions.
Our work also supports a growing notion that interphase chromatin is composed of rosette-like multi looped chromatin fibers on the Kb scale.8,10,18,67 When considering that localization of functional gene elements is specific to functional role,23 a picture emerges in which tertiary chromatin folding resembles RNA secondary structures, rather than globular proteins. Commonly, RNA structures form hairpins and junctions with functional regions at the distal parts of hairpin loops, whereas most globule protein enzymes have active regions near the center of the globule. The loop architectures studied here offer new hypotheses for determining the localization of genomic sequences based on gene activity. While active gene elements tend to be near the periphery of the DNA fold, inactive gene regulatory elements may be sequestered inward, away from the globular surface. Thus, hierarchical looping provides a structural mechanism for gene inhibition that can be modulated by changes in chromatin loop length,15 dissolving of polycomb protein contacts,17 or post-translational modifications.70 For example, we demonstrated recently that a single nucleosome removal from 25 nucleosome fibers is capable of inducing sharp kinks in the fiber axis, suggesting the possibility of engineering such elements into larger chromatin structures.27 Such work, coupled with the natural prevalence of hierarchical looping in our models, provides a framework for the possible future manipulation of variations in designed chromatin elements (via linker histone density, Mg2+ concentration, and variable DNA linker lengths), so as to control gene regulation.
Thus our work supports hierarchical looping as the folding mechanism of chromatin loop complexes, and highlights the sensitivity of tertiary chromatin structure to internal parameters (e.g., linker histone concentration,71 DNA linker length,71 divalent ion concentration72), which are tightly regulated by host cells. Such internal and external conditions should thus be considered when interpreting conformation contact data using theoretical models. Uniform polymer models, as typically used to incorporate 3C data, may thus lead to misinterpretations of the genomic data, especially when the resolution of these models is on the order of kilobase pairs. The importance of chromatin architecture in gene regulation also suggests tunable parameters for design.
Supplementary Material
Acknowledgement
This work was supported by the National Institutes of Health grant R01-055164 to T.S, and Phillip-Morris USA and Phillip-Morris International to T.S. KYS was supported by LANL LDRD. We also thank Dr. Sergei Grigoryev for his invaluable comments and discussion regarding this manuscript. Computing was performed on the New York University HPC cluster Mercer and Los Alamos National Lab Institutional Computing resources. We also thank LANL Institutional Computing for computational resources and for valuable direction regarding parallel resources.
Footnotes
Supporting Information Available
Eight supplemental figures and one table are available, namely a cartoon schematic of the GATA-4 connectivity seen in experimental studies, initial starting configurations for chromatin loops, convergence checks graphs for a sample MC run, contact matrices for individual loop structures studied, and parameters used in the mesoscale chromatin potential.
References
- (1).Schlick T; Hayes J; Grigoryev S Toward convergence of experimental studies and theoretical modeling of the chromatin fiber. J. Biol. Chem 2012, 287, 5183–5191. [DOI] [PMC free article] [PubMed] [Google Scholar]
- (2).Kleinjan DA; van Heyningen V Long-range control of gene expression: emerging mechanisms and disruption in disease. Amer. J. Hum. Gen 2005, 76, 8–32. [DOI] [PMC free article] [PubMed] [Google Scholar]
- (3).Ozer G; Luque A; Schlick T The chromatin fiber: multiscale problems and ap-proaches. Curr. Opin. Struc. Biol 2015, 31, 124–139. [DOI] [PMC free article] [PubMed] [Google Scholar]
- (4).Worcel A; Benyajati C Higher order coiling of DNA in chromatin. Cell 1977, 12, 83–100. [DOI] [PubMed] [Google Scholar]
- (5).Bednar J; Horowitz RA; Grigoryev SA; Carruthers LM; Hansen JC; Koster AJ; Woodcock CL Nucleosomes, linker DNA, and linker histone form a unique structural motif that directs the higher-order folding and compaction of chromatin. Proc. Nat. Acad. Sci. USA 1998, 95, 14173–14178. [DOI] [PMC free article] [PubMed] [Google Scholar]
- (6).Tremethick DJ Higher-order structures of chromatin: the elusive 30 nm fiber. Cell 2007, 128, 651–654. [DOI] [PubMed] [Google Scholar]
- (7).Flis H; Korenberg J Chromosome structure and levels of chromosome organization; Elsevier, 2012; Vol. 2; p 267. [Google Scholar]
- (8).Iyer BV; Kenward M; Arya G Hierarchies in eukaryotic genome organization: insights from polymer theory and simulations. BMC Biophys 2011, 4, 8. [DOI] [PMC free article] [PubMed] [Google Scholar]
- (9).Ricci MA; Manzo C; García-Parajo MF; Lakadamyali M; Cosma MP Chromatin fibers are formed by heterogeneous groups of nucleosomes in vivo. Cell 2015, 160, 1145–1158. [DOI] [PubMed] [Google Scholar]
- (10).Grigoryev SA; Bascom G; Buckwalter JM; Schubert MB; Woodcock CL; Schlick T Hierarchical looping of zigzag nucleosome chains in metaphase chromosomes. Proc. Nat. Acad. Sci. USA 2016, 113, 1238–1243. [DOI] [PMC free article] [PubMed] [Google Scholar]
- (11).Miele A; Dekker J The Nucleus ; Springer, 2008; pp 105–121. [Google Scholar]
- (12).Tiwari VK; McGarvey KM; Licchesi JD; Ohm JE; Herman JG; Schübeler D; Baylin SB PcG proteins, DNA methylation, and gene repression by chromatin looping. PLoS Biol 2008, 6, 2911–2927. [DOI] [PMC free article] [PubMed] [Google Scholar]
- (13).Horn PJ; Peterson CL Chromatin higher order folding–wrapping up transcription. Science 2002, 297, 1824–1827. [DOI] [PubMed] [Google Scholar]
- (14).Bischof O; Purbey PK; Notani D; Urlaub H; Dejean A; Galande S Functional interaction between PML and SATB1 regulates chromatin-loop architecture and transcription of the MHC class I locus. Nat. Cell Biol 2007, 9, 45–56. [DOI] [PubMed] [Google Scholar]
- (15).Jing H; Vakoc CR; Ying L; Mandat S; Wang H; Zheng X; Blobel GA Exchange of GATA factors mediates transitions in looped chromatin organization at a developmentally regulated gene locus. Mol. Cell 2008, 29, 232–242. [DOI] [PMC free article] [PubMed] [Google Scholar]
- (16).Liu Z; Garrard WT Long-range interactions between three transcriptional enhancers, active Vκ gene promoters, and a 3′ boundary sequence spanning 46 kilobases. Mol. and Cell Biol 2005, 25, 3220–3231. [DOI] [PMC free article] [PubMed] [Google Scholar]
- (17).Lanzuolo C; Roure V; Dekker J; Bantignies F; Orlando V Polycomb response elements mediate the formation of chromosome higher-order structures in the bithorax complex. Nat. Cell Biol 2007, 9, 1167–1174. [DOI] [PubMed] [Google Scholar]
- (18).Rao SS; Huntley MH; Durand NC; Stamenova EK; Bochkov ID; Robinson JT; Sanborn AL; Machol I; Omer AD; Lander ESA 3D map of the human genome at kilobase resolution reveals principles of chromatin looping. Cell 2014, 159, 1665–1680. [DOI] [PMC free article] [PubMed] [Google Scholar]
- (19).Kurukuti S; Tiwari VK; Tavoosidana G; Pugacheva E; Murrell A; Zhao Z; Lobanenkov V; Reik W; Ohlsson R CTCF binding at the H19 imprinting control region mediates maternally inherited higher-order chromatin conformation to restrict enhancer access to Igf2. Proc. Nat. Acad. Sci. USA 2006, 103, 10684–10689. [DOI] [PMC free article] [PubMed] [Google Scholar]
- (20).Sexton T; Bantignies F; Cavalli G Genomic interactions: chromatin loops and gene meeting points in transcriptional regulation. Sem. in Cell & Dev. Bio 2009, 20, 849–855. [DOI] [PubMed] [Google Scholar]
- (21).Le May N; Fradin D; Iltis I; Bougnères P; Egly J-M XPG and XPF endonucleases trigger chromatin looping and DNA demethylation for accurate expression of activated genes. Mol. Cell 2012, 47, 622–632. [DOI] [PubMed] [Google Scholar]
- (22).Cai S; Lee CC; Kohwi-Shigematsu T SATB1 packages densely looped, transcrip-tionally active chromatin for coordinated expression of cytokine genes. Nat. Gen 2006, 38, 1278–1288. [DOI] [PubMed] [Google Scholar]
- (23).Boettiger AN; Bintu B; Moffitt JR; Wang S; Beliveau BJ; Fudenberg G; Imakaev M; Mirny LA; Wu C.-t.; Zhuang X Super-resolution imaging reveals distinct chromatin folding for different epigenetic states. Nature 2016, 529, 418–422. [DOI] [PMC free article] [PubMed] [Google Scholar]
- (24).Grigoryev SA; Arya G; Correll S; Woodcock CL; Schlick T Evidence for heteromorphic chromatin fibers from analysis of nucleosome interactions. Proc. Nat. Acad. Sci. USA 2009, 106, 13317–13322. [DOI] [PMC free article] [PubMed] [Google Scholar]
- (25).Sanborn AL; Rao SS; Huang S-C; Durand NC; Huntley MH; Jewett AI; Bochkov ID; Chinnappan D; Cutkosky A; Li J Chromatin extrusion explains key features of loop and domain formation in wild-type and engineered genomes. Proc. Nat. Acad. Sci. USA 2015, 112, E6456–E6465. [DOI] [PMC free article] [PubMed] [Google Scholar]
- (26).Schlick T; Perišić O Mesoscale simulations of two nucleosome-repeat length oligonucleosomes. Phys. Chem. Chem. Phys 2009, 11, 10729–10737. [DOI] [PMC free article] [PubMed] [Google Scholar]
- (27).Collepardo-Guevara R; Schlick T Chromatin fiber polymorphism triggered by variations of DNA linker lengths. Proc. Nat. Acad. Sci. USA 2014, 111, 8061–8066. [DOI] [PMC free article] [PubMed] [Google Scholar]
- (28).Collepardo-Guevara R; Portella G; Vendruscolo M; Frenkel D; Schlick T; Orozco M Chromatin unfolding by epigenetic modifications explained by dramatic impairment of internucleosome interactions: a multiscale computational study. J. Amer. Chem. Soc 2015, 137, 10205–10215. [DOI] [PMC free article] [PubMed] [Google Scholar]
- (29).Arya G; Schlick T Role of histone tails in chromatin folding revealed by a mesoscopic oligonucleosome model. Proc. Nat. Acad. Sci. USA 2006, 103, 16236–16241. [DOI] [PMC free article] [PubMed] [Google Scholar]
- (30).Luque A; Collepardo-Guevara R; Grigoryev S; Schlick T Dynamic condensation of linker histone C-terminal domain regulates chromatin structure. Nucl. Acids Res 2014, 42, 7553–7560. [DOI] [PMC free article] [PubMed] [Google Scholar]
- (31).Arya G; Schlick T A tale of tails: how histone tails mediate chromatin compaction in different salt and linker histone environments. J. Phys. Chem. A 2009, 113, 4045–4059. [DOI] [PMC free article] [PubMed] [Google Scholar]
- (32).Mirny LA The fractal globule as a model of chromatin architecture in the cell. Chrom. Res 2011, 19, 37–51. [DOI] [PMC free article] [PubMed] [Google Scholar]
- (33).Emanuel M; Radja NH; Henriksson A; Schiessel H The physics behind the larger scale organization of DNA in eukaryotes. Phys. Biol 2009, 6, 025008. [DOI] [PubMed] [Google Scholar]
- (34).Bolzer A; Kreth G; Solovei I; Koehler D; Saracoglu K; Fauth C; Müller S; Eils R; Cremer C; Speicher MR Three-dimensional maps of all chromosomes in human male fibroblast nuclei and prometaphase rosettes. PLoS Biol 2005, 3, e157. [DOI] [PMC free article] [PubMed] [Google Scholar]
- (35).Bohn M; Heermann DW Diffusion-driven looping provides a consistent framework for chromatin organization. PloS One 2010, 5, e12218. [DOI] [PMC free article] [PubMed] [Google Scholar]
- (36).Gkikopoulos T; Schofield P; Singh V; Pinskaya M; Mellor J; Smolle M; Workman JL; Barton GJ; Owen-Hughes T A role for Snf2-related nucleosome-spacing enzymes in genome-wide nucleosome organization. Science 2011, 333, 1758–1760. [DOI] [PMC free article] [PubMed] [Google Scholar]
- (37).de Dieuleveult M; Yen K; Hmitou I; Depaux A; Boussouar F; Dargham DB; Jounier S; Humbertclaude H; Ribierre F; Baulard C Genome-wide nucleosome specificity and function of chromatin remodellers in ES cells. Nature 2016, 530, 113–116. [DOI] [PMC free article] [PubMed] [Google Scholar]
- (38).Bannister AJ; Zegerman P; Partridge JF; Miska EA; Thomas JO; Allshire RC; Kouzarides T Selective recognition of methylated lysine 9 on histone H3 by the HP1 chromo domain. Nature 2001, 410, 120–124. [DOI] [PubMed] [Google Scholar]
- (39).Whyte WA; Orlando DA; Hnisz D; Abraham BJ; Lin CY; Kagey MH; Rahl PB; Lee TI; Young RA Master transcription factors and mediator establish super-enhancers at key cell identity genes. Cell 2013, 153, 307–319. [DOI] [PMC free article] [PubMed] [Google Scholar]
- (40).Arya G; Zhang Q; Schlick T Flexible histone tails in a new mesoscopic oligonucleosome model. Biophys. J 2006, 91, 133–150. [DOI] [PMC free article] [PubMed] [Google Scholar]
- (41).Luque A; Ozer G; Schlick T A sensitive interplay between nucleosome repeat length, linker histone concentration, and histone tail interactions. Biophys. J 2016, In Press, doi:10.1016/j.bpj.2016.04.024. [DOI] [PMC free article] [PubMed]
- (42).Yuan G-C; Liu Y-J; Dion MF; Slack MD; Wu LF; Altschuler SJ; Rando OJ Genome-scale identification of nucleosome positions in S. cerevisiae. Science 2005, 309, 626–630. [DOI] [PubMed] [Google Scholar]
- (43).Lee C-K; Shibata Y; Rao B; Strahl BD; Lieb JD Evidence for nucleosome depletion at active regulatory regions genome-wide. Nat. Gen 2004, 36, 900–905. [DOI] [PubMed] [Google Scholar]
- (44).Bansal M; Kumar A; Yella VR Role of DNA sequence based structural features of promoters in transcription initiation and gene expression. Current opinion in structural biology 2014, 25, 77–85. [DOI] [PubMed] [Google Scholar]
- (45).Arya G; Maitra A; Grigoryev SA A structural perspective on the where, how, why, and what of nucleosome positioning. Journal of Biomolecular Structure and Dynamics 2010, 27, 803–820. [DOI] [PubMed] [Google Scholar]
- (46).Akiyama Y; Watkins N; Suzuki H; Jair K-W; van Engeland M; Esteller M; Sakai H; Ren C-Y; Yuasa Y; Herman JG GATA-4 and GATA-5 transcription factor genes and potential downstream antitumor target genes are epigenetically silenced in colorectal and gastric cancer. Mol. and Cell. Bio 2003, 23, 8429–8439. [DOI] [PMC free article] [PubMed] [Google Scholar]
- (47).Xu J; Sankaran VG; Ni M; Menne TF; Puram RV; Kim W; Orkin SH Transcriptional silencing of γ-globin by BCL11A involves long-range interactions and cooperation with SOX6. Genes & Dev 2010, 24, 783–798. [DOI] [PMC free article] [PubMed] [Google Scholar]
- (48).Louwers M; Bader R; Haring M; van Driel R; de Laat W; Stam M Tissue-and expression level–specific chromatin looping at maize b1 epialleles. Plant Cell 2009, 21, 832–842. [DOI] [PMC free article] [PubMed] [Google Scholar]
- (49).Hadjur S; Williams LM; Ryan NK; Cobb BS; Sexton T; Fraser P; Fisher AG; Merkenschlager M Cohesins form chromosomal cis-interactions at the developmentally regulated IFNG locus. Nature 2009, 460, 410–413. [DOI] [PMC free article] [PubMed] [Google Scholar]
- (50).Tolhuis B; Palstra R-J; Splinter E; Grosveld F; de Laat W Looping and interaction between hypersensitive sites in the active β-globin locus. Mol. Cell 2002, 10, 1453–1465. [DOI] [PubMed] [Google Scholar]
- (51).Drissen R; Palstra R-J; Gillemans N; Splinter E; Grosveld F; Philipsen S; de Laat W The active spatial organization of the β-globin locus requires the transcription factor EKLF. Gen. & Dev 2004, 18, 2485–2490. [DOI] [PMC free article] [PubMed] [Google Scholar]
- (52).Baù D; Sanyal A; Lajoie BR; Capriotti E; Byron M; Lawrence JB; Dekker J; Marti-Renom MA The three-dimensional folding of the α-globin gene domain reveals formation of chromatin globules. Nat. Struc. & Mol. Biol 2011, 18, 107–114. [DOI] [PMC free article] [PubMed] [Google Scholar]
- (53).Perišić O; Collepardo-Guevara R; Schlick T Modeling studies of chromatin fiber structure as a function of DNA linker length. J. Mol. Biol 2010, 403, 777–802. [DOI] [PMC free article] [PubMed] [Google Scholar]
- (54).Beard DA; Schlick T Modeling salt-mediated electrostatics of macromolecules: The discrete surface charge optimization algorithm and its application to the nucleosome. Biopolymers 2001, 58, 106–115. [DOI] [PubMed] [Google Scholar]
- (55).Stigter D Interactions of highly charged colloidal cylinders with applications to double-stranded DNA. Biopolymers 1977, 16, 1435–1448. [DOI] [PubMed] [Google Scholar]
- (56).Yamakawa H Helical wormlike chains in polymer solutions; Springer Science & Business Media, 2012. [Google Scholar]
- (57).Drew HR; Travers AA DNA bending and its relation to nucleosome positioning. J. Mol. Biol 1985, 186, 773–790. [DOI] [PubMed] [Google Scholar]
- (58).Zhou B-R; Jiang J; Feng H; Ghirlando R; Xiao TS; Bai Y Structural mechanisms of nucleosome recognition by linker histones. Mol. Cell 2015, 59, 628–638. [DOI] [PMC free article] [PubMed] [Google Scholar]
- (59).Davey CA; Sargent DF; Luger K; Maeder AW; Richmond TJ Solvent mediated interactions in the structure of the nucleosome core particle at 1.9 Å resolution. J Mol. Biol 2002, 319, 1097–1113. [DOI] [PubMed] [Google Scholar]
- (60).Lu Y; Weers B; Stellwagen NC DNA persistence length revisited. Biopolymers 2002, 61, 261–275. [DOI] [PubMed] [Google Scholar]
- (61).Francis NJ; Kingston RE; Woodcock CL Chromatin compaction by a polycomb group protein complex. Science 2004, 306, 1574–1577 [DOI] [PubMed] [Google Scholar]
- (62).Arya G; Schlick T Efficient global biopolymer sampling with end-transfer configurational bias Monte Carlo. J. Chem. Phys 2007, 126, 044107. [DOI] [PubMed] [Google Scholar]
- (63).Rosenbluth MN; Rosenbluth AW Monte Carlo calculation of the average extension of molecular chains. J. Chem. Phys 1955, 23, 356–359. [Google Scholar]
- (64).Metropolis N; Ulam S The Monte Carlo method. J. Amer. Stat. Assoc 1949, 44, 335–341. [DOI] [PubMed] [Google Scholar]
- (65).Zlatanova J; Caiafa P; Van Holde K Linker histone binding and displacement: versatile mechanism for transcriptional regulation. FASEB J 2000, 14, 1697–1704. [DOI] [PubMed] [Google Scholar]
- (66).Lu X; Hansen JC Identification of specific functional subdomains within the linker histone H10 C-terminal domain. J. Biol. Chem 2004, 279, 8701–8707. [DOI] [PubMed] [Google Scholar]
- (67).Tark-Dame M; van Driel R; Heermann DW Chromatin folding–from biology to polymer models and back. J. Cell Sci 2011, 124, 839–845. [DOI] [PubMed] [Google Scholar]
- (68).Wedemann G; Langowski J Computer simulation of the 30-nanometer chromatin fiber. Biophys. J 2002, 82, 2847–2859. [DOI] [PMC free article] [PubMed] [Google Scholar]
- (69).Venkatesh S; Workman JL Histone exchange, chromatin structure and the regulation of transcription. Nat. Rev. Mol. Cell Biol 2015, 16, 178–189. [DOI] [PubMed] [Google Scholar]
- (70).Kouzarides T Chromatin modifications and their function. Cell 2007, 128, 693–705. [DOI] [PubMed] [Google Scholar]
- (71).Routh A; Sandin S; Rhodes D Nucleosome repeat length and linker histone stoichiometry determine chromatin fiber structure. Proc. Nat. Acad. Sci. USA 2008, 105, 8872–8877. [DOI] [PMC free article] [PubMed] [Google Scholar]
- (72).Romani A Regulation of magnesium homeostasis and transport in mammalian cells. Archives of biochemistry and biophysics 2007, 458, 90–102. [DOI] [PubMed] [Google Scholar]
- (73).Ioshikhes IP; Albert I; Zanton SJ; Pugh BF Nucleosome positions predicted through comparative genomics. Nature Gen 2006, 38, 1210–1215. [DOI] [PubMed] [Google Scholar]
Associated Data
This section collects any data citations, data availability statements, or supplementary materials included in this article.