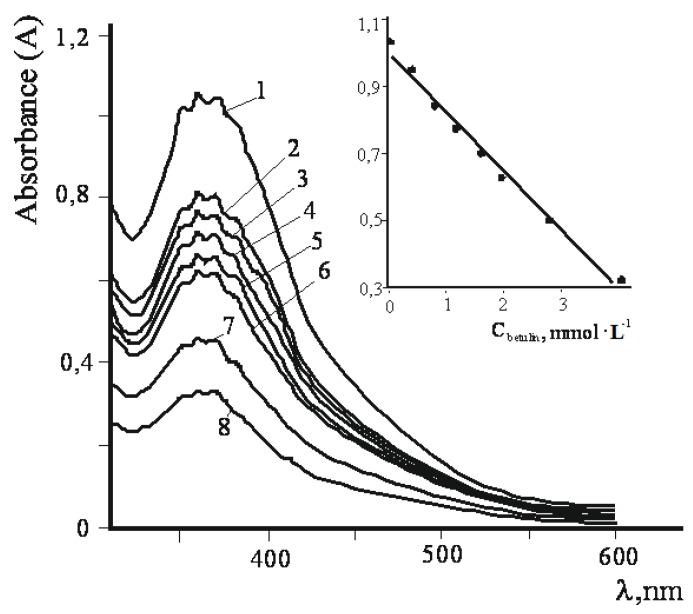
Figure 6.
UV-visible spectra of reaction mixtures; CK2Cr2O7 = const = 6.05 mmol·L−1; CAl2(SO4)3 = const = 0.27 mmol·L−1. Initial concentration of betulin corresponds to N curves (mmol·L−1) 1–0; 2–0.40; 3–0.80; 4–1.21; 5–1.61; 6–2.01; 7–2.82; 8–4.03. The inset figure is magnification for the absorbance A: A = f (cbetulin).

