Figure 7.
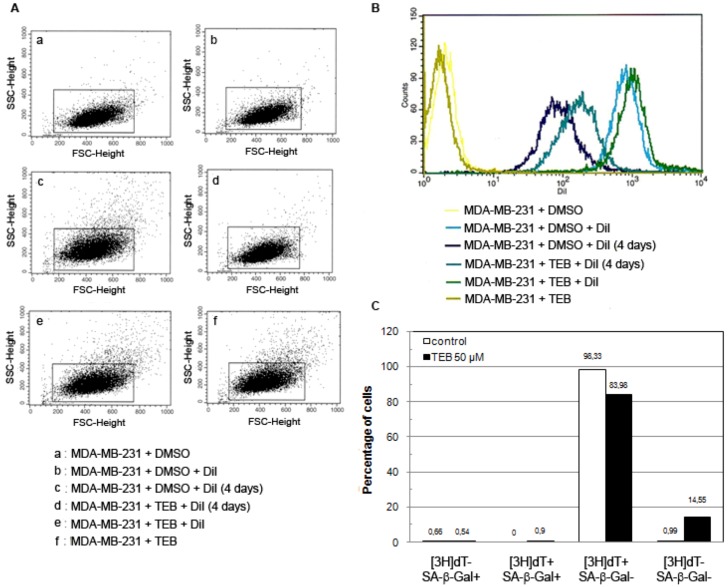
DiI FACS analysis of MDA-MB-231 cell growth with or without 50 µM tebrophen (TEB). (A) Gating strategy and sorted cells analysis. Bounded regions were drawn around cells according to their morphological properties on a FSC/SCC dot plot. Live cells were gated while dead cells and cell debris were excluded from further analysis and sorting. (B) DiI fluorescence intensity of positive control cells stained on the day of the experiment (light blue and green) and unstained negative control cells (yellow and olive). Control cell (dark blue) and cell treated with 50 μM tebrophen (turquoise) propagation after 4 days in culture. (C) Tritiated thymidine labeling index and SA-β-Gal activity in MDA-MB-231 control cells (red) and cells treated with 50 μM Tebrophen (blue). Four different phenotypes are described: [3H]dT+/SA-b-Gal−; [3H]dT−/SA-b-Gal+; [3H]dT+/SA-b-Gal+; [3H]dT−/SA-β-Gal−. At least 1,000 cells per sample were counted for statistical analysis.

