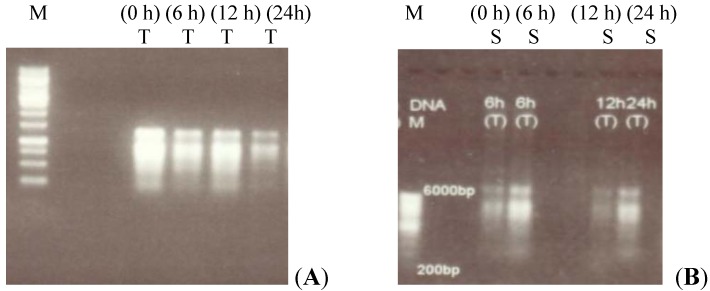
Figure 1.
Representative total RNA extracted from root tissues of two canola lines differing in salt tolerance. (A) Total RNA isolated from root tissues of canola tolerant (T) line, harvested at 0, 6, 12 and 24 h after the induction of salt stress (control to salt treated plants). (B) Total RNA isolated from sensitive (S) canola line root tissues harvested at different time intervals. M is the 1 kb DNA ladder.

