Abstract
Purpose
Dietary patterns, indicators of overall diet quality, are associated with colorectal cancer (CRC) incidence but less consistently with mortality among CRC survivors. We prospectively evaluated associations of diet quality pre- and postdiagnosis with risk of mortality among men and women with CRC.
Patients and Methods
In the Cancer Prevention Study-II Nutrition Cohort, 2,801 participants were cancer free at baseline in 1992/1993 and subsequently diagnosed with invasive, nonmetastatic CRC during follow-up through June 2013. Pre- and postdiagnosis diet data were available for 2,671 and 1,321 participants, respectively, among whom 1,414 and 722 died. Concordance with the Dietary Approaches to Stop Hypertension (DASH), American Cancer Society nutrition guidelines (ACS-score), prudent, and Western dietary patterns was used to evaluate diet quality.
Results
Extreme scoring group comparisons showed that prediagnosis ACS-score was inversely associated with all-cause (hazard ratio high v low [HRHighvLow], 0.78; 95% CI, 0.65 to 0.95) and CRC-specific (HRHighvLow, 0.74; 95% CI, 0.54 to 1.03) mortality, whereas the Western diet score was associated with higher all-cause mortality (HRHighvLow, 1.30; 95% CI, 1.03 to 1.64). For postdiagnosis diet, the ACS-score was associated with lower risk of all-cause (HRHighvLow, 0.62; 95% CI, 0.47 to 0.83) and CRC-specific (HRHighvLow, 0.35; 95% CI, 0.17 to 0.73) mortality, the DASH score was inversely associated with all-cause (HRHighvLow, 0.79; 95% CI, 0.62 to 0.99) and CRC-specific (HRHighvLow, 0.56; 95% CI, 0.35 to 0.89) mortality, and the prudent score was inversely associated with all-cause mortality (HRHighvLow, 0.72; 95% CI, 0.56 to 0.93). Among participants with a low diet quality before diagnosis, improved DASH (HR, 0.54; 95% CI, 0.31 to 0.92) and prudent (HR, 0.53; 95% CI, 0.29 to 0.95) scores from pre- to postdiagnosis were inversely associated with CRC-specific mortality.
Conclusion
Dietary patterns reflective of high intakes of plant foods and low intakes of animal products before and after CRC diagnosis are associated with longer survival.
INTRODUCTION
There are more than 1.4 million colorectal cancer (CRC) survivors in the United States who need information on modifiable behaviors that may improve their CRC prognosis.1 Epidemiologic studies suggest a strong influence of diet quality in CRC etiology.2,3 Evidence also suggests that some pre- and postdiagnosis dietary components are related to survival in men and women with CRC.4-6 Studies of dietary patterns to assess overall diet quality in relation to overall and CRC-specific mortality are inconsistent.7-12 Methodological inconsistencies in the timing of exposure assessment relative to diagnosis, exposure, and outcome definitions and small sample sizes have limited the comparability of these results, which makes the development of evidence-based recommendations for CRC survivors difficult.
To date, no individual study has assessed associations of both prediagnosis and postdiagnosis diet quality or a change in diet quality with risk of mortality among CRC survivors. By using data from the large, prospective Cancer Prevention Study-II (CPS-II) Nutrition Cohort of men and women, we examined the associations of two hypothesis-driven dietary pattern scores and two data-driven dietary patterns assessed before and after a CRC diagnosis with risk of overall, CRC-specific, and cardiovascular disease (CVD)–specific mortality.
PATIENTS AND METHODS
Study Population
Study participants were identified from among the 184,185 men and women in the CPS-II Nutrition Cohort, a prospective study of cancer incidence and mortality initiated in 1992/1993.13 Participants completed a 10-page self-administered questionnaire at enrollment to ascertain information on risk factors. Follow-up questionnaires were sent biennially starting in 1997 to update information. The institutional review board at Emory University approved the CPS-II Nutrition Cohort study.
We identified 4,439 participants with no history of CRC at baseline who were diagnosed with invasive cancer of the colon or rectum by the end of incidence follow-up on June 30, 2013. Exclusions were made for the following reasons: diagnosis identified through the National Death Index (NDI) that could not be verified with cancer registries (n = 346)14, prior diagnosis of cancer other than nonmelanoma skin cancer at baseline (n = 429), implausible diagnosis date (n = 14), missing or unknown stage (n = 153), distant metastatic stage at diagnosis (n = 474), nonadenocarcinoma (n = 56), and death date same as diagnosis date (n = 2). An additional 294 participants were excluded because of poor reporting of diet (fewer than 550 or more than 3,500 kcal/d for women, fewer than 650 or more than 4,000 kcal/d for men, or 10 or more line items left blank), which brought the final sample size for the prediagnosis analytic cohort to 2,671.
Among the 2,671 men and women included in the prediagnosis sample, 1,191 completed a valid food frequency questionnaire (FFQ) after their diagnosis. An additional 130 participants completed a postdiagnosis FFQ but not a prediagnosis FFQ; thus, they were included in the postdiagnosis analysis only, which brought the final sample size for the postdiagnosis analysis to 1,321.
Assessment of Dietary Intakes
Average dietary intakes over the previous year were self-reported on validated FFQs administered in 1992 or 1993 (baseline), 1999, and 2003. The 1992/1993 baseline diet data from the modified Block FFQ were used to calculate prediagnosis dietary patterns.15,16 Postdiagnosis dietary patterns were calculated from modified Willett FFQs in 1999 or 2003, whichever came first after the patient’s CRC diagnosis.17,18
Dietary Quality
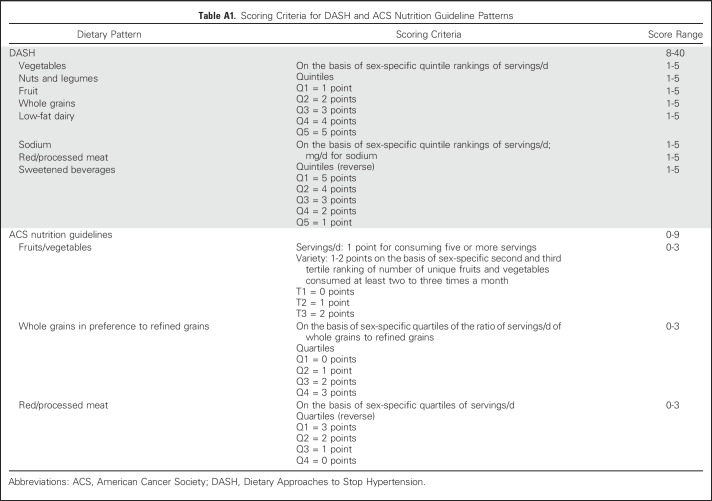
Both hypothesis- and data-driven dietary patterns were used to assess diet quality. Hypothesis-driven dietary patterns were based on nutritional recommendations and/or knowledge of diet-disease associations. The Dietary Approaches to Stop Hypertension (DASH) diet was originally developed in randomized trials to reduce blood pressure but also has been used in other contexts.19 The DASH score is based on high sex-specific quintile rankings of intakes for fruits, vegetables, whole grains, low-fat dairy products, and legumes/seeds and low rankings for saturated fat, sodium, and added sugars. The American Cancer Society Guidelines on Nutrition and Physical Activity for Cancer Prevention20 have been previously adapted to create a dietary pattern score (ACS-score).21,22 The ACS-score is based on consumption of at least five servings per day of fruits and vegetables, a high variety of fruits and vegetables, whole grains more so than refined grains, and limited red/processed meat. Scoring criteria for the DASH and ACS-scores are listed in Appendix Table A1 (online only).
We identified prudent and Western dietary patterns in CPS-II at both the pre- and postdiagnosis time points using a data-driven approach. Principal component analysis identifies food groups that explain the most variation in intakes. Factor loadings represent the correlation between a food group with the overall pattern and are used as the food group’s scoring weight in calculating a dietary pattern score. In the CPS-II Nutrition Cohort, principal component analysis–derived patterns were determined with 37 food groups and an orthogonal rotation to derive uncorrelated patterns that have a clearer interpretation. The prudent pattern is characterized by high intakes of fruits and vegetables, whole grains, legumes, and fish. The Western pattern is characterized by high intakes of refined grains, red and processed meats, eggs, solid fats, and salty snacks. Detailed information on the factor loadings for each dietary pattern are listed in Appendix Table A2 (online only).
Study Outcomes
Vital status, cause of death, and date of death were determined through linkage to the NDI through December 31, 2014. Cause of death was obtained for 99.3% of all known deaths in the CPS-II Nutrition Cohort. The primary outcomes were all-cause and CRC-specific mortality (International Classification of Diseases, 10th Revision, codes C18 to C20). Secondary outcomes were death as a result of CVD (International Classification of Diseases, 10th Revision, codes I00 to I99) and all other remaining causes combined. The cause-specific outcomes were mutually exclusive and defined by the singular underlying cause of death reported in the NDI.
Statistical Analysis
Cox proportional hazards regression models were used to calculate hazard ratios (HRs) and 95% CIs. Quartiles were calculated for DASH, prudent, and Western dietary patterns. The ACS-score was grouped for values of 0 to 2, 3 to 4, 5 to 6, and 7 to 9. The first quartile or lowest scoring group was the referent for all analyses. For continuous models, a 1-standard deviation (SD) increase in each diet score was calculated to allow for comparability between the scores. The median score of each category was assigned to all participants within that category and entered as a continuous exposure in Cox models to test for linear trends. For prediagnosis diet quality, person-time was calculated from the date of CRC diagnosis to the first instance of death, censoring, or end of study. Person-time in the postdiagnosis diet quality analysis was calculated from the date of postdiagnosis FFQ completion to the first instance of death, censoring, or end of study. Delayed-entry Cox models were used in the postdiagnosis models to account for the time between cancer diagnosis and postdiagnosis FFQ completion. Multivariable models included age at diagnosis, year of diagnosis, sex, tumor stage, total caloric intake, body mass index (BMI), education, smoking status, and cancer treatment. Physical activity, alcohol consumption, ethnicity, nonsteroidal anti-inflammatory drug use, postmenopausal hormone use (women only), multivitamin use, family history of CRC, and comorbidities (diabetes, stroke, myocardial infarction, or hypertension) also were evaluated as potential confounders, but these made minimal differences to the results and were not included in the final models. In postdiagnosis models, total caloric intake and BMI were from the same questionnaire as the postdiagnosis FFQ. Postdiagnosis models included a variable for weight change (from pre- to postdiagnosis) as a proxy for illness-related weight loss. Likelihood ratio tests assessed time-dependent effects. Subgroup analyses for prediagnosis diet were performed across strata of age at diagnosis (younger than 70 years, 70 years or older), sex (female, male), cancer site (colon, rectum), stage (localized, regional), baseline BMI (less than 25.0 kg/m2, greater than or equal to 25 kg/m2), and physical activity (fewer than 10 metabolic equivalents of task hours/week, greater than or equal to 10 metabolic equivalents of task hours/week); power was inadequate for postdiagnosis stratified analyses.
Change in diet quality from pre- to post-CRC diagnosis was examined among the 1,191 men and women with both pre- and postdiagnosis dietary data, using low and high scores defined at the median cut point for each score. Men and women below the median at both time points (low/low) served as the referent.
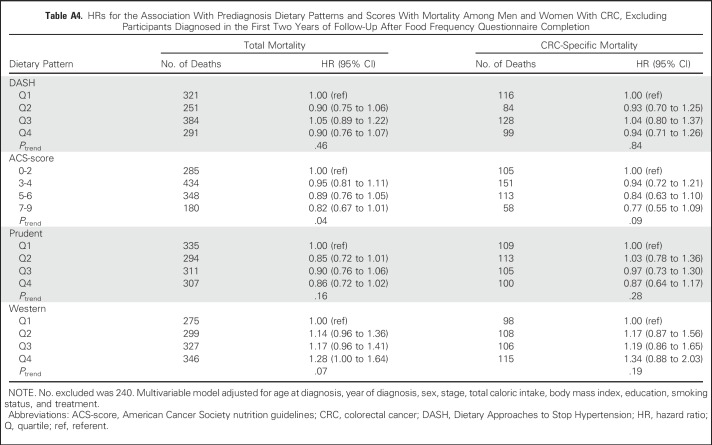
Sensitivity analyses evaluated the robustness of our findings to potential biases. The potential for reverse causation in prediagnosis models was determined by excluding participants diagnosed within 2 years of completing the baseline FFQ and separately by excluding those who self-reported a history of diabetes, hypertension, myocardial infarction, or stroke. Prediagnosis models also were examined only among men and women diagnosed with distant metastatic CRC. In the postdiagnosis models, participants who completed their FFQ within 12 months of CRC diagnosis were excluded to account for the potential influence of adverse treatment effects on diet, and in another model, the first 2 years of follow-up after completion of the postdiagnosis FFQ were excluded. Finally, prediagnosis diet may confound the relationship between postdiagnosis diet and mortality and therefore was included as a covariable in a sensitivity analysis. All statistical analyses were conducted using SAS 9.3 software (SAS Institute, Cary, NC).
RESULTS
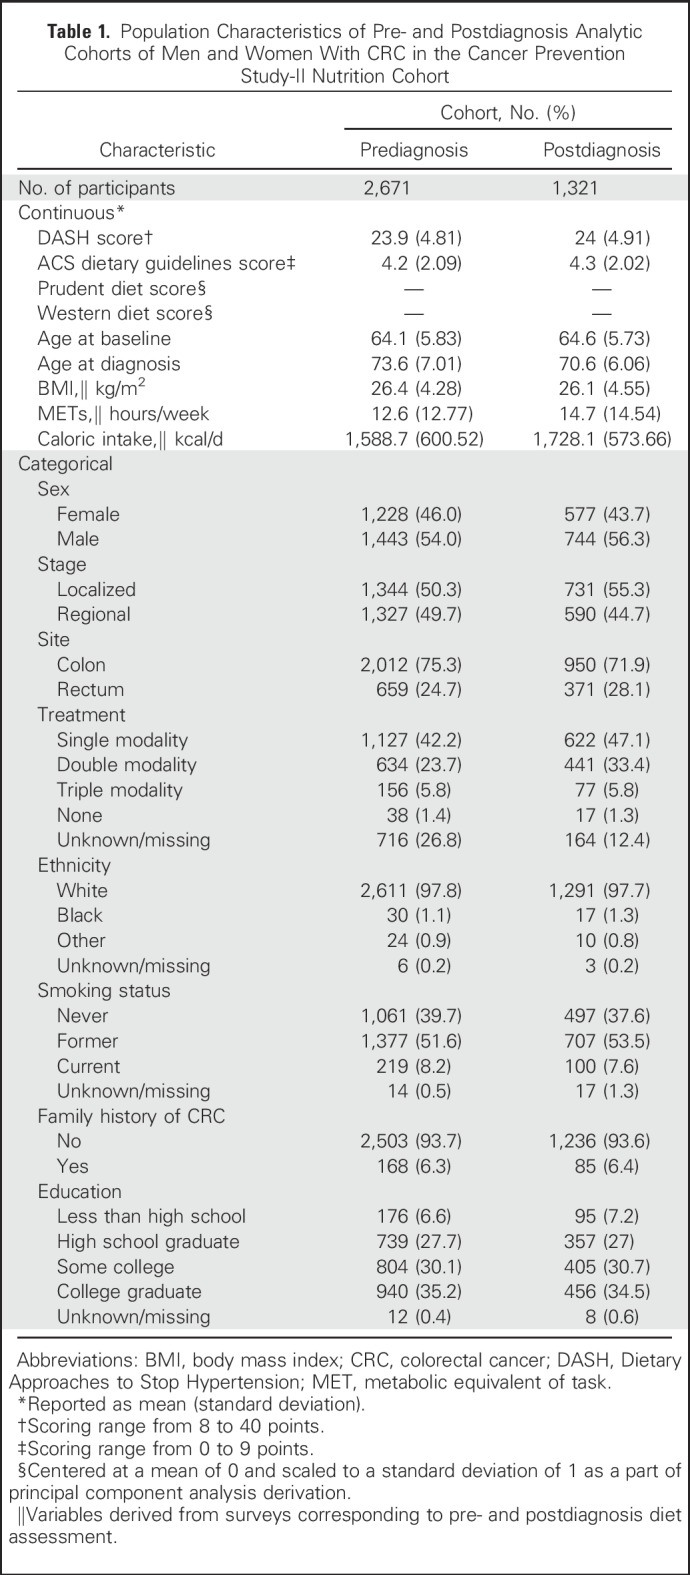
Mean ages at baseline and CRC diagnosis were 64 years (SD, 5.8 years) and 73 years (SD, 7.0 years), respectively. Baseline characteristics of pre- and postdiagnosis analytic cohorts are listed in Table 1. Among the entire cohort (n = 2,801), 75.3% of tumors occurred in the colon, and slightly more were localized (n = 1,407) than regional (n = 1,394). Dietary patterns were moderately correlated at both time points (Appendix Table A3, online only). In the prediagnosis cohort, 1,414 deaths occurred, with 494 attributable to CRC and 321 to CVD. The average time from completion of the baseline FFQ to CRC diagnosis was 9.0 years (minimum, 27 days; maximum, 20.7 years). The mean follow-up time from diagnosis to end of follow-up was 6.5 years (minimum, 2 days; maximum, 21.0 years) among participants who died and 11.4 years (minimum, 1.5 years; maximum, 22.1 years) among those who were alive at the end of follow-up in the prediagnosis analytic cohort.
Table 1.
Population Characteristics of Pre- and Postdiagnosis Analytic Cohorts of Men and Women With CRC in the Cancer Prevention Study-II Nutrition Cohort
In the postdiagnosis analytic cohort, 722 total deaths occurred, with 177 attributable to CRC and 195 to CVD. The mean time from diagnosis to completion of the FFQ was 2.6 years (median, 2.3 years; minimum, 2 days; maximum, 9.9 years). Mean follow-up time after completion of FFQ was 6.4 years (minimum, 19 days; maximum, 15.2 years) among participants who died and 13.5 years (minimum, 10.9 years; maximum 15.3 years) among those who were alive at the end of follow-up.
Prediagnosis Diet Quality
The highest compared with the lowest ACS-score category was associated with a 22% lower risk of all-cause mortality (95% CI, 5% to 35%; Table 2). Significant inverse trends were observed for the ACS-score in relation to all-cause (Ptrend = .008) and CRC-specific (Ptrend = .03) mortality. For the highest quartile of prediagnosis Western dietary pattern, there was a 30% (95% CI, 3% to 64%) higher risk of death compared with the lowest quartile. No discernable differences were observed for the associations between diet quality and all-cause mortality across strata of age at diagnosis, sex, cancer site, stage, BMI, or physical activity (data not shown).
Table 2.
HRs for the Association With Prediagnosis Dietary Patterns and Scores With Mortality Among Men and Women With CRC
Postdiagnosis Diet Quality
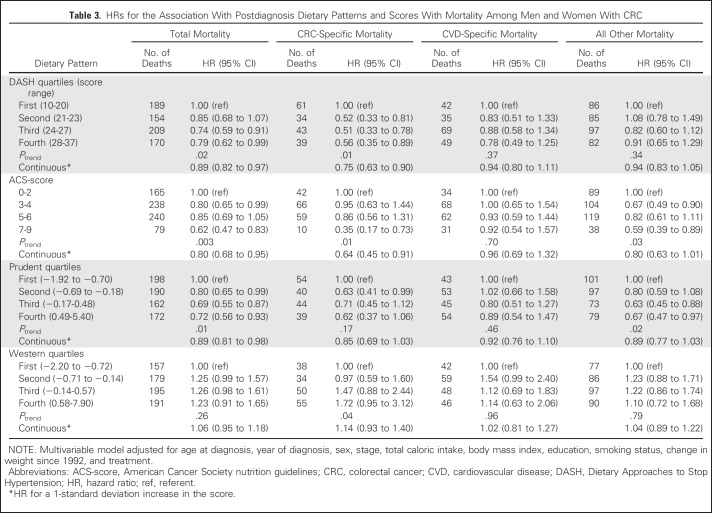
Higher postdiagnosis scores for DASH, ACS-score, and prudent dietary patterns were significantly associated with lower all-cause mortality (Table 3). Participants with the highest versus lowest scores were at 21%, 38%, and 28% lower risk of all-cause mortality for DASH (95% CI, 1% to 38%), ACS-score (95% CI, 17% to 53%), and prudent (95% CI, 7% to 44%) dietary patterns, respectively. Inverse associations of DASH (Ptrend = .01) and ACS-score (Ptrend = .01) with risk of CRC-specific mortality were observed, whereas a significant trend was found with increasing Western diet quartiles (Ptrend = .04). The highest compared with the lowest ACS-score showed a 65% lower risk of CRC mortality (95% CI, 27% to 83%) and 41% lower risk of mortality as a result of all other remaining causes combined (95% CI, 11% to 61%). No association between the prudent diet and CRC-specific mortality was observed, but there was a significant inverse trend with all other remaining causes of death (Ptrend = .02).
Table 3.
HRs for the Association With Postdiagnosis Dietary Patterns and Scores With Mortality Among Men and Women With CRC
Change in Diet Quality From Pre- to Postdiagnosis
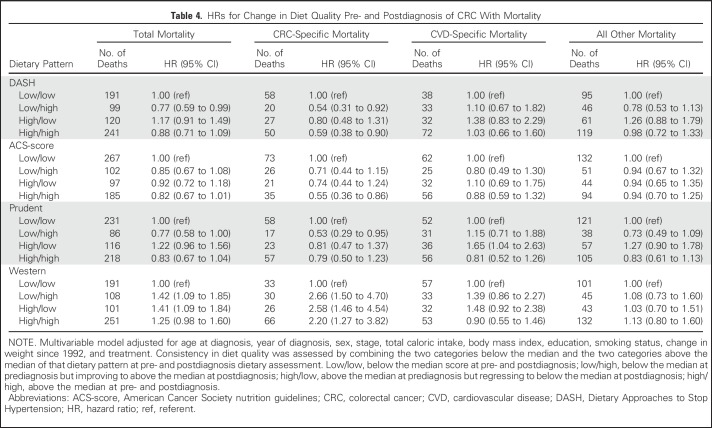
Although the results were not all statistically significant for the DASH, ACS-score, and prudent dietary patterns, HRs were consistently less than 1 for the low/high group and high/high group compared with the low/low group in relation to total and CRC-specific mortality (Table 4). Conversely, participants with high Western diet scores either before or after diagnosis were at increased risk of total and CRC-specific mortality compared with those with low scores at both time points (low/low).
Table 4.
HRs for Change in Diet Quality Pre- and Postdiagnosis of CRC With Mortality
Sensitivity Analyses
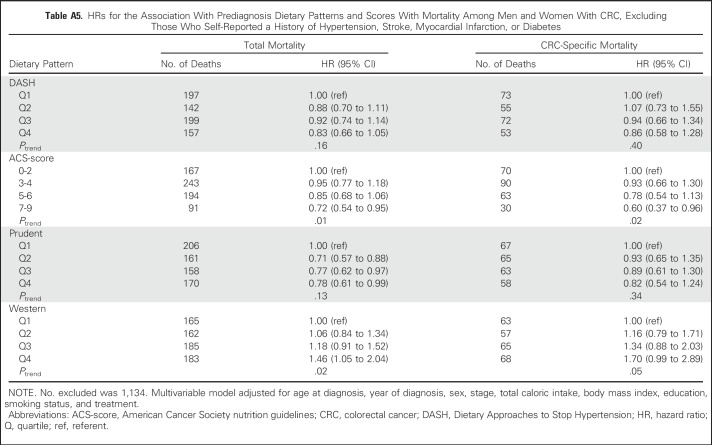
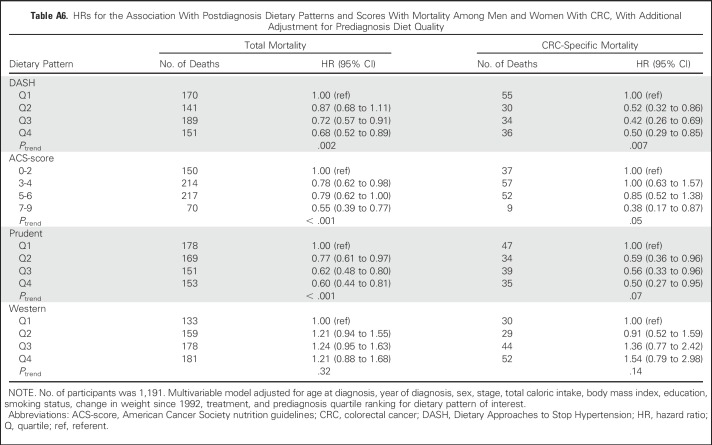
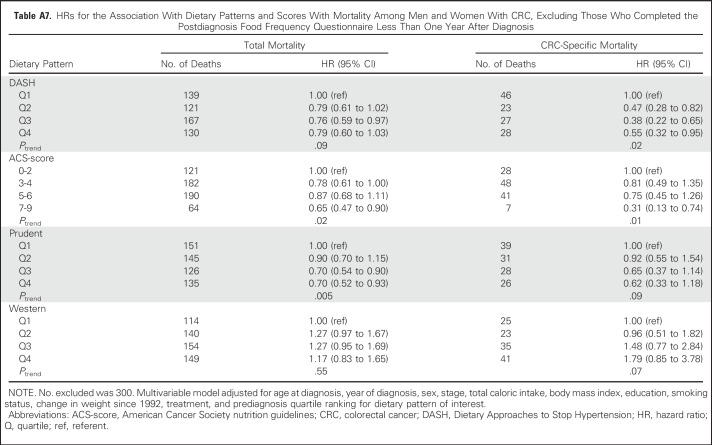
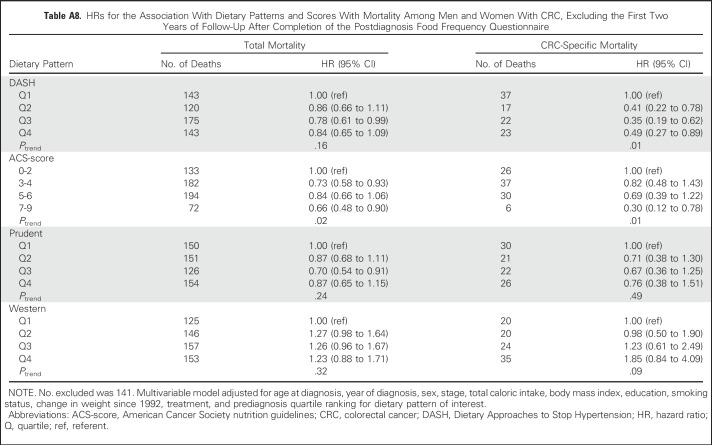
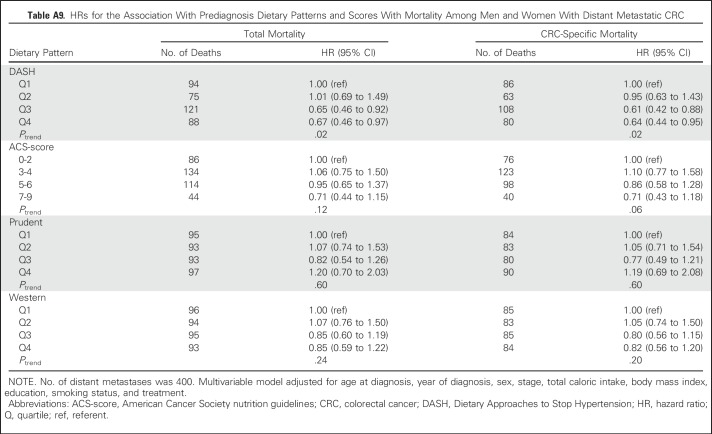
No substantive differences in HRs were observed in sensitivity analyses (Appendix Tables A4 to A9, online only).
DISCUSSION
In this prospective cohort of 2,801 men and women diagnosed with CRC, pre- and postdiagnosis diets that were consistent with the ACS Guidelines on Nutrition and Physical Activity for Cancer Prevention were inversely associated with all-cause and CRC-specific mortality. Additional diet patterns and scores that also were based on plant foods and low red and processed meat consumption corroborated these main findings, which suggests the importance of diet quality as a potentially modifiable tool to improve prognosis among men and women with CRC. In this first study to our knowledge that considered change in diet quality across the CRC continuum, these results suggest that high diet quality after diagnosis, even if poor before, may be associated with a lower risk of mortality.
Results of other studies that used dietary patterns to evaluate diet quality in relation to mortality among CRC survivors have been inconsistent.7-12 In the prospective National Institutes of Health-AARP Diet and Health Study, the highest prediagnosis scoring group of the Healthy Eating Index-2005, which measures adherence to the 2005 dietary guidelines for Americans,23 was associated with 40% and 36% lower risk of all-cause and CRC-specific mortality, respectively, among 1,514 rectal cancer survivors.7 However, no statistically significant associations were observed for colon cancer. Postdiagnosis diet was not evaluated. In another study of prediagnosis diet quality among 4,204 CRC survivors, the alternate Mediterranean diet was the only one of four dietary patterns associated with overall and CRC-specific survival, and the association was limited to women only.8 Sex-specific results in the current analysis did not suggest meaningful differences.
In an investigation of postdiagnosis diet quality in the Nurses’ Health Study, the Alternate Healthy Eating Index-2010 was associated with a 29% lower risk of all-cause mortality among 1,201 women, but null associations were observed for the alternate Mediterranean, Western, and prudent dietary patterns.10 We similarly observed a null association between the postdiagnosis Western dietary pattern and mortality; however, the postdiagnosis prudent dietary pattern was inversely associated with risk.
To our knowledge, this study was the first to evaluate associations of pre- and postdiagnosis diet quality with risk of mortality among CRC survivors, which allowed for the examination of change in diet quality from pre- to postdiagnosis. Consistently observed inverse associations suggest that prognosis may improve with better postdiagnosis diet, even when prediagnosis diet quality was relatively low. These results were supported further in postdiagnostic models that identified statistically significant associations between diet quality and mortality that were independent of prediagnosis diet quality. Additional large studies with robust diet and covariable data are needed to replicate (or refute) these findings.
The ACS-score was the only dietary pattern we evaluated that was derived specifically for cancer prevention, which may explain why its results were more strongly inverse than the other dietary patterns. A recent investigation among patients with stage III CRC reported that the fruit/vegetable and whole-grain components of the ACS-score were associated with higher survival, whereas the limiting of red and processed meat intake was associated with higher total mortality.24 Total servings and the variety of fruits and vegetables combine to make up one of the three components in ACS-score and may reflect the association between fiber25 and phytochemicals26 with CRC etiology, the latter of which increases greatly with more variety of colors and types of fruits and vegetables.27 The World Cancer Research Fund and American Institute for Cancer Research reported that whole grains probably decrease the risk of CRC incidence,2 although whether they are associated with mortality after CRC diagnosis remains unclear.28,29 In addition, the World Cancer Research Fund and American Institute for Cancer Research report convincing evidence that processed meat consumption and probable evidence that red meat consumption increase the risk of CRC.2 We found that consistently high red and processed meat consumption pre- and postdiagnosis compared with consistently low consumption was associated with lower CRC survival in a previous CPS-II study.21 Other ACS prevention guidelines that recommend increased physical activity, maintenance of a healthy BMI, and abstinence from smoking also have been associated with better prognosis of CRC in prior CPS-II investigations.30-32
Strengths of the current study include its large sample size, prospective design, and detailed information on potential confounders. A unique strength was the ability to evaluate both pre- and postdiagnosis diet quality. Limitations of this study include a lack of information on cancer recurrence and tumor molecular phenotype, the latter of which would allow us to classify participants with varying etiologies that might interact with diet.33 We did not have detailed treatment data, but on the basis of the limited treatment data available, they did not seem to be associated with diet quality. Self-reported dietary intakes are susceptible to bias, particularly when diet is reported after diagnosis. Some eligible participants (n = 159) did not respond to a postdiagnosis FFQ, which could bias the results, although this number was small, and sensitivity analyses did not suggest that bias was present. We evaluated the potential for reverse causation and other biases in multiple sensitivity analyses and did not observe evidence of such biases. The potential for unmeasured and residual confounding is inherent to the observational study design; however, there is limited feasibility of conducting a similar investigation in a randomized trial because of constraints on adherence and study duration.
Results from this study support recommendations for high diet quality before and after diagnosis to improve survival among men and women diagnosed with invasive, nonmetastatic CRC. Collectively, the results from all dietary patterns suggest that consumption of a diet high in plant products and fiber while limiting red and processed meat and added sugars both before and after diagnosis may be beneficial. Adherence to recommendations that are based on dietary associations with cancer, such as the ACS’s dietary guidelines for cancer prevention, may be particularly useful in improving prognosis as a result of observed associations of its individual dietary components with cancer risk, which may stem from underlying pro- or anticarcinogenic mechanisms. More studies with adequate power and information on dietary intakes at multiple time points relative to CRC diagnosis are needed to confirm or refute these results.
ACKNOWLEDGMENT
We sincerely appreciate all Cancer Prevention Study-II participants and each member of the study and biospecimen management group. We acknowledge the contributions to this study from central cancer registries supported through the Centers for Disease Control and Prevention’s National Program of Cancer Registries and cancer registries supported by the National Cancer Institute’s SEER Program.
Appendix
Table A1.
Scoring Criteria for DASH and ACS Nutrition Guideline Patterns
Table A2.
Factor Loadings for Food Groups in the Principal Component Analysis–Derived Dietary Patterns
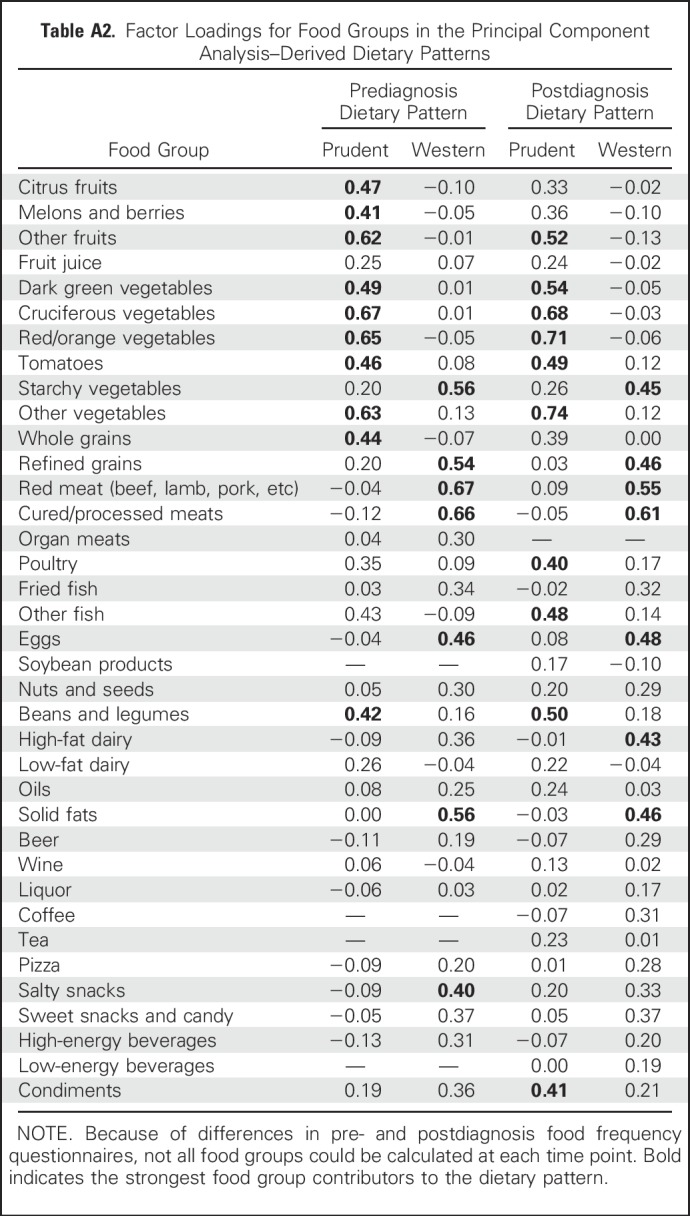
Table A3.
Pearson Correlation Coefficients for Dietary Patterns Assessed and Pre- and Postdiagnosis
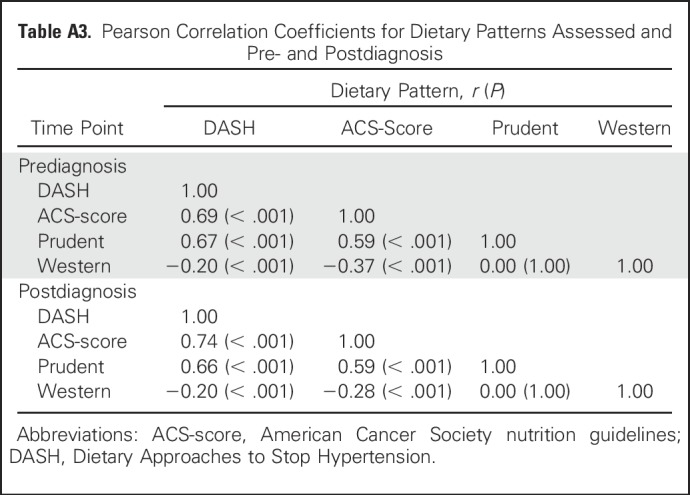
Table A4.
HRs for the Association With Prediagnosis Dietary Patterns and Scores With Mortality Among Men and Women With CRC, Excluding Participants Diagnosed in the First Two Years of Follow-Up After Food Frequency Questionnaire Completion
Table A5.
HRs for the Association With Prediagnosis Dietary Patterns and Scores With Mortality Among Men and Women With CRC, Excluding Those Who Self-Reported a History of Hypertension, Stroke, Myocardial Infarction, or Diabetes
Table A6.
HRs for the Association With Postdiagnosis Dietary Patterns and Scores With Mortality Among Men and Women With CRC, With Additional Adjustment for Prediagnosis Diet Quality
Table A7.
HRs for the Association With Dietary Patterns and Scores With Mortality Among Men and Women With CRC, Excluding Those Who Completed the Postdiagnosis Food Frequency Questionnaire Less Than One Year After Diagnosis
Table A8.
HRs for the Association With Dietary Patterns and Scores With Mortality Among Men and Women With CRC, Excluding the First Two Years of Follow-Up After Completion of the Postdiagnosis Food Frequency Questionnaire
Table A9.
HRs for the Association With Prediagnosis Dietary Patterns and Scores With Mortality Among Men and Women With Distant Metastatic CRC
Footnotes
Supported by the American Cancer Society's Cancer Prevention Studies Postdoctoral Fellowship Program (M.A.G.) and by American Cancer Society funds for the creation, maintenance, and updating of the Cancer Prevention Study-II cohort.
The views expressed here are those of the authors and do not necessarily represent the American Cancer Society or the American Cancer Society Cancer Action Network.
AUTHOR CONTRIBUTIONS
Conception and design: Mark A. Guinter, Marjorie L. McCullough, Peter T. Campbell
Financial support: Mark A. Guinter, Susan M. Gapstur, Peter T. Campbell
Administrative support: Mark A. Guinter, Susan M. Gapstur, Peter T. Campbell
Collection and assembly of data: All authors
Data analysis and interpretation: All authors
Manuscript writing: All authors
Final approval of manuscript: All authors
Accountable for all aspects of the work: All authors
AUTHORS' DISCLOSURES OF POTENTIAL CONFLICTS OF INTEREST
Associations of Pre- and Postdiagnosis Diet Quality With Risk of Mortality Among Men and Women With Colorectal Cancer
The following represents disclosure information provided by authors of this manuscript. All relationships are considered compensated. Relationships are self-held unless noted. I = Immediate Family Member, Inst = My Institution. Relationships may not relate to the subject matter of this manuscript. For more information about ASCO's conflict of interest policy, please refer to www.asco.org/rwc or ascopubs.org/jco/site/ifc.
Mark A. Guinter
No relationship to disclose
Marjorie L. McCullough
No relationship to disclose
Susan M. Gapstur
No relationship to disclose
Peter T. Campbell
No relationship to disclose
REFERENCES
- 1.Siegel RL, Miller KD, Fedewa SA, et al. : Colorectal cancer statistics, 2017. CA Cancer J Clin 67:177-193, 2017 [DOI] [PubMed] [Google Scholar]
- 2.World Cancer Research Fund International : Diet, Nutrition, Physical Activity and Cancer: A Global Perspective. http://www.wcrf.org/dietandcancer
- 3.Steck SE, Guinter M, Zheng J, et al. : Index-based dietary patterns and colorectal cancer risk: A systematic review. Adv Nutr 6:763-773, 2015 [DOI] [PMC free article] [PubMed] [Google Scholar]
- 4.McCullough ML, Gapstur SM, Shah R, et al. : Association between red and processed meat intake and mortality among colorectal cancer survivors. J Clin Oncol 31:2773-2782, 2013 [DOI] [PMC free article] [PubMed] [Google Scholar]
- 5.Van Blarigan EL, Meyerhardt JA: Role of physical activity and diet after colorectal cancer diagnosis. J Clin Oncol 33:1825-1834, 2015 [DOI] [PMC free article] [PubMed] [Google Scholar]
- 6.Yang B, McCullough ML, Gapstur SM, et al. : Calcium, vitamin D, dairy products, and mortality among colorectal cancer survivors: The Cancer Prevention Study-II Nutrition Cohort. J Clin Oncol 32:2335-2343, 2014 [DOI] [PubMed] [Google Scholar]
- 7.Pelser C, Arem H, Pfeiffer RM, et al. : Prediagnostic lifestyle factors and survival after colon and rectal cancer diagnosis in the National Institutes of Health (NIH)-AARP Diet and Health Study. Cancer 120:1540-1547, 2014 [DOI] [PMC free article] [PubMed] [Google Scholar]
- 8.Jacobs S, Harmon BE, Ollberding NJ, et al. : Among 4 diet quality indexes, only the alternate Mediterranean Diet Score is associated with better colorectal cancer survival and only in African American women in the multiethnic cohort. J Nutr 146:1746-1755, 2016 [DOI] [PMC free article] [PubMed] [Google Scholar]
- 9.Zhu Y, Wu H, Wang PP, et al. : Dietary patterns and colorectal cancer recurrence and survival: A cohort study. BMJ Open 3:e002270, 2013 [DOI] [PMC free article] [PubMed] [Google Scholar]
- 10.Fung TT, Kashambwa R, Sato K, et al. : Post diagnosis diet quality and colorectal cancer survival in women. PLoS One 9:e115377, 2014 [DOI] [PMC free article] [PubMed] [Google Scholar]
- 11.Ratjen I, Schafmayer C, di Giuseppe R, et al. : Postdiagnostic Mediterranean and healthy Nordic dietary patterns are inversely associated with all-cause mortality in long-term colorectal cancer survivors. J Nutr 147:636-644, 2017 [DOI] [PubMed] [Google Scholar]
- 12.Meyerhardt JA, Niedzwiecki D, Hollis D, et al. : Association of dietary patterns with cancer recurrence and survival in patients with stage III colon cancer. JAMA 298:754-764, 2007 [DOI] [PubMed] [Google Scholar]
- 13.Calle EE, Rodriguez C, Jacobs EJ, et al. : The American Cancer Society Cancer Prevention Study II Nutrition Cohort: Rationale, study design, and baseline characteristics. Cancer 94:2490-2501, 2002 [DOI] [PubMed] [Google Scholar]
- 14.Calle EE, Terrell DD: Utility of the National Death Index for ascertainment of mortality among Cancer Prevention Study II participants. Am J Epidemiol 137:235-241, 1993 [DOI] [PubMed] [Google Scholar]
- 15.Block G, Hartman AM, Naughton D: A reduced dietary questionnaire: Development and validation. Epidemiology 1:58-64, 1990 [DOI] [PubMed] [Google Scholar]
- 16.Flagg EW, Coates RJ, Calle EE, et al. : Validation of the American Cancer Society Cancer Prevention Study II Nutrition Survey Cohort Food Frequency Questionnaire. Epidemiology 11:462-468, 2000 [DOI] [PubMed] [Google Scholar]
- 17.Feskanich D, Rimm EB, Giovannucci EL, et al. : Reproducibility and validity of food intake measurements from a semiquantitative food frequency questionnaire. J Am Diet Assoc 93:790-796, 1993 [DOI] [PubMed] [Google Scholar]
- 18.Rimm EB, Giovannucci EL, Stampfer MJ, et al. : Reproducibility and validity of an expanded self-administered semiquantitative food frequency questionnaire among male health professionals. Am J Epidemiol 135:1114-1126, 1992, discussion 1127-1136 [DOI] [PubMed] [Google Scholar]
- 19.Vogt TM, Appel LJ, Obarzanek E, et al. : Dietary Approaches to Stop Hypertension: Rationale, design, and methods. J Am Diet Assoc 99:S12-S18, 1999. (suppl) [DOI] [PubMed] [Google Scholar]
- 20.Kushi LH, Doyle C, McCullough M, et al. : American Cancer Society Guidelines on nutrition and physical activity for cancer prevention: Reducing the risk of cancer with healthy food choices and physical activity. CA Cancer J Clin 62:30-67, 2012 [DOI] [PubMed] [Google Scholar]
- 21.McCullough ML, Gapstur SM, Shah R, et al. : Pre- and postdiagnostic diet in relation to mortality among breast cancer survivors in the CPS-II Nutrition Cohort. Cancer Causes Control 27:1303-1314, 2016 [DOI] [PubMed] [Google Scholar]
- 22.McCullough ML, Patel AV, Kushi LH, et al. : Following cancer prevention guidelines reduces risk of cancer, cardiovascular disease, and all-cause mortality. Cancer Epidemiol Biomarkers Prev 20:1089-1097, 2011 [DOI] [PubMed] [Google Scholar]
- 23.Guenther PM, Reedy J, Krebs-Smith SM: Development of the Healthy Eating Index-2005. J Am Diet Assoc 108:1896-1901, 2008 [DOI] [PubMed] [Google Scholar]
- 24.Van Blarigan EL, Fuchs CS, Niedzwiecki D, et al. : Association of survival with adherence to the American Cancer Society nutrition and physical activity guidelines for cancer survivors after colon cancer diagnosis: The CALGB 89803/Alliance trial. JAMA Oncol 4:783-790, 2018 [DOI] [PMC free article] [PubMed] [Google Scholar]
- 25.Kunzmann AT, Coleman HG, Huang WY, et al. : Dietary fiber intake and risk of colorectal cancer and incident and recurrent adenoma in the Prostate, Lung, Colorectal, and Ovarian Cancer Screening Trial. Am J Clin Nutr 102:881-890, 2015 [DOI] [PMC free article] [PubMed] [Google Scholar]
- 26.Li YH, Niu YB, Sun Y, et al. : Role of phytochemicals in colorectal cancer prevention. World J Gastroenterol 21:9262-9272, 2015 [DOI] [PMC free article] [PubMed] [Google Scholar]
- 27.Liu RH: Health-promoting components of fruits and vegetables in the diet. Adv Nutr 4:384S-392S, 2013 [DOI] [PMC free article] [PubMed] [Google Scholar]
- 28.Jansen MC, Bueno-de-Mesquita HB, Buzina R, et al. : Dietary fiber and plant foods in relation to colorectal cancer mortality: The Seven Countries Study. Int J Cancer 81:174-179, 1999 [DOI] [PubMed] [Google Scholar]
- 29.Skeie G, Braaten T, Olsen A, et al. : Whole grain intake and survival among Scandinavian colorectal cancer patients. Nutr Cancer 66:6-13, 2014 [DOI] [PubMed] [Google Scholar]
- 30.Campbell PT, Patel AV, Newton CC, et al. : Associations of recreational physical activity and leisure time spent sitting with colorectal cancer survival. J Clin Oncol 31:876-885, 2013 [DOI] [PubMed] [Google Scholar]
- 31.Campbell PT, Newton CC, Dehal AN, et al. : Impact of body mass index on survival after colorectal cancer diagnosis: The Cancer Prevention Study-II Nutrition Cohort. J Clin Oncol 30:42-52, 2012 [DOI] [PubMed] [Google Scholar]
- 32.Yang B, Jacobs EJ, Gapstur SM, et al. : Active smoking and mortality among colorectal cancer survivors: The Cancer Prevention Study II Nutrition Cohort. J Clin Oncol 33:885-893, 2015 [DOI] [PubMed] [Google Scholar]
- 33.Ogino S, Goel A: Molecular classification and correlates in colorectal cancer. J Mol Diagn 10:13-27, 2008 [DOI] [PMC free article] [PubMed] [Google Scholar]


