Abstract
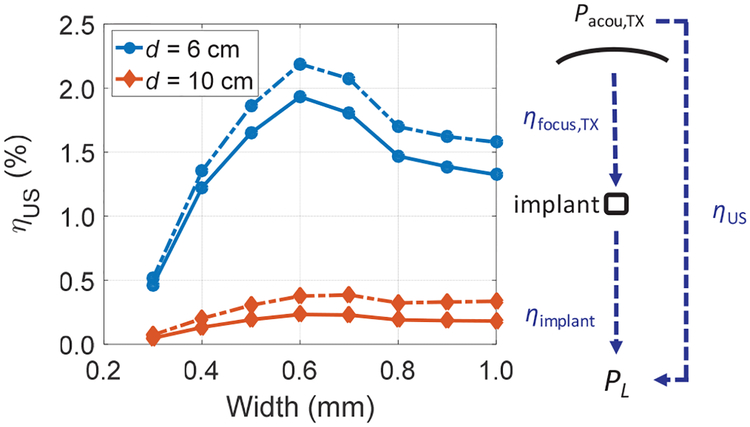
We present an analytical framework for optimizing the efficiency of ultrasonic wireless power links for implantable devices scaled down to sub-mm dimensions. Key design insights and tradeoffs are considered for various parameters including the operating frequency, the transmission depth, the size of the transmitter, the impedance and the aperture efficiency of the miniaturized receiver, and the interface between the receiver and the power recovery chain on the implant. The performance of spherically focused transducers as ultrasonic transmitters is analyzed to study the limits and the tradeoffs. Two optimization methods are presented: “Focal Peak” sets the focus of transducers at target depths, and “Global Maximum” maximizes the efficiency globally with off-focus operation. The results are also compared to phased array implementations. To investigate the efficiency of implants, miniaturized receivers made from single crystalline piezoelectric material, PMN-PT, are used as they have resonances in the derived optimal carrier frequency range (~ l-2 MHz). A methodology to achieve an efficient interface to the power electronics is then provided using an optogenetic stimulator as an example platform. The analytical results are verified through both simulations and measurements. Finally, an example ultrasonic link using a spherical transmitter with a radius of 2 cm is demonstrated; link efficiencies of 1.93–0.23% are obtained at 6–10 cm depths with sub-mm receivers for the optogenetic application.
Index Terms: implantable devices, ultrasonic power transfer, wireless power transfer, link efficiency, miniaturized receivers, spherically focused transducer, phased array, single crystalline piezoelectric materials, optogenetic stimulators
I. Introduction
Miniaturization of implantable devices can allow for less invasive surgical procedures, reduce damage to the surrounding tissue, and potentially open up new medical applications [1]–[4], To achieve this goal, wireless powering of implants to eliminate batteries has been of significant interest over the past decade [5]–[8], There have been many research efforts on inductive and capacitive coupling [8]–[10], RF-based radiative power transfer [6], [11], and optical techniques [12], Alternatively, power delivery using ultrasound (US) has recently been shown as a promising approach [7], [13]–[18]. US has several advantages including superior transduction efficiency and energy focusing as a result of mm wavelength [7], [19], low tissue attenuation (0.5–1.0 dB·cm−1·MHz−1) [20], and high safety limit (7.2 mW/mm2) [21], With these advantages, mm-sized US-powered implants through deep tissue have been demonstrated in [7], [22]–[27] for different applications.
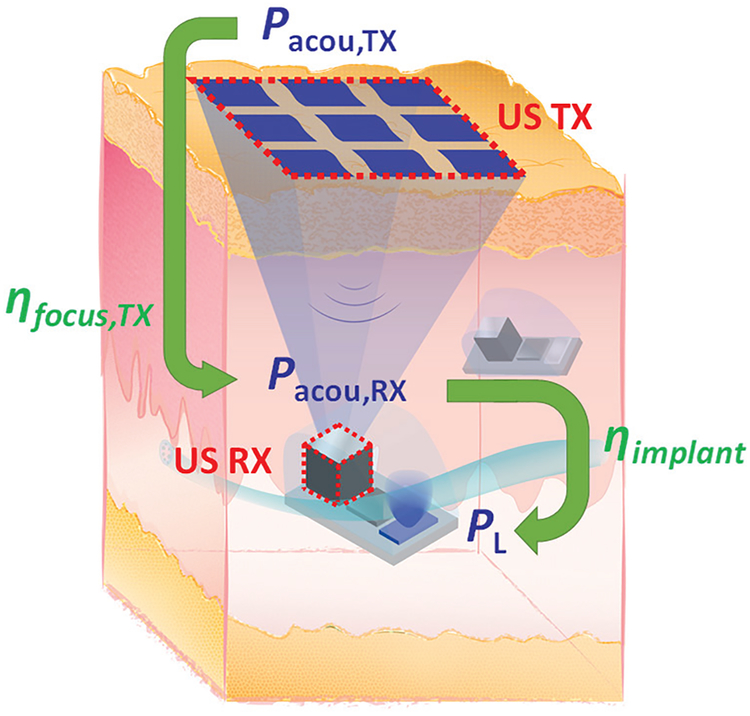
A conceptual diagram of an implant system with an US power link is shown in Fig. 1. A US transmitter (TX), which can be implemented using a single element transducer or an array, is placed on or under the skin. Acoustic power is transmitted wirelessly from the TX and harvested by the US receiver (RX) on the implant embedded in tissue. Depending on the applications, implants may require power levels ranging from several μWs (sensing or monitoring) to several mWs (stimulation). Analysis of various aspects of US links and its transfer efficiency have been previously addressed in the literature [13]-[17], [28], Many of these works rely on the transmission line based one-dimensional (ID) models [13], [28]; however, these models do not take into account the effects of focusing or diffraction of US waves as well as scaling of the RX. In [14], analysis is presented to study the performance of the RX, but it does not include the discussion of the TX. In [15], [16], designs of US links are demonstrated using specific examples, and both have large RXs (> 50 mm2); thus, design insights for miniaturized implants are lacking. Further, in [17], optimization of the US link is shown using simulations, it lacks an analytical study for design intuition; the discussion in [17] is also limited toflat, single-element transducers without considerations of focused transducers or arrays on the TX side.
Fig. 1.
A conceptual diagram of an implant system with US wireless power transfer.
In this paper, we present an analytical framework to compute and optimize the efficiency of US links when the implant is aggressively scaled down to mm or sub-mm dimensions. The framework provides key design insights for both US TX and RX with considerations of various design parameters. We will discuss two optimization procedures; the optimal operating frequency and the associated efficiency will be shown for given transmission distances and TX/RX sizes for both methods. We also include, and further expand on, the work in [18] to show the end-to-end link efficiency of an example optogenetic application. This framework can be extended to other US power applications with different constraints and specifications.
In section II, we introduce the expression of the overall US link efficiency and explain the individual components involved in the link. A spherically focused transducer, acting as an ideal TX, is analyzed and compared with the simulations for two methods in section III. Tradeoffs between TX aperture size, operating frequency, and power transfer depth are discussed. In section IV, we show the design methodology of scaled RXs with piezoelectric materials in the context of the entire US link such that they fall in the optimal frequency range and have favorable impedances. In addition, the harvesting capability of scaled RXs and the efficiency of the complete power recovery chain of an implantable optogenetic stimulator are investigated. Finally, we combine the analysis of TX and RX in section V and present the end-to-end efficiency of an example US link.
II. US Link Efficiency
For power transfer to miniaturized implants, a RX is typically placed near or beyond the focus of a TX, and the wireless link operates in the radiative near-field or far-field. Since the US TX and RX have significant size difference, the direct coupling, as is common with power transfer using large inductive coils, is minimal [8], [29], [30], Therefore, the overall US link efficiency, ηUS, can be generalized as the product of two independent terms,
| (1) |
where ηfocus,TX is the focusing efficiency of the TX, which can be expressed as the total acoustic power incident on the RX, Pacou,RX, divided by the total acoustic power emitted from the TX, Pacou,TX; ηimplant is the efficiency of the implant to convert Pacou,RX to the electrical power delivered to the medical payload, PL. Both efficiency terms are illustrated in Fig. 1. ηfocus,TX is determined mainly by twofactors, the ability of the TX tofocus the beam and the propagation losses in the medium. The first is related to the geometry, the aperture, the phases of the array elements, and the operating frequency. The latter is associated with the tissue type as well as the operating frequency and the transmission distance; the attenuation in a typical medium is about 0.5–1.0 dB·cm−1·MHz−1 forplane wave propagation [20], ηimplant is a function of the characteristics of the RX, impedance matching between the RX and the electronics, and the efficiency of AC to DC conversion circuits which further depends on the electrical load [7], Note that (1) does not include the electrical-acoustic conversion efficiency of the TX as it depends on the materials, the resonance, and the acoustic design of transducers; transducers with electrical-acoustic conversion efficiency as high as 85% have been reported [31], [32], Furthermore, overhead power from control circuits and power amplifiers driving the TX are also excluded in (1) since they are dependent on the specific circuit implementations which have been discussed in the literature [16], [33], [34].
III. Focusing Efficiency of a US Transmitter
In order to optimize ηfocus,TX, a US TX should have a large focusing gain or a more confined beam. This can be achieved by using higher operating frequencies or larger apertures for a given transmission depth [35], [36], However, the attenuation in the medium becomes more severe at higher frequencies, and the utilization of large transducers may present practical challenges. There is also a tradeoff between efficiency and alignment; when the beam emitted from a TX is more focused, the link becomes more sensitive to the alignment. To study the limits and the tradeoffs, we analyze a spherically focused transducer with analytical calculations and simulations using Field II [37], [38], This gives an upper bound on the link performance. We then consider a more practical scenario when the TX is a two-dimensional (2D) transmitter array, which is capable of adjusting the US beam electrically to different locations, similar to arrays used for medical imaging [33], [39].
A. Analysis of Spherically Focused Transducers
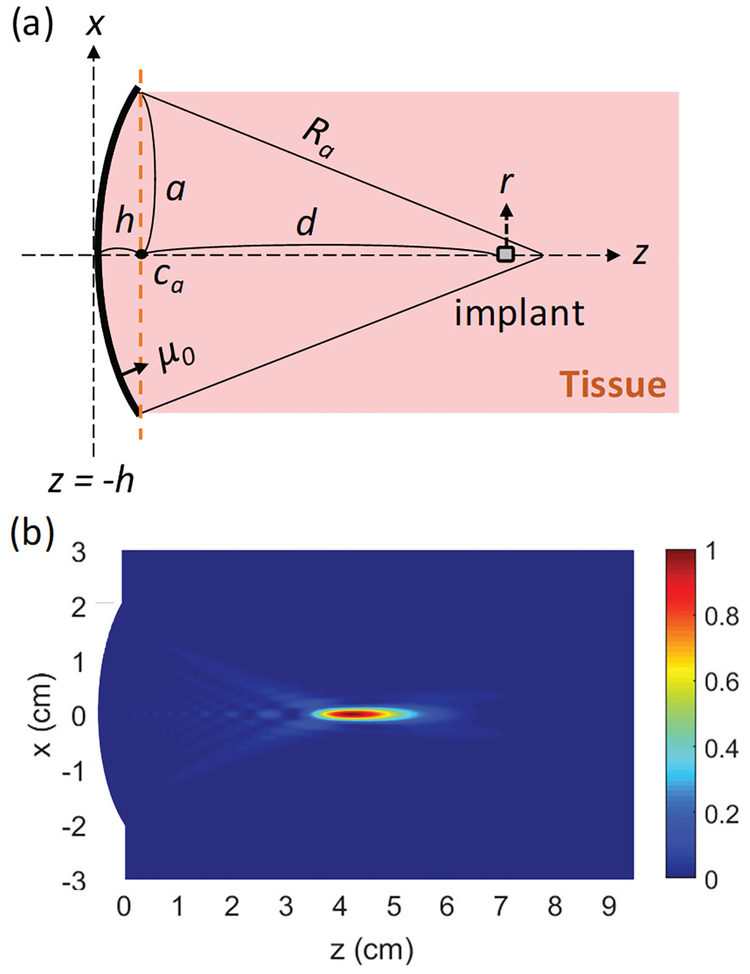
Fig. 2 (a) illustrates a spherically focused transducer used as aUS TX. The transducer has a circular aperture with a radius a and is assumed to have a uniform normal displacement velocity, μ0, on the surface. The radius of curvature or the geometrical focus of a transducer, Ra, determines the location of the focus. h is the distance between the center of the transducer surface and the center of its circular aperture plane (point ca in Fig. 2 (a)). The focusing strength of a transducer is characterized by a2/λRa, where λ is the wavelength [35], [40]. We define the transmission depth through tissue, d, from the circular aperture plane to the location of the implant as seen in Fig. 2 (a). Pacou,TX for a transducer with μ0 on the surface can be calculated by,
| (2) |
where Z0 is the acoustic impedance of the medium and π(a2+h2) is the total surface area of the transducer. Fig. 2 (b) shows an example of simulated normalized acoustic intensity at 1.0 MHz in the xz-plane using parameters of a = 2 cm, Ra = 5 cm, and μ0 = 5 mm/s in homogeneous tissue with 0.8 dB/cm attenuation. The US beam is focused at 4.75 cm away from the surface of the TX, slightly smaller than the geometrical focus of 5 cm due to diffraction and attenuation [35], [40], [41]; thus, Ra should be tuned accordingly if one wants to place the actual focus at the desired location.
Fig. 2.
(a) Side view of a generic spherically focused transducer with a circular aperture of a and a uniform normal displacement velocity of μ0 on the surface, (b) Simulated normalized Iacou in the xz plane at 1.0 MHz with a = 2 cm, Ra = 5 cm, and μ0 = 5 mm/s in tissue which has a density of 1 g/cm3 and an attenuation ofθ.8 dB/cm. The color scaleis linear.
To calculate Pacou,RX, it is necessary to know the acoustic intensity, Iacou, in terms of power per unit area, incident on the RX as well as the relationship between the associated beam size and the area of the RX, ARX. Iacou along the z axis of a spherically focused transducer in an attenuating medium is analytically derived in [42],
| (3) |
| (4) |
| (5) |
| (6) |
where p is the pressure along the z axis, ρ0 and c0 are the density and the sound velocity of the medium, ω is the frequency, and kc is the complex wavenumber containing the attenuation coefficient of the medium, α. Equation (3) is more accurate around and beyond the focus. Note that wave propagation in tissue is typically considered as linear for pressure amplitudes used in US wireless power transfer and in this work [36]. The shape of the main beam at and beyond the focal plane can be approximated by the square of a Jinc function [35], [42],
| (7) |
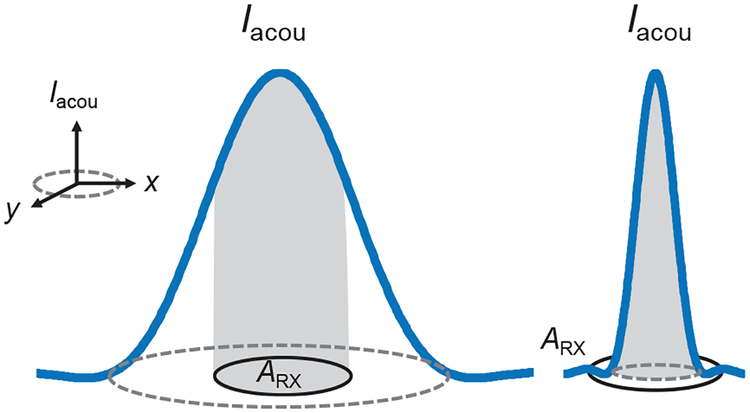
where r is the distance from the center of the plane of interest and J1 is the order-one Bessel function of the first kind. With the knowledge of Iacou and the shape of the beam in the plane, Pacou,RX can be approximated based on the ‘cone’ model shown in Fig. 3. The bottom of the cone is the plane of interest and the tip of the cone represents the maximum Iacou in the plane; as a result, the volume of the cone is equal to the total acoustic power within the main beam. If Arx is smaller than the beam, Pacou,RX is computed by integrating Iacou incident only on the RX (partial volume of the cone); otherwise, Pacou,RX is the total acoustic power contained in the beam (total volume of the cone). Because of this approximation, the error in Pacou,RX increases when the beam is comparable to or smaller than ARX.
Fig. 3.
Cone model used for Pacou,RX calculation. The bottom of the cone is the plane of interest (xy-plane) and the tip of the cone is the maximum Iacou in the plane. The volume of the cone represents the total acoustic power in the beam. The shaded volume is the acoustic power captured by the receiver with ARX.
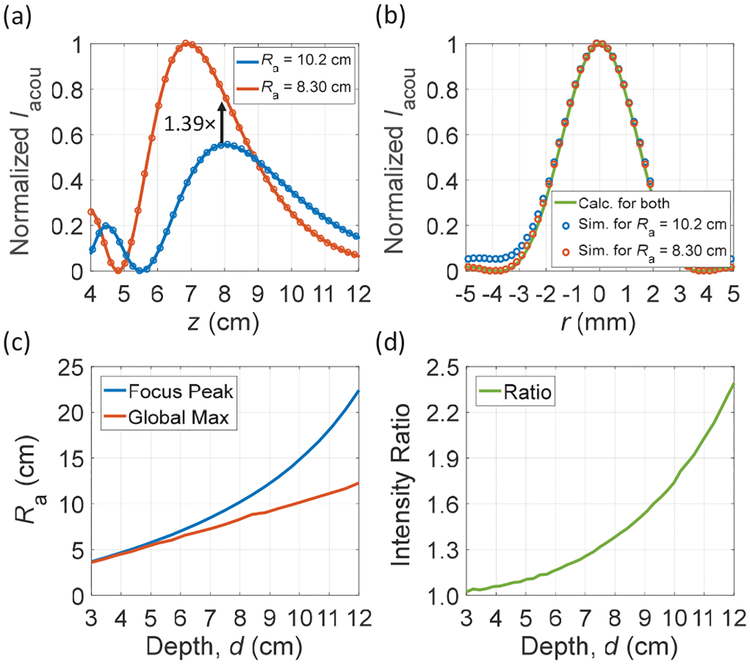
To investigate how the choice of Ra impacts the link efficiency, we look at an example scenario where the target transmission depth is 8 cm. Using the same parameters in Fig. 2 (b), Ra is adjusted to 10.2 cm to set the actual focus to 8 cm; the normalized Iacou along the z axis is shown as the blue curve in Fig. 4 (a). But if operating off the focal point and having spots with intensities larger than the location of the RX in the field is acceptable for the intended applications, a different Ra should be chosen in order to maximize the efficiency globally. As seen in Fig. 4 (a), with the same Pacou,TX, the TX with an Ra of 8.3 cm has an Iacou 1.39× higher than the one with an Ra of 10.2 cm at the same depth of 8 cm. This is because the TX with smaller Ra has larger focusing strength at the same operating frequency. Since the simulated lateral beam profiles at the 8 cm plane are similar for both cases, as plotted in Fig. 4 (b), it is preferable to utilize a TX with an Ra of 8.3 cm in this example to maximize ηfocus,TX for mm-sized RXs. A downside of going for the smaller Ra is that the link becomes slightly more sensitive in the z direction as the gradient of the intensity curve is not 0; nevertheless, even with small perturbations in z, higher efficiency can still be achieved by operating off the focus. Fig. 4 (c) shows the comparison between the calculated Ra versus depths for setting the focus at the target depths, “Focal Peak (FP),” and for maximizing efficiency globally, “Global Maximum (GM)”. For shallow depths, Ra are close for both cases; but they start deviating for larger depths and the ratio of intensity between the two increases as shown in Fig. 4 (d).
Fig. 4.
(a) Calculated (solid lines) and simulated (circle markers) normalized Iacou vs. depth with two different Ra. (b) Calculated and simulated beam profiles at 8 cm depth, (c) Comparison of Ra for FP and GM vs. targeted depths, (d) Calculated intensity ratio between FP and GM across depths. Parameters used are a = 2 cm, μ0 = 5 mm/s, c0 = 1540 m/s, and α = 0.8 dB/cm; the operating frequency is 1.0 MHz.
We are now ready to optimize ηfocus,TX across frequencies using both the FP and GM methods. The procedure for FP is as follows: for a given target transmission depth and a TX size, the location of the actual focus that is equal to the depth is first found by sweeping Ra; then Pacou,RX is calculated based on the corresponding Iacou and the beam profile with the given ARX; finally, ηfocus,TX is computed by dividing the calculated Pacou,RX by the associated Pacou,TX·For GM, Pacou,RX for different Ra is computed based on Iacou, the given ARX, and the beam profile; then maximum ηfocus,TX at each frequency is selected. Here, we consider a from 1 to 3 cm since it is a reasonable range for a wearable TX or a TX implanted under the skin. Castor oil, which has similar acoustic properties to tissue (ρ0= 0.93 g/cm3, Z0 = 1.40 MRayls, and an approximated α = 0.8 dB·cm−1·MHz−1) is used as the medium to be consistent with the measurement environment. ARX is assumed to be a 1.0 mm2 disk as an example miniaturized RX on in this section (ηfocus,TX for different ARX will be discussed in section V).
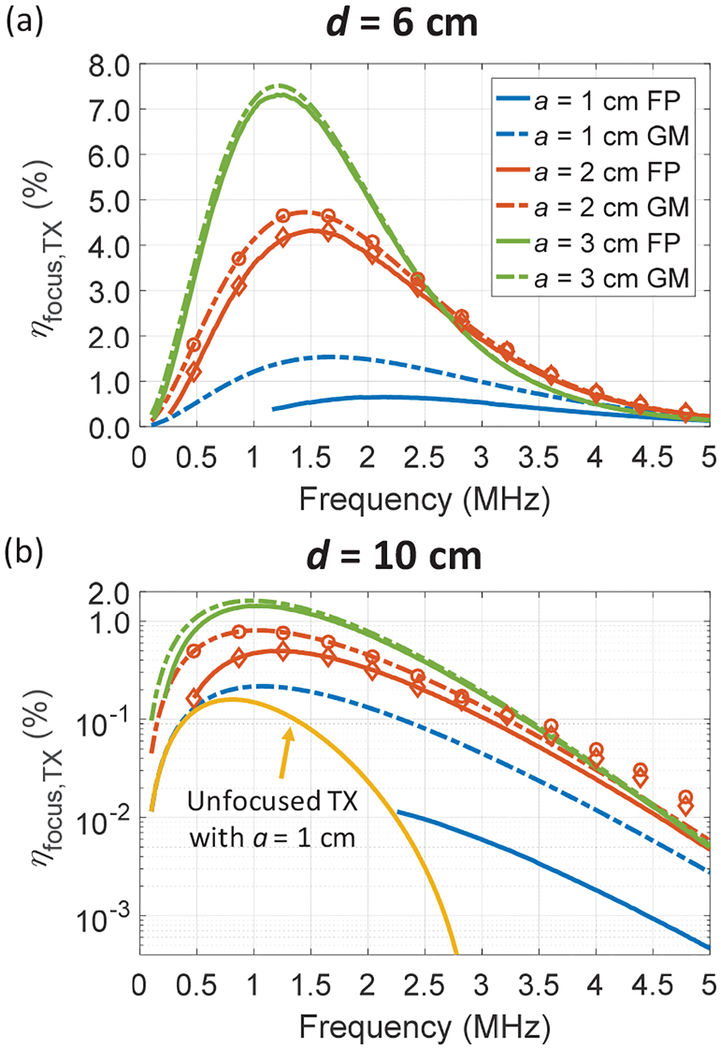
Fig. 5 plots the calculated ηfocus,TX across frequencies of two optimizations for three different values of a and for two example depths of 6 and 10 cm. The simulated ηfocus,TX are also shown for a TX with an a of 2.0 cm in the figure. Pacou,RX in the simulation is computed by integrating Iacou numerically over the entire ARX instead of using the cone model. The simulations agree well with the analytical calculations; small deviations are seen at high frequencies since the beamwidth is close to size of the RX. Several observations can be made from Fig. 5 for both the FP and GM methods. First, there is a fundamental tradeoff between focusing gain and propagation loss for a given aperture size; for lower frequencies, ηfocus,TX drops due to smaller focusing strength even though the attenuation is lower; for higher frequencies, ηfocus,TX decreases because the attenuation increases. Second, the optimal frequency, fopt, lies around 1 to 2 MHz for maximum ηfocus,TX, and it decreases for larger transmission depth due to the increasing losses. Third, a TX with a larger aperture gives higher ηfocus,TX and has lower fopt because its focusing strength is stronger at lower frequencies. Based on the discussion above, one can expect that a medium with a larger attenuation coefficient will decrease ηfocus,TX and fopt. In addition, when ARX is scaled down, ηfocus,TX will drop due to a smaller power receiving area.
Fig. 5.
Calculated ηfocus,TX vs. frequency for 3 different a and for depths of (a) 6 cm and (b) 10 cm with an ARX of 1 mm2. Solid line is optimized with FP and dash line is with GM. For the FP method, the TX with a = 1.0 cm for a depth of 10 cm is not able tofocus for lower frequencies; ηfocus,TX for a plane transducer is also shown in (b). Simulated ηfocus,TXfor a = 2.0 cm are plotted with diamond (FP) and circle (GM) markers.
Fig. 5 also shows the comparison between the results of the FP and GM optimizations. ηfocus,TX obtained by GM is higher than ηfocus,TX from FP across all frequencies though the difference becomes negligible with large TXs and small transmission depths. As mentioned previously, one should consider intensities at other locations for GM due to off-focus operation. Large differences in ηfocus,TX are observed between the two methods for small a since placing the actual focus at the desired depth requires large Ra for a given frequency which results in weaker focusing. As seen in Fig. 5 (b), the FP algorithm is not able to focus to 10 cm depth at low frequencies for an a of 1 cm. In order to make comparison to GM, we also plot ηfocus,TX of an unfocused TX (i.e. Ra is infinite). In this case, the RX is also operated off the peak intensity point. The optimal ηfocus,TX for this TX is 0.16% achieved at 0.82 MHz, which is still lower than 0.22% obtained from GM.
Table I summarizes the details at the optimal points for both depths. For an a of 3.0 cm, ηfocus,TX with the GM method can reach 7.51% for a depth of 6 cm and 1.62% for a depth of 10 cm with an ARX of 1 mm2, indicating that the US TX can efficiently transfer power through large depths of tissue to power up mm-sized implants. The calculated and simulated half-power beam widths at the operating point, w3dB, are also shown in Table I. For the calculation, w3dB is approximated with 0.51λd/a by setting (7) to 0.5; compared to the simulated values, calculated w3dB is slightly underestimated. For the examples in Table I, w3dB are larger than RX sizes of interest, particularly for 10 cm depth; thus, the link is not extremely sensitive to the lateral alignment between the TX and the RX. Tofurther mitigate the sensitivity to the alignment, one can choose to use a TX with a smaller aperture or shift to a lower operating frequency (w3dB is inversely proportional to frequency), directly trading off with efficiency; closed-loop controls can also be implemented to ensure the alignment [43].
TABLE I.
Detail Summary at the Optimal Points in Fig. 5
| fopt (MHz) | ηfocus,TX (%) | Ra (cm) | w3dB (mm) [calc./sim.] | ||||||
|---|---|---|---|---|---|---|---|---|---|
| Depth (cm) | 6 | 10 | 6 | 10 | 6 | 10 | 6 | 10 | |
| a = 1.0 cm | FP | 2.16 | 0.82* | 0.65 | 0.16* | 10.1 | × | 2.13/2.24 | 9.33/9.48* |
| GM | 1.69 | 1.08 | 1.54 | 0.22 | 6.40 | 10.7 | 2.72/2.76 | 7.08/7.10 | |
| a = 2.0 cm | FP | 1.51 | 1.22 | 4.32 | 0.50 | 6.64 | 13.2 | 1.52/1.60 | 3.14/3.28 |
| GM | 1.45 | 1.04 | 4.72 | 0.81 | 6.31 | 10.2 | 1.58/1.65 | 3.68/3.76 | |
| a = 3.0 cm | FP | 1.26 | 1.02 | 7.32 | 1.43 | 6.80 | 11.1 | 1.21/1.33 | 2.50/2.64 |
| GM | 1.22 | 0.98 | 7.51 | 1.62 | 6.70 | 10.5 | 1.25/1.40 | 2.60/2.72 | |
Plane transducer, off-focus operation.
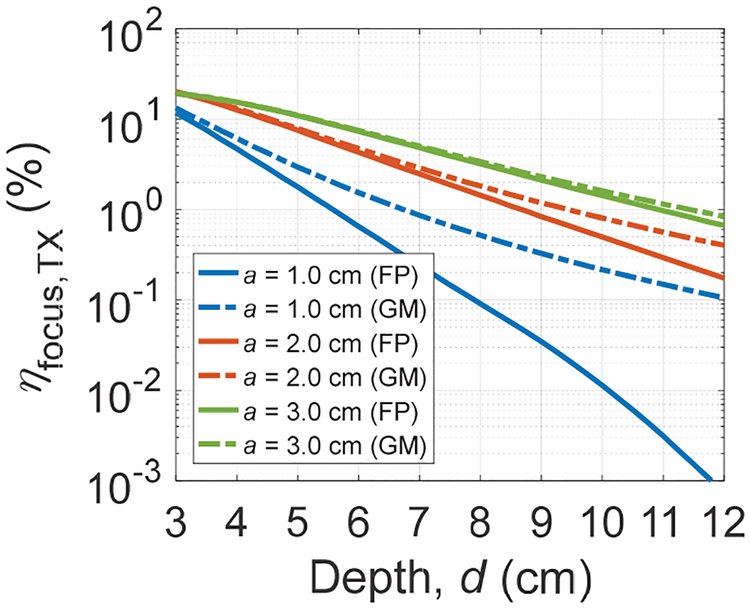
Using the optimization algorithms for the FP and GM methods, optimal ηfocus,TX across transmission depths for three apertures with an ARX of 1 mm2 can be found (Fig. 6). As expected, shallow depths and larger apertures achieve higher ηfocus,TX with the tradeoff of smaller beamwidth; ηfocus,TX of 20% is obtained for an a of 3.0 cm at a depth of 3 cm. Comparing FP and GM for a given TX size, ηfocus,TX deviates more for larger depths. Particularly, for an a of 1.0 cm, ηfocus,TX from FP drops at a steeper rate because higher operating frequency is required to set the focus, resulting in larger attenuation; as a consequence, focal points of the TX with an a of 1.0 cm beyond 6 cm transmission depths do not necessarily have the highest intensity in the field.
Fig. 6.
Calculated optimal ηfocus,TX for three different a across transmission depths from 3 to 12 cm with an ARX of 1 mm2 for the FP and GM optimizations.
B. Measurement of Spherically Focused Transducers
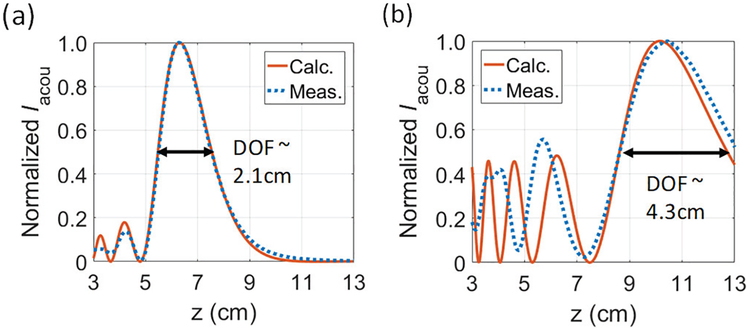
To confirm the analysis, we measure the intensity profiles of two focused transducers with an a of 2.0 cm but different focusing depths (Olympus 392). These transducers achieve focusing through the use of acoustic lenses. Although they are not constructed with spherically curved crystals as depicted in Fig. 2 (a), [44] shows that the analytical model can still be applied by correcting the radius of curvature of the transducers. Therefore, we first conduct measurements in water (medium with negligible attenuation) to estimate Ra and find the electrical-to-acoustic conversion efficiency which includes the effects of imperfect geometry and non-uniform displacement on the surface as well as losses through the backing, the matching layers, the acoustics lens, and the material. Iacou of both transducers are mapped using the hydrophone (Onda HNC-1500) controlled by linear stages in a tank. Two transducers are estimated to have Ra of 6.8 and 12.5 cm respectively, and the electrical-to-acoustic conversion efficiencies are about 10%. The conversion efficiency is low for these transducers because they are built for imaging applications rather than power transfer, trading off efficiency for wider bandwidth. As the optimized ηfocus,TX for the FP and GM methods in Fig. 5 has an associated Ra at different frequencies, for 6 cm depth, we can verify ηfocus,TX for FP at the operating frequency of 1.20 MHz for the TX with an Ra of 6.8 cm. For depth of 10 cm, 1.40 MHz is chosen for the TX with an Ra of 12.5 cm to compare to ηfocus,TX obtained from the FP optimization. Fig. 7 shows the measured normalized Iacou along the z axis in castor oil for both TX at 1.20 MHz and 1.40 MHz, respectively. The measurements match well with the analytical solutions near the focusing region, though small deviations are observed in the near field due to the difference in geometry. Fig. 7 also shows that the 3-dB depth of field (DOF) is more than 2 cm, indicating small misalignments in z will not result in large degradation in ηfocus,TX. The measured ηfocus,TX is 3.5% for the transducer with an Ra of 6.8 cm at a depth of 6 cm compared to 4.0% from the analytical solution. For the other transducer, 0.32% is measured at a depth of 10 cm while the calculation from FP gives 0.48%. The measured ηfocus,TXare close to the predicted values but slightly lower because the attenuation in castor oil may be higher than estimated and the pressure sensitivity of the hydrophone, which is reported in water, may change slightly when the hydrophone is used in castor oil. Additionally, we measure w3dB for both transducers, the first transducer has a w3dB of 2.10 mm and the other one has a w3dB of 3.20 mm; they are comparable to 2.06 mm and 2.90 mm from the Field II simulation.
Fig. 7.
Measured (500 μm step size) and calculated normalized Iacou in castor oil for TXs with (a) an Ra of 6.8 cm at 1.20 MHz and (b) an Ra of 12.5 cm at 1.40 MHz.
C. Comparison to Two-Dimensional Arrays
Although spherically focused transducers can be used for power transfer, the lack of flexibility to adjust the focal point in real time can be detrimental when the channel changes, for example, due to implant movements. A ID or 2D phased array, on the other hand, is preferred in practice as it can mitigate this issue by electronically beamforming to different locations to maintain high power transfer efficiency. The beamwidth can also be adjusted to alleviate alignment sensitivity by tuning the phase of each element intelligently [39]. Furthermore, if multiple implants are deployed in the body, a TX array can address and network them simultaneously or by using time division multiplexing [43]. Nonetheless, there are drawbacks when using a TX array. One important example is that the focusing gain of an array is degraded compared to a spherically focused transducer with similar dimensions. This is due to the finite dimension of the array elements, limiting the accuracy of the resulting curvature.
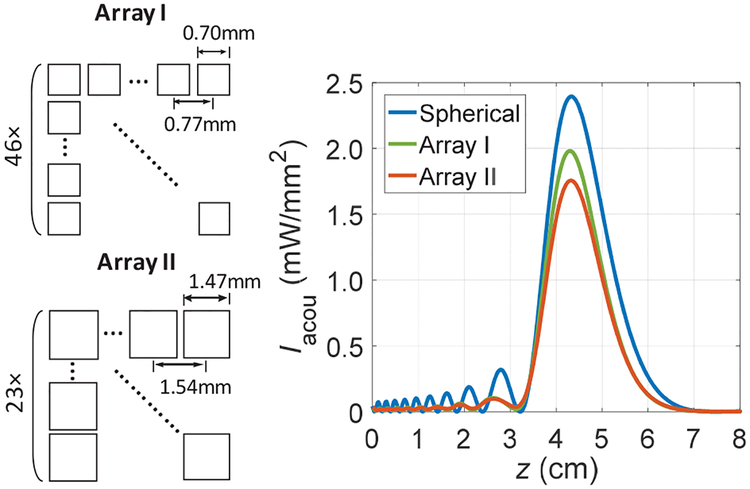
To illustrate, we compare a spherically focused TX with the same parameters used in Fig. 2 (b) to two rectangular 2D arrays without an acoustic lens that have similar areas (~12.6 cm2) in the simulation. The first array (Array I) has 46 elements in each row and column with an element width of 0.7 mm and a pitch of 0.77 mm, which is about half of the wavelength at 1.0 MHz for large steering angle capability; the configuration gives a total area about 12.5 cm2. The second array (Array II) has 23 × 23 elements with an element width of 1.47 mm and a pitch of 1.54 mm. Array II is a more manageable design for fabrication and circuit implementation with the tradeoff of having smaller beamforming angles. Both arrays have their focus set at 4.5 cm so the maximum Iacou of each array can be achieved near the actual focus of the spherical TX.
Fig. 8 shows the simulated Iacou with the same emitted acoustic power along the z axis for three cases. Iacou at the focus for the spherically focused TX is the highest as expected; Array II has slightly lower Iacou than Array I since Array II has fewer controllable elements. Maximum Iacou for both arrays are about 17% and 27% less than the spherically focused TX respectively. Simulated w3dB are 1.88 mm, 1.83 mm, and 1.88 mm for the three scenarios respectively. Therefore, when an RX is at the focus of a US TX, efficiency of the link will be lower when using a 2D array compared to using a spherically focused TX.
Fig. 8.
Illustrations of two arrays (not to scale) and comparisons of Iacou along the z axis for a spherically focused transducer with an a of 2 cm, array I (46 × 46), and array II (23 × 23) in the simulation.
IV. Implant Efficiency with Scaled Receivers
After analyzing the first part of US links, from the external TX focusing down to the RX, we now discuss the efficiency of the implant recovering the incident acoustic power when the RX is scaled down for the purpose of implant miniaturization, ηimplant quantifies the harvesting capability of the US RX and the efficiency of the interface between the RX and the electronics on the implant for a given medical payload. To demonstrate the high power capability of US power delivery, we investigate ηimplant of the implantable optogenetic stimulator described in [24] as an example implant application.
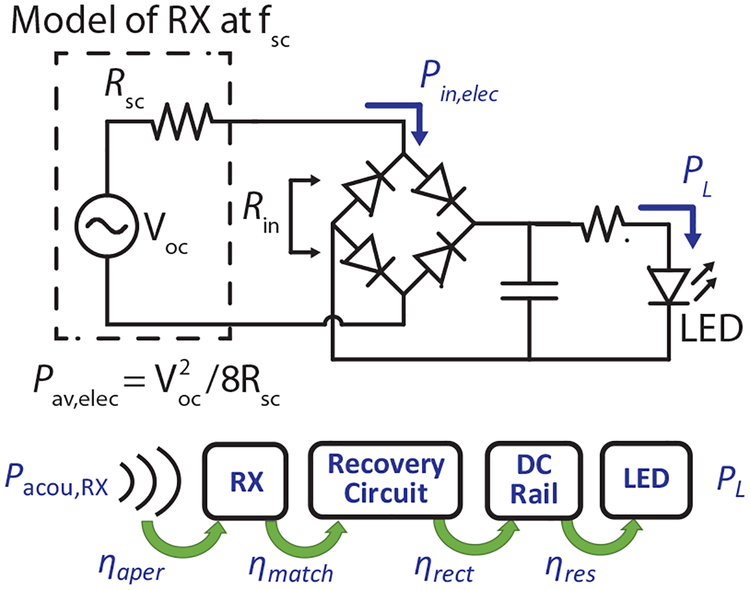
In its simplest form, the power recovery chain of the US-powered optogenetic stimulator includes a US RX made from a piezoelectric material, a full-wave bridge rectifier with Schottky diodes, a capacitor, a current-limiting resistor, and an LED for optical stimulation. Typically, an LED power of 1 to 6 mW is needed to achieve optical intensities of 1 – 1 5 mW/mm2 for effective optogenetic stimulation [45]. The circuit schematic is shown in Fig. 9. The Thévenin equivalent model represents an RX operating at its short-circuit resonance frequency, fsc The model consists of an open-circuit peak voltage, Voc, and a short-circuit resistance, Rsc. The electrical available power of the RX, Pav,elec can be calculated from the received Voc and Rsc.
Fig. 9.
Circuit schematics of a US-powered optogenetic stimulator. The corresponding efficiency terms in (8) are illustrated with the flow diagram.
In the steady state, ηimplant is the product of the aperture efficiency of the RX, ηaper, the effective impedance matching efficiency between the RX and the rectifier, ηmatch, the efficiency of rectifier, ηrect, and the efficiency due to power loss from the current-limiting resistor, ηres. Thus, ηimplant can be written as,
| (8) |
To analyze and optimize ηimplant while scaling down RXs, we first look at the design of RXs for ηaper and the impedance. A ID circuit model is used for first-order analysis and a threedimensional (3D) finite element method (FEM) is utilized for more accurate modeling. Finally, we provide a system-level analysis, focusing on ηmatch, for the optimization of ηimplant.
A. Design and Scaling of Ultrasonic Piezoelectric Receivers
Selections of material and dimensions determine the power harvesting characteristics of the RX made from piezoelectric material. The important metrics for the design are dimensions, resonance frequency, impedance profile, and ηaper. We consider the case when the RX is operated at its fsc since no additional electrical matching network is required to efficiently interface with the power recovery circuit, though it is possible to add a simple capacitive matching network at the interface to tune the operating frequency for further optimization as shown in [30].
Based on the results from section III, it is desirable to position fsc of the RX near 1 to 2 MHz for high power transfer efficiency for deep tissue operation. Using the ID model fsc can be approximated by [30], [35],
| (9) |
where k33 is the electrical-mechanical coupling coefficient, vp is the sound velocity of the piezoelectric material, and t is the thickness of the material. Equation (9) gives a more accurate result when the RX has cross-sectional dimensions much smaller than its thickness such that mechanical stress from the sides of RX is assumed to be zero (i. e. RX is in the expander bar mode) [35], Materials with lower vp and larger k33 are preferable for miniaturization while maintaining low MHz operation. PZT-based materials have been adopted for power harvesting applications previously [7], [22]-[26], but they can result in large fsc when the thickness of the RX is scaled down. As an example, we compare single crystal piezoelectric material, PMN-PT [46], along with PZT4 and PZT5H for a thickness of 0.5 mm. From the material properties in Table II and (9), fsc of all three materials can be computed to be 1.57 MHz, 3.07 MHz, and 2.69 MHz respectively. PMN-PT has the lowest fsc as it has larger k33 and lower vp compared to PZT-based materials. Additionally, fsc of the PMN-PT RX falls in the desirable frequency range so it is clearly a more suitable material to use when the dimension is scaled down.
TABLE II.
| PMN-PT | PZT4 | PZT5H | |
|---|---|---|---|
| Density, ρ (kg/m3) | 8000 | 7500 | 7500 |
| Sound Velocity, vp (m/s) | 3480 | 4100 | 3850 |
| Acoustic Impedance, Zc (MRayls) | 27.8 | 30.8 | 28.9 |
| Electrical-Mechnical Coupling Coefficient, k33 | 0.91 | 0.70 | 0.75 |
| Relative Dielectric Constant, εT33 | 5400 | 1300 | 3400 |
| Calculated fsc for t = 0.5 mm (MHz) | 1.57 | 3.07 | 2.69 |
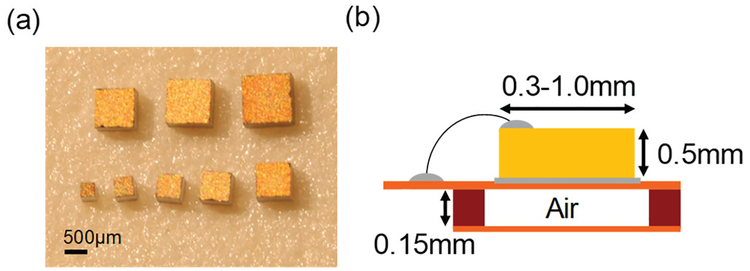
Next, we perform 3D FEM simulation in COMSOL Multiphysics to predict the characteristics of PMN-PT RXs and then verily the results by measurement. In the simulation setup, a block of PMN-PT with thickness of 0.5 mm is instantiated in mineral oil medium using material constants provided by the manufacturer. The width of the block is swept from 0.1 mm to 1.2 mm. An air block is placed underneath the RX to model air backing to increase ηaper [47]. The whole structure is enclosed with a perfectly matched layer, and quarter symmetry is utilized to reduce computation time. To verily the simulations, we dice PMN-PT with widths ranging from 0.3 mm to 1.0 mm with 0.1 mm resolution and package them on a flexible printed circuit board as shown in Fig. 10 (a) and (b). Air backing is created by utilizing a stiffener structure. Impedance and power transfer measurements are both done in the custom-designed tank. In order to eliminate the effect of the attenuation and reduce the electrical loading, the tank is filled with mineral oil to characterize the RXs.
Fig. 10.
(a) Photo of RXs made from PMN-PTs with thickness of 0.5 mm and widths ranging from 0.3 mm to 1.0 mm. (b) Diagram of the measurement package built on flexible PCB. The package is immersed in mineral oil during measurement (modified from [18]).
The simulated and the measured fsc and Rsc of PMN-PT RXs for different widths are plotted in Fig. 11 (a) and (b), respectively. An fsc of 1.54 MHz is obtained for a width of 0.1 mm in simulation, which is close to the value predicted by (9) since the RX with width of 0.1 mm has a rod-like shape. However, (9) does not hold for RXs with larger widths; the down-shift of fsc is observed in simulation and confirmed by measurement. This shift can be explained by the effective reduction of k33 and mode coupling [48]. The measured Rsc lies in the range of 400 – 5000 Ω and monotonically decreases for increasing widths. The measured Rsc closely aligns with the simulated values for widths larger than 0.5 mm, indicating that FEM simulations can be used to design fsc and Rsc of RXs with reasonable accuracy. Small deviations between simulation and measurement, particularly for widths of 0.3 mm and 0.4 mm, are likely due to the effects of packaging surrounding the RXs, which are not completely modeled in simulation. The difference is expected to be more significant as the piezo is scaled down to a few 100 μms.
Fig. 11.
Simulated and measured (a) fsc versus width and (b) Rsc versus width of PMN-PT RXs with thickness of 0.5 mm. (c) Measured ηaper and Pav,elec with Iacou of 1 mW/mm2 [18].
Fig. 11 (c) shows the measured ηaper of PMN-PT RXs at their respective fsc as a function of the width. Measurement of ηaper captures the effect of the packaging and the interaction of the acoustic field. ηaper is defined as,
| (10) |
Pacou,RX can be approximated to be the product of the incident Iacou and ARX when the incoming wave has w3dB larger than the width of the RXs. Increasing ηaper for RX dimensions less than the propagation wavelength, even above 100%, is a well-known phenomenon in antenna and optics theory because RXs can have effective apertures larger than their physical apertures [49], [50]. For devices with widths smaller than 0.5 mm, the measured ηaper do not continue to increase because of losses from the packaging and the material itself. We have also plotted Pav,elec given an Iacou of 1 mW/mm2 in Fig. 11 (c). Pav,elec increases when ARX increases; about 1 mW of Pav,elec is achieved for RXs with larger widths. Interestingly, diminishing returns are found in Pav,elec for widths larger than 0.6 mm, due to the decreasing ηaper.
B. System-Level Analysis of the Optogenetic Stimulator
Besides ηaper of scaled PMN-PT RXs, the rest of the efficiency terms in (8) are also required to calculate ηimplant ηrect and ηres mostly have constant values for the power levels of interest, ηrect is measured to be 80% and ηres is close to 90% [24]. Nonetheless, ηmatch, defined as,
| (11) |
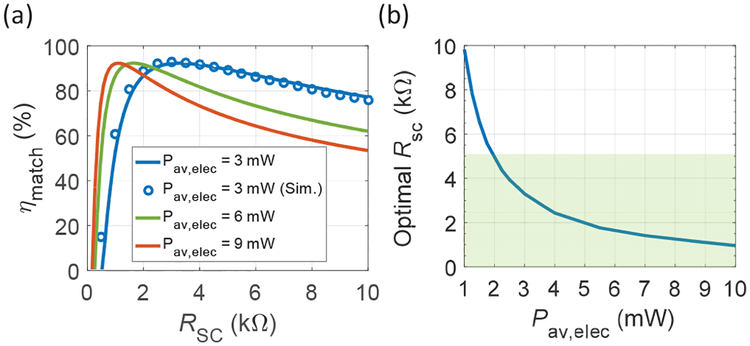
where Pin,elec is the electrical power flowing into the rectifier, is significantly influenced by the Rsc of the RX used; therefore, it requires a careful optimization. Because the rectifier or power harvesting circuit in general is highly non-linear, the effective input impedance, Rin (Fig. 9), can vary greatly with power levels. This limits the use of conventional linear circuit power matching theory. As a result, we numerically solve for ηmatch using a time-averaged power calculation, assuming constant diode drops in the rectifier. Optimal Rsc for different Pav,elec can easily be obtained using this process. Note that the change of fsc from receiver scaling does not impact ηmatch because the effect of input parasitics of the circuit around MHz can be neglected. ηmatch as a function of Rsc is shown in Fig. 12 (a) for a few Pav,elec values; a maximum ηmatch of 92% can be achieved if the RX has an optimal Rsc. ηmatch does not reach 100% due to the non-linear nature of the rectifier. The calculations are verified by SPICE simulations for a Pav,elec of 3 mW, which are also plotted in Fig. 12 (a). For a given Pav,elec, the decrease in ηmatch with large Rsc can be attributed to the decrease in the input voltage due to the voltage division across Rsc and Rin; the rapid drop of ηmatch for smaller Rsc is due to the decrease of Voc, which approaches the diode threshold. Fig. 12 (b) shows the calculated optimal Rsc as a function of Pav,elec from 1 to 10 mW. The shaded region corresponds to the measured Rsc range of PMN-PT RXs reported previously. For Pav,elec from 2 to 10 mW, an RX can be chosen to achieve optimal ηmatch; for Pav,elec less than 2 mW, one can consider using RXs with widths smaller than 0.3 mm, changing thickness of RXs, or operating RXs off resonance with capacitive matching networks as demonstrated in [30].
Fig. 12.
(a) Calculated ηmatch as a function of Rsc at three different Pav,elec. Pav,elec of 3 mW with SPICE simulation matches the calculation, (b) Optimal Rsc for Pav,elec from 1 to 10 mW. The shaded region corresponds to the Rsc of RXs (modified from [18]).
Using the measured Rsc from the results of PMN-PT scaling, the relationship between ηmatch and the width of RXs for three different PL through LED can be derived. As seen in Fig. 13 (a), the RXs with larger widths suffer from low ηmatch for PL lower than 3 mW because their Rsc are smaller than the optimal Rsc. On the other hand, since the RXs with smaller widths have large Rsc, they are not ideal for implants requiring high load powers. Based on the measured Rsc and ηaper and putting together all the efficiency terms in (8), ηimpιant can be computed across widths of RXs. We also perform measurement for a PL of 6 mW with prototype implants that have the RXs connected to the power recovery chain. Both the calculated and measured results are shown in Fig. 13 (b). ηimplant can be larger than 100% due to high ηaper and the trend of ηimplant mainly follows the measured ηaper from Fig. 11 (c). Even though the implant is efficient using RXs with width around 0.4 to 0.6 mm, the required Iacou to deliver large load power to the LED can increase drastically because small RXs are unable to achieve high Pelec,av for a given Iacou.·As seen in Fig. 13 (c), for a PL of 6 mW, the required Iacou rises up significantly for RXs with widths smaller than 0.6 mm which may cause heating concerns. For the larger RXs, required Iacou stays approximately constant even though ηimplant is lower as higher Pelec,av can be obtained due to larger ARX. Taking both ηimplant and the required Iacou into account, it is preferable to use the RXs with widths of approximately 0.6 mm or 0.7 mm in this example for the purpose of miniaturization.
Fig. 13.
(a) Calculated ηmatch versus width for different PL based on the measured Rsc of each RX. (b) Calculated ηimplant and (c) minimum required Iacou versus width for different PL based on the measured Rsc and ηaper of each RX. Measurement for PL of 6 mW is also shown in (b) and (c). For RXs with width of 0.3 mm and 0.4 mm, Iacou required for PL of 6 mW exceeds the limit of the measurement setup; thus, measured data points are omitted. Legends in (a) and (b) apply to all three plots (modified from [18]).
V. Discussion
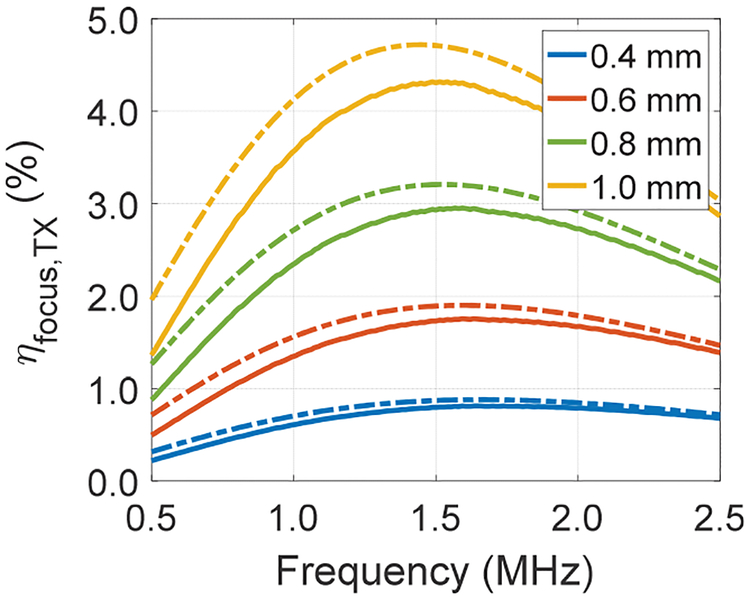
Using the analysis of efficiency for both US TX and US-powered optogenetic stimulators with the scaled RXs, the overall US link efficiency, which is the product of ηfocus,TX and ηimplant, can be computed from (1). To find ηfocus,TXfor different ARX, the FP and GM optimization procedures introduced in section III are used. Fig. 14 shows the calculated ηfocus,TX for the two methods using a spherically focused transducer with an a of 2 cm at 6 cm depth for widths of RXs from 0.4 to 1.0 mm across frequencies. ηfocus,TX for both methods approximately scales with ARX; and fopt is around 1.5 MHz for all widths. This is expected because the beamwidth around fopt is larger than the RX sizes we are considering for miniaturized implants (w3dB ~ 1.6 mm around fopt from Table I). The ratio of ηfocus,TX between GM and FP is 1.09× at 1.5 MHz. Using the corresponding ηfocus,TX for the TX with an a of 2 cm and ηimplant at the respective fsc of RXs from section IV, the end-to-end link efficiency, ηus, can be computed. We assume ηaper of RXs does not change since the beamwidth at the respective fsc of RXs is larger than the widths of RXs. Table III shows an example calculation with a PL of 3 mW at depths of 6 and 10 cm; ηus across widths are also plotted in Fig. 15 for both depths with two optimization methods. The implant with RX width of 0.6 mm has the highest ηUS for both depths. For 6 cm depth, the ratio of ηus across widths between the GM and FP optimizations are 1.1–1.2×; while for 10 cm depth, this increases to 1.5–1.8×. We have also performed measurement at a depth of 6 cm using the transducer with an Ra of 6.8 cm to power up the optogenetic stimulator and compare to the analysis with FP. RX with width of 0.6 mm is selected. By adjusting the input power, a PL of 3 mW is achieved with a Pacou,TX of 168 mW, giving ηUS of 1.79% compared to 1.93% obtained in the calculation. It can be seen from Table III and Fig. 15 that ηUS drops for smaller widths because of lower ηfocus,TX; ηUS also decreases for larger widths due to smaller ηimplant. Note that fsc of some RXs are not necessarily near the fopt from the TX analysis. For instance, fsc of RX with width of 1.0 mm is at 0.86 MHz while fopt is close to 1.5 MHz with a spherically focused TX with an a of 2 cm; ηfocus,TX at these two frequencies for the FP method are 3.06% and 4.31%, which are about 1.4× difference. Therefore, one should intelligently design RX to operate at the fopt of a given TX in order to maximize the total efficiency of the link.
Fig. 14.
Calculated ηfocus,TX for both the FP (solid) and GM (dash) methods using a spherically focused TX with an a of 2 cm across different RX widths at a depth of 6 cm.
TABLE III.
US Link Efficiency for a Load power of 3 mW at the Resonance of RXs Using the with a Circular Aperture size of 2 cm
| fsc (MHz) | ηimplant (%) | ηfocus,TX (%) [FP/GM] | ηUS (%) [FP/GM] | w3dB (mm) calc. | ||||
|---|---|---|---|---|---|---|---|---|
| Width (mm) | 6 cm | 10 cm | 6 cm | 10 cm | 6 cm | 10 cm | ||
| 0.3 | 1.39 | 105 | 0.44 0.49 |
0.046 0.069 |
0.46 0.51 |
0.048 0.073 |
1.65 | 2.75 |
| 0.4 | 1.34 | 161 | 0.76 0.84 |
0.08 0.13 |
1.22 1.35 |
0.13 0.20 |
1.71 | 2.85 |
| 0.5 | 1.20 | 150 | 1.10 1.24 |
0.13 0.20 |
1.65 1.86 |
0.19 0.30 |
1.91 | 3.19 |
| 0.6 | 1.14 | 128 | 1.50 1.71 |
0.18 0.29 |
1.93 2.19 |
0.23 0.38 |
2.01 | 3.36 |
| 0.7 | 1.04 | 96 | 1.88 2.16 |
0.24 0.40 |
1.80 2.07 |
0.23 0.39 |
2.21 | 3.68 |
| 0.8 | 1.01 | 62 | 2.37 2.74 |
0.30 0.52 |
1.47 1.70 |
0.19 0.32 |
2.27 | 3.79 |
| 0.9 | 0.92 | 51 | 2.72 3.18 |
0.36 0.65 |
1.39 1.62 |
0.19 0.33 |
2.49 | 4.16 |
| 1.0 | 0.86 | 43 | 3.08 3.67 |
0.42 0.78 |
1.32 1.58 |
0.18 0.34 |
2.67 | 4.45 |
ηUS are calculated values based on ηimplant and ηfocus,TX.
Fig. 15.
Calculated total US link efficiency, ηus, using (1) for a spherically focused TX with an a of 2 cm across different RX widths at depths of 6 cm and 10 cm. Solid line is optimized with FP and dash line is with GM.
VI. Conclusion
We provide a framework to analyze and optimize the efficiency of US links and design miniaturized US-powered implants. Two optimizations, FP and GM, are discussed for the TX analysis; GM, which allows off-focus operation, has higher efficiency than FP. The increase is more pronounced for large depths and smaller TXs. For both methods, a US TX with a larger aperture is more efficient but comes with a tradeoff of alignment sensitivity; operating frequency of 1 to 2 MHz is identified to be the optimal range for powering up miniaturized implants at depths of interest (> 3 cm). Simulations and measurements are performed to verify the analytical framework. In addition, to investigate the scaling of implants, we demonstrate a co-design methodology for RXs and the power recovery chain. PMN-PT is chosen as the material for RXs since its resonance lies in the derived optimal frequency range when scaled down. System-level analysis for the implant efficiency is presented for the application of optogenetic stimulation; the implant efficiency is shown to be highly dependent on the characteristics of RXs and the interface to power electronics. Finally, we show the total US link efficiency by combining both TX and RX analysis; the implant with RX width of 0.6 mm has the highest total link efficiencies of 1.93% and 0.23% using the spherically focused TX with an a of 2 cm and PL of 3 mW at 6 and 10 cm depths when optimized with FP (GM has 2.19% and 0.38%). The measured link efficiency at 6 cm is 1.79%, comparable to the FP optimization.
The techniques introduced in this paper can be applied to different design parameters, such as sizes of TXs and RXs, piezoelectric materials with biocompatible packaging, types of power recovery circuits, or applications with different required power levels, to accurately estimate and optimize the end-to-end US link efficiency while scaling down US-powered implantable devices to smaller form factors. Future works include extending the framework to study the effect of inhomogeneous tissue, implementing a transmitter array, and characterizing the angular response of RXs.
Acknowledgment
The authors thank Prof. Khuri-Yakub at Stanford University for his insight and valuable discussions.
This work was supported in parts by: the DARPA Young Faculty Award under grant number D14AP00043, the NSF CAREER Award under Grant ECCS-1454107, the NSF Graduate Research Fellowships Program under Grant DGE-114747, NIH NIBIB under award number R01EB025867, and Stanford internal seed funds including SystemX Alliance. The content is solely the responsibility of the authors and does not necessarily represent the official views of the NIH.
References
- [1].Famm K, Litt B, Tracey KJ, Boyden ES, and Slaoui M, “Drug discovery: Ajump-start for electroceuticals,” Nature, vol. 496, no. 7444, pp. 159–61, Apr. 2013. [DOI] [PMC free article] [PubMed] [Google Scholar]
- [2].Andreu-Perez J, Leff DR, Ip HMD, and Yang GZ, “From Wearable Sensors to Smart Implants-Toward Pervasive and Personalized Healthcare,” IEEE Trans. Biomed. Eng, vol. 62, no. 12, pp. 2750–2762, 2015. [DOI] [PubMed] [Google Scholar]
- [3].Chen LY et al. , “Continuous wireless pressure monitoring and mapping with ultra-small passive sensors for health monitoring and critical care,” Nat. Commun, vol. 5, pp. 1–10, 2014. [DOI] [PubMed] [Google Scholar]
- [4].Brinton M et al. , “Electronic enhancement of tear secretion,” J. Neural Eng, vol. 13, no. 1, 2015. [DOI] [PMC free article] [PubMed] [Google Scholar]
- [5].Rabaey JM et al. , “Powering and communicating with mm-size implants,” in 2011 Design, Automation & Test in Europe, 2011, pp. 1–6. [Google Scholar]
- [6].Ho JS et al. , “Wireless power transfer to deep-tissue microimplants,” Proc. Natl. Acad. Sci. U. S. A, vol. 111, no. 22, pp. 7974–7979, Jun. 2014. [DOI] [PMC free article] [PubMed] [Google Scholar]
- [7].Charthad J, Weber MJ, Chang TC, and Arbabian A, “A mm-Sized Implantable Medical Device (IMD) With Ultrasonic Power Transfer and a Hybrid Bi-Directional Data Link,” IEEE J. Solid-State Circuits, vol. 50, no. 8, pp. 1741–1753, Aug. 2015. [Google Scholar]
- [8].Cheng Y, Wang G, and Ghovanloo M, “Analytical Modeling and Optimization of Small Solenoid Coils for Millimeter-Sized Biomedical Implants,” IEEE Trans. Microw. Theory Tech, vol. 65, no. 3, pp. 1024–1035, 2017. [Google Scholar]
- [9].Jow U and Ghovanloo M, “Design and Optimization of Printed Spiral Coils for Efficient Transcutaneous Inductive Power Transmission,” IEEE Trans. Biomed. Circuits Syst, vol. 1, no. 3, pp. 193–202, 2007. [DOI] [PubMed] [Google Scholar]
- [10].Aldaoud A, Laurenson C, Rivet F, Yuce MR, and Redoute JM, “Design of a miniaturized wireless blood pressure sensing interface using capacitive coupling,” IEEE/ASME Trans. Mechatronics, vol. 20, no. 1, pp. 487–491, 2015. [Google Scholar]
- [11].Liu C, Guo YX, Sun H, and Xiao S, “Design and Safety Considerations of an Implantable Rectenna for Far-Field Wireless Power Transfer,” IEEE Trans. AntennasPropag, vol. 62, no. 11, pp. 5798–5806, 2014. [Google Scholar]
- [12].Mujeeb-U-Rahman M, Adalian D, Chang CF, and Scherer A, “Optical power transfer and communication methods for wireless implantable sensing platforms,” J. Biomed. Opt, vol. 20, no. 9, p. 95012, 2015. [DOI] [PubMed] [Google Scholar]
- [13].Denisov A and Yeatman E, “Ultrasonic vs. inductive power delivery for miniature biomedical implants,” 2010 Int. Conf. Body Sens. Networks, BSN 2010, pp. 84–89, 2010. [Google Scholar]
- [14].Shahab S and Erturk A, “Contactless ultrasonic energy transfer for wireless systems: acoustic-piezoelectric structure interaction modeling and performance enhancement,” Smart Mater. Struct, vol. 23, no. 12, p. 125032, 2014. [Google Scholar]
- [15].Ozeri S and Shmilovitz D, “Ultrasonic transcutaneous energy transfer for powering implanted devices.,” Ultrasonics, vol. 50, no. 6, pp. 556–66, May 2010. [DOI] [PubMed] [Google Scholar]
- [16].Mazzilli F, Lafon C, and Dehollain C, “A 10.5 cm ultrasound link for deep implanted medical devices,” IEEE Trans. Biomed. Circuits Syst, vol. 8, no. 5, pp. 738–750, Oct. 2014. [DOI] [PubMed] [Google Scholar]
- [17].Meng M and Kiani M, “Design and Optimization of Ultrasonic Wireless Power Transmission Links for Millimeter-Sized Biomedical Implants,” IEEE Trans. Biomed. Circuits Syst, vol. 11, no. 1, pp. 98–107, Feb. 2017. [DOI] [PubMed] [Google Scholar]
- [18].Chang TC, Weber MJ, Charthad J, Baltsavias S, and Arbabian A, “Scaling of Ultrasound-Powered Receivers for Sub-millimeter Wireless Implants,” in IEEE Biomedical Circuits and Systems Conference (BioCAS), 2017, pp. 1–4.30406220 [Google Scholar]
- [19].Gelat P, TerHaar G, and Saffari N, “The optimization of acoustic fields for ablative therapies of tumours in the upper abdomen,” Phys Med Biol, vol. 57, no. 24, pp. 8471–8497, Dec. 2012. [DOI] [PubMed] [Google Scholar]
- [20].Goss SA, Johnston RL, and Dunn F, “Comprehensive compilation of empirical ultrasonic properties of mammalian tissues,” J. Acoust. Soc. Am, vol. 64, no. 2, pp. 423–457, Aug. 1978. [DOI] [PubMed] [Google Scholar]
- [21].“Information for Manufacturers Seeking Marketing Clearance of Diagnostic Ultrasound Systems and Transducers,” Center for Devices and Radiological Health, U.S. FDA, Rockville, MD, 2008. [Google Scholar]
- [22].Weber MJ, Yoshihara Y, Sawaby A, Charthad J, Chang TC, and Arbabian A, “A Miniaturized Single-Transducer Implantable Pressure Sensor With Time-Multiplexed Ultrasonic Data and Power Links,” IEEE J. Solid-State Circuits, vol. 53, no. 4, pp. 1089–1101, 2018. [Google Scholar]
- [23].Chang TC, Wang ML, Charthad J, Weber MJ, and Arbabian A, “A 30.5mm3 Fully Packaged Implantable Device with Duplex Ultrasonic Data and Power Links Achieving 95kb/s with <10−4 BER at 8.5cm Depth,” in IEEE Int. Solid-State Circuits Conf. (ISSCC) Dig. Tech. Papers, 2017, pp. 460–462. [Google Scholar]
- [24].Weber MJ, Bhat A, Chang TC, Charthad J, and Arbabian A, “A Miniaturized Ultrasonically Powered Programmable Optogenetic Stimulator System,” in IEEE Topical Conf. Biomedical Wireless Technology, Networks, Sensing System, 2016, pp. 12–14. [Google Scholar]
- [25].Seo D et al. , “Wireless Recording in the Peripheral Nervous System with Ultrasonic Neural Dust Neuron NeuroResource Wireless Recording in the Peripheral Nervous System with Ultrasonic Neural Dust,” Neuron, vol. 91, no. 3, pp. 1–11, Aug. 2016. [DOI] [PubMed] [Google Scholar]
- [26].Zhou J, Kim A, Song SH, and Ziaie B, “An ultrasonically powered implantable micro-light source for localized photodynamic therapy,” 2015 Transducers - 2015 18th Int. Conf. Solid-State Sensors, Actuators Microsystems, TRANSDUCERS 2015, pp. 876–879, 2015. [Google Scholar]
- [27].Charthad J et al. , “A mm-sized wireless implantable device for electrical stimulation of peripheral nerves,” IEEE Trans. Biomed. Circuits Syst, vol. 12, no. 2, pp. 257–270, 2018. [DOI] [PubMed] [Google Scholar]
- [28].Lawry TJ, Wilt KR, Scarton HA, and Saulnier GJ, “Analytical modeling of a sandwiched plate piezoelectric transformer-based acoustic-electric transmission channel,” IEEE Trans. Ultrason. Ferroelectr. Freq. Control, vol. 59, no. 11, pp. 2476–2486, 2012. [DOI] [PubMed] [Google Scholar]
- [29].Kim S, Ho JS, and Poon ASY, “Wireless Power Transfer to Miniature Implants: Transmitter Optimization,” IEEE Trans. Antennas Propag, vol. 60, no. 10, pp. 4838–4845, 2012. [Google Scholar]
- [30].Chang TC, Weber MJ, Wang ML, Charthad J, Khuri-yakub BT, and Arbabian A, “Design of Tunable Ultrasonic Receivers for Efficient Powering of Implantable Medical Devices with Reconfigurable Power Loads,” IEEE Trans. Ultrason. Ferroelectr. Freq. Control, vol. 63, no. 10, pp. 1554–1562, Oct. 2016. [DOI] [PubMed] [Google Scholar]
- [31].Fleury G, Berriet R, LeBaron O, Huguenin B, and France I, “New piezocomposite transducers for therapeutic ultrasound,” SPIE, vol. 4954, pp. 227–235, 2003. [Google Scholar]
- [32].“H-Transducer Series,” Sonic Concepts, Woodenville, WA. [Google Scholar]
- [33].Wygant IO et al. , “An integrated circuit with transmit beamforming flip-chip bonded to a 2-D CMUT array for 3-D ultrasound imaging,” IEEE Trans. Ultrason. Ferroelectr. Freq. Control, vol. 56, no. 10, pp. 21452156, 2009. [DOI] [PubMed] [Google Scholar]
- [34].El-Desouki MM and Hynynen K, “Driving circuitry for focused ultrasound noninvasive surgery and drug delivery applications,” Sensors, vol. 11, no. 1 pp. 539–556, 2011. [DOI] [PMC free article] [PubMed] [Google Scholar]
- [35].Kino GS, Sound Wave Propagation. Englewood Cliffs, NJ, USA: Prentice-Hall, 1987. [Google Scholar]
- [36].Szabo TL, “Diagnostic Ultrasound Imaging: Inside Out,” Diagnostic Ultrasound Imaging: Inside Out, vol. 787 pp. 735–763, 2014. [Google Scholar]
- [37].Jensen JA, “FIELD: A Program for Simulating Ultrasound Systems,” Med. Biol. Eng. Comput, vol. 34, no. SUPPL. 1, pp. 351–352, 1996.8945858 [Google Scholar]
- [38].Jensen JA and Svendsen NB, “Calculation of Pressure Fields from Arbitrarily Shaped, Apodized, and Excited Ultrasound Transducers,” IEEE Trans. Ultrason. Ferroelectr. Freq. Control, vol. 39, no. 2, pp. 262—267, 1992. [DOI] [PubMed] [Google Scholar]
- [39].Smith SW, Pavy HG, and vonRamm OT, “High-Speed Ultrasound Volumetric Imaging System—Part I: Transducer Design and Beam Steering,” IEEE Trans. Ultrason. Ferroelectr. Freq. Control, vol. 38, no. 2, pp. 100–108, 1991. [DOI] [PubMed] [Google Scholar]
- [40].Kossoff G, “Analysis of focusing action of spherically curved transducers,” Ultrasound Med. Biol, vol. 5, no. 4, pp. 359–365, 1979. [DOI] [PubMed] [Google Scholar]
- [41].Huang JH and Ding D, “A simple approximate formula for the physical focal length of spherically focused transducers,” IEEE Trans. Ultrason. Ferroelectr. Freq. Control, vol. 56, no. 12, pp. 2764–2768, 2009. [DOI] [PubMed] [Google Scholar]
- [42].Goldstein A, “Steady State Spherically Focused, Circular Aperture Beam Patterns,” Ultrasound Med. Biol, vol. 32, no. 10, pp. 1441–1458, Jun. 2006. [DOI] [PubMed] [Google Scholar]
- [43].Wang M, Chang TC, Teisberg T, Weber M, Charthad J, and Arbabian A, “Closed-loop ultrasonic power and communication with multiple miniaturized active implantable medical devices,” 2017 IEEE Int. Ultrason. Symp, pp. 7–10, 2017. [Google Scholar]
- [44].Lerch TP, Schmerr LW, and Sedov A, “Characterization of spherically focused transducers using an ultrasonic measurement model approach,” Res. Nondestruct. Eval, vol. 8, no. 1, pp. 1–21, 1996. [Google Scholar]
- [45].Liske H, Qian X, Anikeeva P, Deisseroth K, and Delp S, “Optical control of neuronal excitation and inhibition using a single opsin protein, ChR2,” Sci. Rep, vol. 3, pp. 2–8, 2013. [DOI] [PMC free article] [PubMed] [Google Scholar]
- [46].“TRS X2B Material Constants,” TRS Technologies, State College, PA. [Google Scholar]
- [47].Kossoff G, “The Effects of Backing and Matching on the Performance of Piezoelectric Ceramic Transducers,” IEEE Trans. Sonics Ultrason, vol. 13, no. 1, pp. 20–30, 1966. [Google Scholar]
- [48].Kunkel HA, Locke S, and Pikeroen B, “Finite-Element Analysis of Vibrational Modes in Piezoelectric Ceramic Disks,” IEEE Trans. Ultrason. Ferroelectr. Freq. Control, vol. 37, no. 4, pp. 316–328, Jul. 1990. [DOI] [PubMed] [Google Scholar]
- [49].Balanis CA, Antenna Theory: Analysis and Design, 3rd ed. Hoboken, NJ: Wiley, 2005. [Google Scholar]
- [50].Zumofen G, Mojarad NM, Sandoghdar V, and Agio M, “Perfect reflection of light by an oscillating dipole,” Phys. Rev. Lett, vol. 101, no. 18, pp. 1–4, 2008. [DOI] [PubMed] [Google Scholar]


