Abstract
Purpose
Renal fibrosis is a hallmark of progressive renal disease; however, current clinical tests are insufficient for assessing renal fibrosis. Here we evaluated the utility of quantitative magnetization transfer (qMT) MRI in detecting renal fibrosis in a murine model of progressive diabetic nephropathy (DN).
Methods
The db/db eNOS−/− mice, a well-recognized model of progressive DN, and normal wild type (WT) mice were imaged at 7T. The qMT data were collected in coronal plane using a 2D MT prepared spoiled gradient echo sequence with a Gaussian-shaped presaturation pulse. Parameters were derived using a two-pool fitting model. A normal range of cortical pool size ratio (PSR) was defined as Mean ± 2SD of WT kidneys (N=20). The cortical regions whose PSR values exceeded this threshold (threshold PSR, tPSR) were assessed. The correlations between the PSR-based and histological (collagen IV or picrosirius red stain) fibrosis measurements were evaluated.
Results
Compared with WT mice, moderate increases in mean PSR (mPSR) values and scattered clusters of high PSR region were observed in cortex of DN mouse kidneys. Abnormally high PSR regions (% area) that were detected by the tPSR were significantly increased in renal cortexes of DN mice. These regions progressively increased on aging and highly correlated with histological fibrosis measures, while the mPSR values correlated much less.
Conclusion
Renal fibrosis in DN can be assessed by the qMT MRI and threshold analysis. This technique may be used as a novel imaging biomarker for DN and other renal diseases.
Keywords: MRI, quantitative magnetization transfer (qMT), pool size ratio (PSR), magnetization transfer ratio (MTR), renal fibrosis, diabetic nephropathy
INTRODUCTION
Diabetic nephropathy (DN) is a major diabetic complication that determines the morbidity and mortality of diabetic patients. However, currently available clinical tests and biomarkers do not reliably assess its severity and progression in individual patients [1, 2], making it difficult to target treatments to poor prognosis patients. Renal fibrosis is a hallmark of progressive kidney disease, including DN; therefore, it is critical to evaluate the presence and extent of fibrosis in the diabetic kidney to treat patients as well as to predict their long-term outcomes. However, current urine and blood markers do not allow quantitative and spatial assessment of renal fibrosis. Renal biopsy can diagnose fibrosis; however, it is invasive and prone to sampling errors, making it difficult to repetitively and reliably evaluate renal fibrosis in the affected kidney. Thus, a non-invasive test that better assesses renal fibrosis would greatly improve the assessment and treatment of DN.
In vivo MRI techniques are important tools for evaluating the functional, structural, and molecular or metabolic integrity of the compromised kidney in a wide variety of renal pathologies [3–5]. Furthermore, the application of non-invasive imaging methods to mouse models permits serial evaluation of disease progression and enables longitudinal and spatial investigation of the pathological processes of renal disease [6–8]. During the past decade, several MRI methods have been applied to the assessment of renal fibrosis. These include diffusion-weighted MRI (DWI), blood oxygenation level dependent (BOLD) MRI, and MR elastography (MRE) [9–13]. These techniques have shown potential for detecting renal fibrosis but also have limitations. DWI measures variations in the Brownian motion of water molecules in tissues and is sensitive to changes in microcirculation and tubular flow as well as several microstructural factors; therefore, its changes do not specifically reflect renal fibrosis [14]. In addition, its sensitivity seems not to be superior to a conventional indicator (eGFR) of renal function [9, 15]. MRE-determined medullary stiffness was shown to correlate with the degree of fibrosis in a renal artery stenosis model [12]. However, it failed to detect fibrosis in renal cortex when decreases in renal blood flow mask the increases in intrinsic stiffness of renal cortex due to fibrosis. Thus, an alternative approach needs to be developed to better assess renal fibrosis.
Magnetization transfer (MT) is the spin exchange between proton pools in different environments and can be used to evaluate macromolecular content of tissue [16, 17]. There are two main approaches to measure MT effects: semi-quantitative MT ratio (MTR) and quantitative MT (qMT) methods. To date, simpler metrics such as MTR [18] have been the most commonly used MT method to assess changes in macromolecular composition in neurological disorders [19, 20], neuromuscular diseases [21], spinal cord injury [22], liver fibrosis [23], cancer [24], and renal apoptosis and fibrosis [6, 25–27]. However, the sensitivity, specificity and reproducibility of MTR measures can be influenced by various experimental parameters and field strength [28, 29]. Moreover, MTR measures tend to reflect a complex combination of sequence details and relaxation parameters [29, 30]. It is well known that MTR is confounded by many factors [28–30]. To increase the specificity and sensitivity, qMT methods have been developed to extract quantitative parameters based on biophysical models, and to isolate the pool size ratio (PSR, the ratio of the macromolecular proton pool to the free water pool) from relaxation rates and exchange rates [31–35]. Previous works have demonstrated that PSR is independent versus tissue relaxations and field strength [31–34].
While the qMT MRI technique provides a more specific measure, as compared to MTR, of the pathological events that are associated with changes of macromolecular composition, such as fibrosis or apoptosis [35], it is rarely applied to kidney diseases, including DN. Therefore, here we evaluate the utility of qMT imaging for measuring renal fibrosis in diabetic kidney using a mouse model of progressive DN. A reduction in endothelial nitric oxide synthase (eNOS) has been shown to be associated with advanced DN in humans [36]. Furthermore, recent studies have shown that this effect can be recapitulated in mice [37]. The db/db mice that lack the eNOS gene (db/db eNOS−/− mice) have been shown to exhibit advanced DN that accompanies renal fibrosis similar to that found in human DN [38, 39].
In the present study, we evaluated the utility of qMT in assessing renal fibrosis in diabetic mouse (db/db eNOS−/−) kidneys by employing a pulsed saturation qMT data acquisition and the simplified Henkelman-Ramani model for analysis [28, 40]. With the observed spin-lattice relaxation rate R1obs measured separately, PSR was separated from relaxation rates and exchange rates through the model fitting. Our data demonstrate that the percentage of renal area that exhibits abnormally high PSR values is well correlated with a histological fibrosis index, indicating that qMT could be used for detecting and quantifying renal fibrosis in DN.
METHODS
Animals
The eNOS-deficient db/db mice (db/db eNOS−/−, 15–17 weeks, 38–54 g, 12 kidneys; db/db eNOS−/−, 22–24 weeks, 50–58 g, 12 kidneys) were prepared as described previously [38]. Wild-type mice (WT, 9 weeks, 19–24 g, 20 kidneys; WT, 15–17 weeks, 28–31 g, 6 kidneys; WT, 22–24 weeks, 30–32 g, 6 kidneys) with C57BLKS background and non-fibrotic db/db mice (db/db, 15–17 weeks, 48–53 g, 6 kidneys) were purchased from the Jackson Laboratory (Bar Harbor, ME, US). All animal procedures were approved by the Institutional Animal Care and Use Committee (IACUC) at Vanderbilt University.
MRI
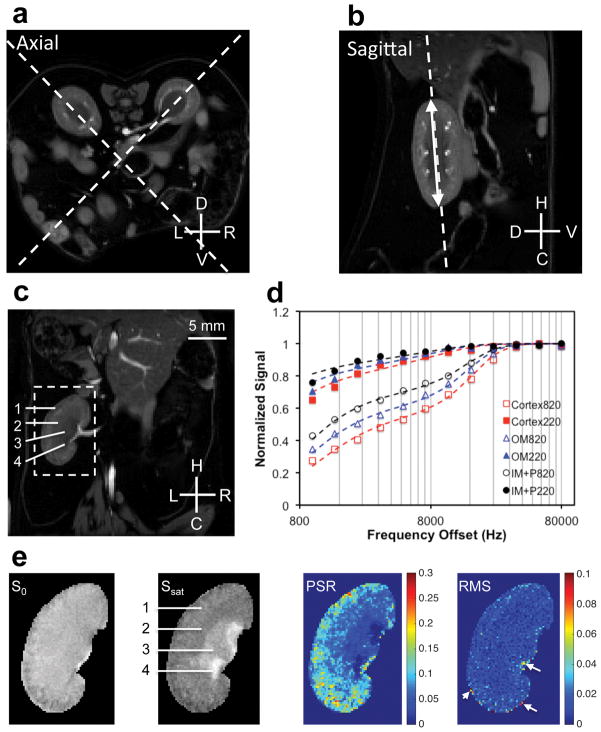
All MR images were acquired on a 16-cm bore Varian horizontal 7T magnet, using a Doty 38-mm inner diameter transceiver coil. Anesthesia was induced and maintained with a 1.5%/98.5% isoflurane/oxygen mixture, and a constant body temperature of 37.5 °C was maintained. The structural imaging protocols used a field-of-view (FOV) of 34×34 mm2. For kidney segmentation, water images (Fig. 1a–c) were obtained based on 3-point Dixon reconstruction (gradient echo sequence, TR = 45 ms, flip angle = 35°, multiple TEs were around 4, 4.5 and 5ms, resolution 0.177 × 0.177 × 1 mm3). Observed relaxation rate R1obs was obtained with two low flip angles (15° and 30°). A fast spin-echo sequence (TR = 5500 ms, TE = 42 ms, RARE-factor = 4, resolution = 0.177 × 0.177 × 1 mm3) was used to achieve T2 contrast. B1 and B0 maps (Sup. Fig. S1) were obtained based on the images acquired with two flip angles (40° and 80°) and two echo times (ΔTE = 2 ms) respectively.
Figure 1. MRI data acquisition of mouse kidney for histological comparison.
(a–b) Examples showing the selection of coronal plane for qMT data acquisition. The coronal orientation allows the comparison between MRI and histological results. Dashed lines indicate the selected orientations on axial or sagittal images for qMT data acquisition. The double-headed arrow indicates the longitudinal length of kidney. L: left; R: right; D: dorsal; V: ventral; H: head; C: caudal. The axial and sagittal images are the water images from 3-point Dixon construction, and these images highlight kidneys in diabetic mice. (c) The selected water coronal image from 3-point Dixon reconstruction. 1-cortex, 2-outer medulla (OM), 3-inner medulla and papilla (IM+P), 4-extra renal space. (d) The example fitting of the model to regional MT data in kidney at two flip angles of θsat 220° and θsat 820°. (e) Segmented images zoomed on the left kidney without MT saturation (S0) and with MT saturation (Ssat) at θsat 820° and 5000 Hz RF offset, pool size ratio (PSR) map, and root mean squares of the residuals (RMS) from model fitting. Example shows DN (db/db eNOS−/−) mouse kidneys. The arrows indicate pixels with RMS larger than 0.05.
To ensure that the same areas (planes) were sampled for quantitative measures of non-invasive MRI and histological sections, the qMT data were collected separately for left and right kidneys at the middle coronal plane (Fig. 1a–c). This orientation of kidney made it easier to examine the same area on histologic sections. We used both axial and sagittal anatomical images (Fig. 1a–b) to determine the identical coronal slice (Fig. 1c). The qMT data were collected using a 2D MT-weighted spoiled gradient echo sequence (TR 24 ms, flip angle =7°, matrix size 256×256, 24 acquisitions, resoltuion = ~0.133×0.133×1 mm3). Gaussian-shaped saturation pulses (θsat = 220° and 820°, pulse width = 10 ms) were used. The first data set was collected with 12 different RF offsets and a constant logrithmic interval ranged between 1 and 80 kHz for general quality of regional MT spectra in the kidney (Fig. 1d). Numerical simulations [40] were performed (Sup. Fig. S2) to test modeling performance for different number of RF offsets and signal to noise ratios (SNR). Due to the motion artifacts in mouse kidney imaging, we acquired at least 7 RF offsets ranging between 1 and 80 kHz at two saturation powers to ensure more accurate modeling and derivation of qMT parameters (which required ~34 min of imaging time).
Histology
Histological examinations of renal fibrosis were carried out following MRI. Mice were euthanized and paraffin sections (coronal plane) of the median 50% portion of each kidney were processed for comparison with MRI results. For collagen IV staining, paraffin sections were placed on the Bond Max immunohistochemistry (IHC) stainer (Leica Biosystems, IL, US). Antibodies against primary collagen IV (Abcam plc., Cambridge, UK) [41] diluted 1:600 were applied to sections and incubated for one hour. The Bond Refine Polymer detection system (Leica Biosystems) was used for visualization. Collagens, mainly collagen I and III, were stained with the picrosirius red stain kit (Polysciences Inc., PA, US) according to the manufacturers’ protocol [42].
Data analysis
All MRI data were analyzed using MATLAB (The Mathworks, Natick, MA, US). All intra-session images used in quantification were co-registered using a rigid registration algorithm based on mutual information [43]. R1obs was calculated using the B1 corrected dual-angle approach [44].
Figure 1d compares the representative normalized signals obtained from voxels in cortex, outer medulla (OM), and inner medulla and papilla (IM+P) of the kidney at different MT saturation powers (θsat = 220° and 820°) and frequency offsets. Henkelman-Ramani’s model was applied to derive qMT parameters [28, 40].
| (1) |
where a and b denote the free water pool and macromolecular pool, respectively. F is the relative size of the macromolecular pool, defined as F=M0b/M0a. M0a and M0b are the fully relaxed values of magnetization associated with the two pools, and M0 is the signal without MT-weighting. The continuous wave power approximation (CWPE) was applied and ω1CWPE is the amplitude of the saturating field [28, 40]. Δf represents the frequency offset of the MT pulse. RRFB is the rate of saturation of longitudinal magnetization in pool b [40]. T2a is the transverse time of free water pool. R is the exchange rate constant. Ra and Rb are the respective longitudinal relaxation rates. Additional constraints were imposed to determine the qMT parameters. Rb was kept fixed at 1 s−1 as usual [28, 31, 40]. Another constraint was imposed by measuring the observed longitudinal relaxation rate R1obs independently, which was linked to Ra [31].
| (2) |
M0, F, RM0b, T2a and T2b were determined from the model fitting. The PSR was defined as the “F” value from the fitting. The fitting quality at each pixel was evaluated by the root mean squares (RMS) of the residuals at each RF offset. The corresponding PSR and RMS maps and selected images with MT contrast (MTC) are shown in Figure 1e. The MTR was defined as
| (3) |
where S0 and Ssat were the signal without and with MT saturation respectively. MTR was mainly quantified with MT saturation Ssat at θsat = 820° and RF offset 5000 Hz for comparison.
T1-weighted, T2-weighted and MTC images were used for manual selection [45] of ROIs (regions of interests) such as cortex, OM, IM+P, and extra-renal space for quantification (Sup. Fig. S3). It is often challenging to distinguish cortex and outer stripe of outer medulla (OSOM) from MR images (Sup. Fig. S3) [35]. Therefore, in this work, the defined cortical region included both renal cortex and OSOM, and OM region included only inner stripe of outer medulla (ISOM). To minimize partial volume effects, small ROIs were selected and voxels residing along the regional edges were excluded. The regions with fibrosis were identified according to their high PSR values. The normal PSR range was defined as Mean ± 2SD (standard deviation, 95%) of normal WT mouse kidneys, and the regions with significantly higher PSR were defined as voxels whose PSR were out of this normal range. Regions with the PSR higher than different thresholds, Mean+2SD, Mean+3SD, or Mean+4SD, were detected and percent areas of those regions in the cortex were calculated. The positive area that exceeds the threshold PSR (tPSR) was quantified as
| (4) |
For histological fibrosis indexes, the stained slides were digitized (SCN400 slide scanner, Leica Biosystems) and viewed using Slidepath Digital Image Hub V4.0.6 (Leica Biosystems) [46]. The cortical area that includes cortex and OSOM were manually defined. The picrosirius red- and collagen IV-positive areas in cortex were computationally measured using Slidepath Tissue Image Analysis with unified threshold respectively (picrosirius red: tissue intensity=200 and deconvolution=100; collagen IV: tissue intensity=210 and deconvolution=200). The regional fibrosis index was estimated by the area percentage of the positive pixels (dark brown and red regions in collagen IV and picrosirius red stains respectively). Analyses were performed for 6 – 7 sections in each kidney.
| (5) |
| (6) |
In histological sections, kidney deformation, tissue shrinking, and tissue damage could impact assessments of the fibrosis levels in IM+P and OM regions of the kidney. Therefore, we evaluated histological fibrosis indexes only in cortex plus OSOM (hereafter referred to as cortex) for comparison. The correlations between tPSR-detected area (%) and histological fibrosis indexes were evaluated across kidneys, using the Pearson correlation function. The significance of differences between two groups was evaluated using Student’s t-tests. P < 0.05 was considered as statistically significant.
RESULTS
MRI features of normal mouse kidney
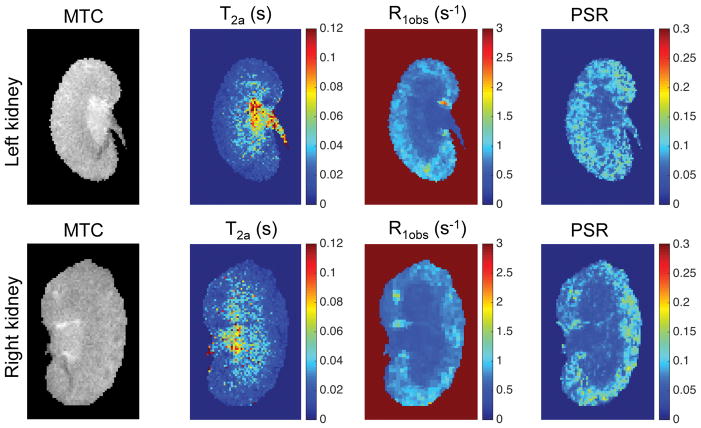
In normal WT mice, IM+P exhibited higher MT contrast than cortex and OM (Fig. 2). The cortex showed significantly higher PSR, higher R1obs and lower T2a values than medulla and papilla in WT mouse kidneys. However, cortex showed quite similar MTR as medulla (Sup. Fig. S4). Table 1 summarizes the averaged regional MRI parameters of cortex, OM and IM+P across 9-week-old WT kidneys. Except T2b, other parameters PSR, R1obs, T2a and RM0b showed significant regional differences in mouse kidney (Table 1). In contrast, no significant difference of MTR was observed between cortex and medulla in WT mouse kidney (Table 1), which is in agreement with previous observation in MTR measures of murine kidneys [6, 27].
Figure 2. In vivo MRI parametric maps of normal WT mouse kidney.
Representative results of 9 week-old WT mouse are shown.
Table 1.
In vivo MRI measures across normal WT kidneys
| Parameter | MTR | PSR | T2a (ms) | T2b (μs) | RM0b (s−1) | R1obs (s−1) | |
|---|---|---|---|---|---|---|---|
| Cortex | Mean | 0.488 | 0.093 | 19.780 | 8.620 | 1.280 | 0.726 |
| SD | 0.018 | 0.007 | 4.891 | 0.837 | 0.291 | 0.051 | |
| OM | Mean | 0.477 | 0.074* | 30.640* | 8.670 | 1.027* | 0.630* |
| SD | 0.019 | 0.009 | 5.201 | 1.036 | 0.271 | 0.047 | |
| IM +P | Mean | 0.416* | 0.054* | 55.274* | 9.254 | 0.667* | 0.538* |
| SD | 0.050 | 0.009 | 14.163 | 1.271 | 0.281 | 0.051 | |
Note: Mean and SD are the averaged values and standard deviations across 9-week kidneys (N=20). MTR was calculated with MT saturation Ssat at θsat = 820° and RF offset 5000 Hz.
P <0.05 versus corresponding parameters in cortex.
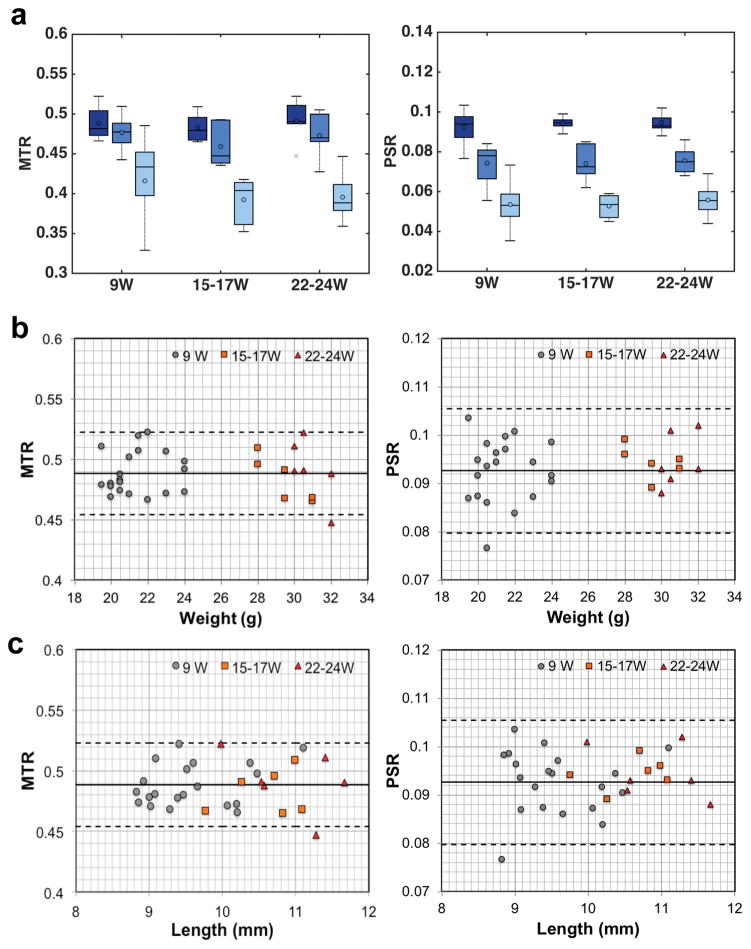
WT mice at 15–17 and 22–24 weeks showed quite similar regional PSR and MTR measures as 9-week-old WT mice (Fig. 3a). In the cortical regions, no significant difference in PSR or MTR was observed with the increase of body weight of WT mice or size of kidneys from 9 to 24 weeks (Fig. 3b–c). Therefore, we used 9 week-old mice to establish the standard PSR values.
Figure 3. Changes of regional MTR and PSR with age, weight, and kidney size of normal mouse.
(a) Comparison of boxcar plots of averaged regional MTR and PSR in WT mouse kidneys. 9W: 9-week old WT mice (N=20); 15–17W: 15–17 week-old WT mice (N=6); 22–24W: 22–24 week-old WT mice (N=6). Cortex in the darkest color, OM in darker color, and IM+P regions in light color. The central lines and circles of the boxplots represent the medians and means respectively, and the box limits present the 25th and 75th percentiles. Crosses indicate outliers. (b–c) Changes of cortical MTR and PSR versus weight of mouse and kidney size (in length). Solid lines represent the mean cortical values, whereas the dashed lines are 95% limits of the agreement (mean±1.96SD) for 9-week WT kidneys.
MRI features in progressive murine DN
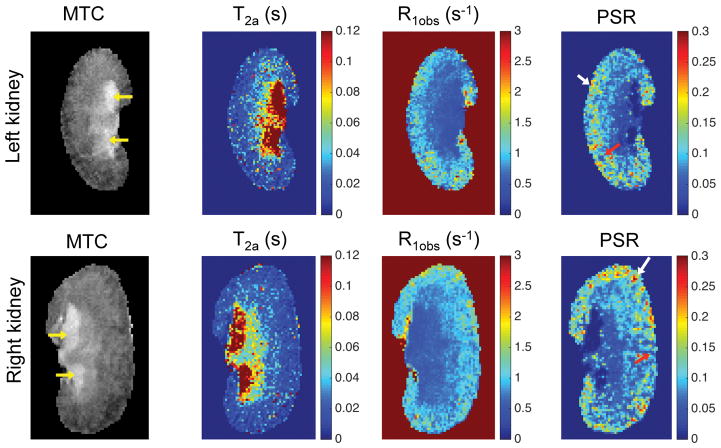
In DN (db/db eNOS−/−) mice, the contrast on the derived parametric maps was highly dissimilar from that found in normal mice, consistent with the associated pathological changes (Fig. 4). The extra-renal spaces exhibited hyperintensity and were clearly detected in MTC images (indicated by yellow arrows in Fig. 4) in DN mice. Very low PSR and R1obs, and very high T2a were observed in extra-renal spaces. Compared to the PSR maps of normal WT kidneys (Fig. 2), the PSR maps of DN kidneys (Fig. 4) showed local cortical clusters of very low or high PSR values, with scattered spatial distributions (Fig. 4). Similar findings were observed in both left and right kidneys; however, the affected areas in cortex were different across kidneys.
Figure 4. In vivo MRI parametric maps of DN mouse kidney.
The yellow arrows in MTC images indicate the enlarged extra-renal spaces due to urine retention. In PSR maps, red arrows indicate low PSR areas, while white arrows indicate high PSR regions. The data from a 24-week old DN (db/db eNOS−/−) mouse are shown.
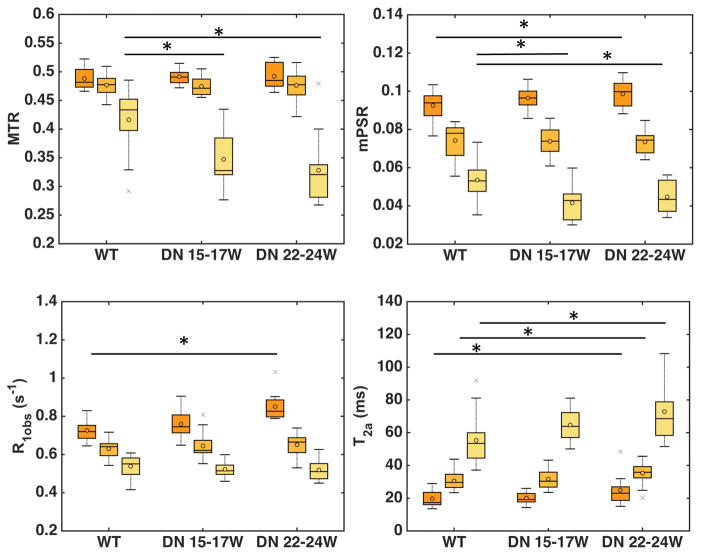
Regional differences among cortex, OM and IM+P were significant for mean PSR (mPSR), R1obs, and T2a in both normal WT and DN kidneys (Fig. 5). However, no significant difference of MTR was observed in cortex and medulla between DN and WT kidneys. The regional mPSR and R1obs showed a similar pattern (cortex > OM > IM+P), while T2a showed an opposite pattern (IM+P > OM > cortex) in both WT and DN kidneys at different stages. The regional mPSR values showed significant (r > 0.8, p < 0.01) correlations with R1obs and R2a (1/T2a). Across models, significant differences in cortical mPSR were only observed between WT mice and 22–24 week DN mice (Fig. 5).
Figure 5. Comparison of the averaged renal regional measures across mouse models.
Boxcar plots of MRI parameters MTR, PSR, R1obs and T2a in WT and DN mice kidneys. Cortex (dark orange), OM (light orange), and IM+P regions (yellow) are shown. The central lines and circles of the boxplots represent the medians and means respectively, and the box limits present the 25th and 75th percentiles. Crosses indicate outliers. In the same model, all the parameters show significant differences between regions. Across WT and DN models, significant regional parametric differences are indicated by asterisks (*p < 0.05). WT: 9 week-old mice (20 kidneys); DN 15–17W:15–17 week-old db/db eNOS−/− mice (12 kidneys); DN 22–24W: 22–24 week-old db/db eNOS−/− mice (12 kidneys).
PSR distribution and tPSR
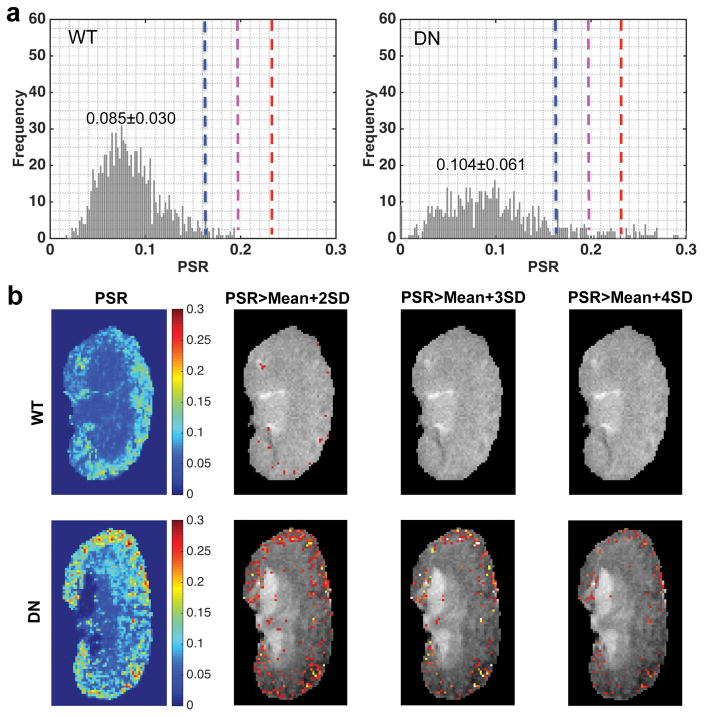
Although there was difference in mPSR of renal cortex between WT and DN mice (Fig. 5), this difference was small, suggesting that mPSR may not sufficiently detect renal fibrosis. Renal fibrosis is generally accompanied by tubular dilatation and urine retention that decrease the PSR values. Therefore, fibrosis could be underestimated when it is evaluated based on average mPSR ROI results alone. For this reason, we next conducted a threshold analysis to identify abnormally high PSR regions that may be associated with focal fibrosis. The regional PSR distributions of normal WT kidneys are shown in supporting Figure S5. The regional Mean and SD of PSR have been quantified across pixels in each region in normal WT kidneys, and these values were averaged across kidneys (N=20) to set up the thresholds for identifying abnormal clusters with higher PSR values. Thresholds were set up at Mean+2SD, Mean+3SD, and Mean+4SD based on the regional averaged values across kidneys (indicated by the blue, purple and red lines in Sup. Fig. S5). Then, the pixels with PSR above the threshold were identified and their % area in different regions were quantified (Equation 4). In the present study, we applied this method mainly to cortex, due to concerns over partial volume effects and large inter-subject variability in OM and IM+P regions (Fig. 5). The averaged SD value is 0.035 across voxels for WT cortex, and the corresponding thresholds Mean+2SD, Mean+3SD, and Mean+4SD values were 0.162, 0.197, and 0.232 respectively.
The cortical PSR distributions across pixels and the threshold PSR maps based on respective cortical thresholds were compared between WT and DN kidneys. Representative results are shown in Figure 6. In WT kidney, the fraction of pixels above the threshold was low (tPSR < 5.0%). However, in the DN kidney, the distribution of PSR showed a broader range in the cortex than that of normal WT kidney, and the fraction of pixels above the threshold was increased (Fig. 6a). The percentage of the cortical area that exceeded the PSR thresholds (tPSR) in this DN kidney was 15.60%, 8.46%, and 5.25% for thresholds at Mean+2SD, Mean+3SD and Mean+4SD respectively (Fig. 6b). It is of note that non-fibrotic db/db mouse kidneys (15–17 weeks, N=6)[47] did not show significant difference in cortical mPSR or tPSR from WT kidneys, although db/db mice showed quite similar body weights and kidney lengths (weight 50.33±2.25 g, length 11.42±0.54 mm, N=6) compared to those of db/db eNOS−/− mice at the same age (weight 46.83±5.09 g, length 11.00±0.37 mm, N=12). This data demonstrates the limited effects of body weights on PSR parameters.
Figure 6. Comparison of PSR distributions and tPSR maps in the cortex of WT and DN kidneys.
(a) PSR distributions in the cortexes of representative WT and DN kidneys. The cortical mean and standard deviation (SD) values across pixels in the representative WT and DN kidneys are shown. The Mean and SD of cortical PSR across kidneys are obtained from 20 normal WT kidneys. The blue, purple and red dash lines indicate Mean+2SD, Mean+3SD, and Mean+4SD of PSR in cortex respectively. (b) PSR maps and threshold PSR maps that highlight the regions with significantly higher PSR values than those of normal mouse kidneys. The percent area with PSR>Mean+2SD, PSR>Mean+3SD or PSR>Mean+4SD in the total area of cortex is calculated for further comparison with histological fibrosis indexes.
The MTR maps and cortical MTR distributions across pixels were compared between WT and DN kidneys (Sup. Fig. S4). In the DN kidney, the distribution of MTR also showed a broader range in the cortex than that of normal WT kidney, and the fraction of pixels above the threshold was increased (Sup. Fig. S4b).
Histological findings and fibrosis indexes
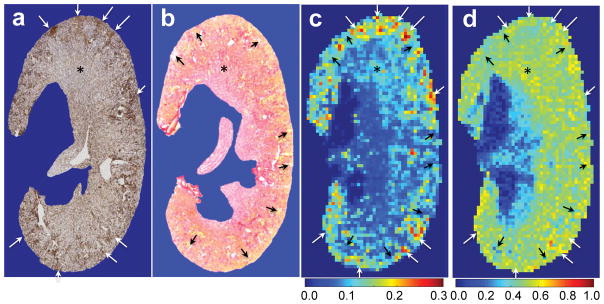
We next compared the MT results with histological findings and quantification of renal fibrosis. Figure 7 shows the comparison of selected renal tissue sections and in vivo PSR and MTR maps. Both collagen IV and the picrosirius red stains showed the presence of urine retention and fibrosis in the cortex of DN kidney, as indicated by tubular enlargement and accumulation of extracellular matrix proteins in the zoomed histological images of cortex (Sup. Fig. S6). The fibrosis regions were indicated by the depositions of collagen IV (white arrows in Fig. 7a). The regions of tubular enlargement and urine retention (yellow clusters) were marked in picrosirius red stain (black arrows in Fig. 7b). The fibrosis regions were present in the regions of high PSR values (white arrows in Fig. 7c), while the regions of urine retention showed low PSR (black arrows in Fig. 7c). Although MTR also identified some clusters with fibrosis or urine retention (Fig. 7d), it could be confounded by relaxation and exchanging rates. Indeed, MTR was not as specific as PSR in detecting macromolecular components (indicated by asterisks and arrows in Fig. 7). PSR was better than MTR in mapping the spatial distributions of fibrosis and urine retention in DN (Fig. 7). Therefore, we did not apply threshold MTR for evaluating DN fibrosis in this work.
Figure 7. Example showing the global comparison of in vivo MT maps and histological sections of collagen IV and picrosirius red stains.
(a) One representative section (3 μm thickness) with collagen IV stain, from the same portion of in vivo qMT imaging. (b) One representative section showing the picrosirius red stain. (c) PSR with 0.133×0.133 mm2 in-plane resolution and 1 mm thickness. (d) MTR with 0.133×0.133 mm2 in-plane resolution and 1 mm thickness. Black arrows indicate low PSR regions that are associated with tubular enlargement and urine retention (indicated in yellow color in picrosirius red stain). White arrows indicate high PSR regions that are associated with accumulated collagen IV stains, indicating fibrosis. Note: The different thickness of MRI image and histological section, the partial volume in PSR measures, and the deformity during tissue section processing limit comparison of MRI data and histological results. The DN kidney at the age of 24 weeks is shown.
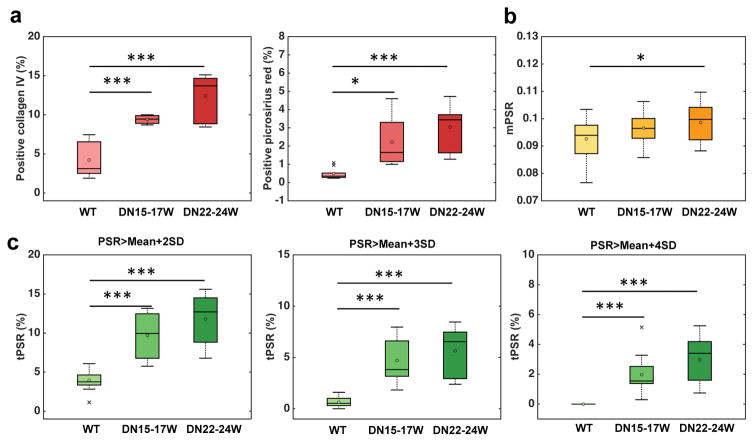
Positive collagen IV and picrosirius red areas in WT and DN kidneys were calculated to evaluate histological renal fibrosis (Sup. Fig. S6 and Fig. 8a). Both histological fibrosis measures in cortical regions showed significantly higher indexes for DN kidneys than normal WT kidneys (Sup. Fig. S6 and Fig. 8a), and the fibrosis index measured by collagen IV immunostain showed higher value than that measured by picrosirius red stain. To evaluate the utility of PSR in detecting renal fibrosis, we compared the regional changes in mPSR or tPSR-detected areas (%) with histological fibrosis indexes among WT, 15–17 week DN, and 22–24 week DN kidneys (Fig. 8). Collagen IV was more sensitive to cortical fibrosis developed in 15–17 week DN kidneys than picrosirius red stain. The mPSR showed significant difference in the cortex only between WT and 22–24 week DN kidneys. The sensitivity of mPSR (Fig. 8b) was much lower than histologic results (Fig. 8a), which is not a surprise because the mPSR values have been affected by both fibrosis and urine retention. The tPSR (Fig. 8c) showed higher sensitivity in detecting renal fibrosis than mPSR, and significant changes in tPSR were observed from WT to DN kidneys at ages of both 15–17 weeks and 22–24 weeks. Both tPSR-detected areas (%) and histological fibrosis indexes showed individual differences in DN kidneys at 15–17 weeks and 22–24 weeks, indicating that the extent of renal fibrosis varies across DN subjects.
Figure 8. Group comparison between WT and DN kidney cortexes.
(a) Boxplots of the histological fibrosis indexes determined by positive collagen IV or positive picrosirius red areas (%). (b) Boxplots of the cortical mPSR. (c) Boxplots of cortical tPSR-detected area (%) at thresholds: Mean+2SD, Mean+3SD and Mean+4SD. The central lines and circles of the boxplot represent the medians and means respectively, while the box limits present the 25th and 75th percentiles. Crosses indicate outliers. *p <0.05, **p < 0.005, and ***p <0.0005 compared to WT kidneys. N=20 for WT and N=12 for DN for PSR measures, while N=8 for WT and N=6 for DN at different age for histological measures. WT in light color, 15–17 week DN (DN15–17W) in darker color, and 22–24 week DN (DN22–24W) in the darkest color.
It is known that picrosirius red represents mainly collagen type I and III [48], which is different from collagen type IV stain. Collagen IV is a major component of the normal kidney matrix proteins including glomerular and tubular basement membranes and more abundantly present in WT kidneys, while collagen types I and III are faintly immunostained [49]. This would be the reason why the fibrosis index determined by positive collagen IV area showed higher values than positive picrosirius red areas. Furthermore, it was also shown that type IV collagen is more profoundly increased in renal fibrosis as compared with type I and III collagens [49]. This may explain why positive collagen IV area showed larger differences between WT and DN kidneys as compared with picrosirius red-positive areas.
Correlation of PSR measures with histological fibrosis indexes
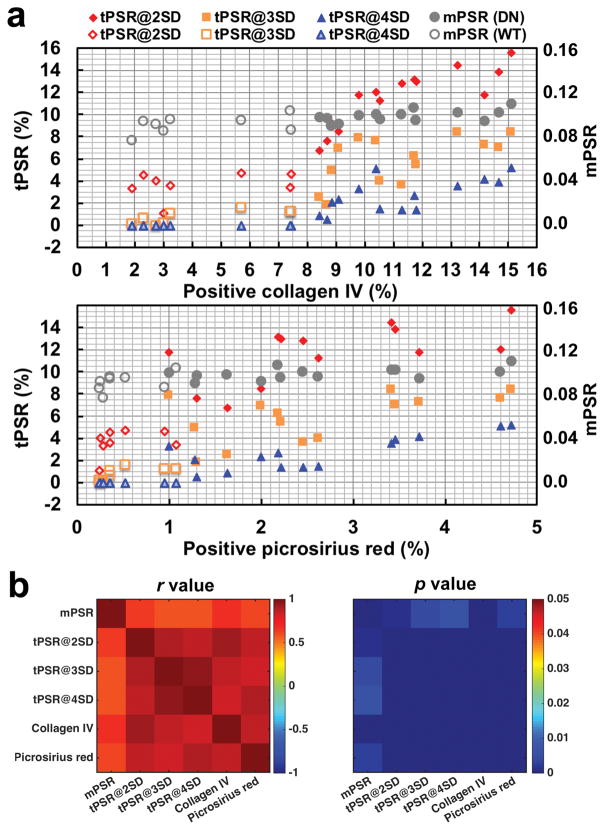
To evaluate the ability of qMT measures to detect renal fibrosis, we assessed the correlation between the PSR measures and histological fibrosis indexes based on collagen IV and picrosirius red stains in the cortex across kidneys (Fig. 9). The collagen IV and picrosirius red indexes were well correlated in cortex (r = 0.874, p <0.001) across kidneys, confirming that both histological indexes are detecting fibrosis in renal cortex. In renal cortex, the % area of fibrosis detected with tPSR is highly correlated with the histological fibrosis indexes that were measured with either collagen IV or picrosirius red stains (Fig. 9). The positive collagen IV area showed inter-kidney correlation coefficients 0.921, 0.866 and 0.819 with tPSR (p < 0.001) at thresholds Mean+2SD, Mean+3SD and Mean+4SD respectively, while picrosirius red-positive area showed 0.849, 0.827, and 0.900 with tPSR (p < 0.001) at these thresholds. It is of note that histological fibrosis indexes from collagen IV stains showed the highest correlation with the areas detected by tPSR at Mean+2SD (Fig. 9b). Compared to tPSR-detected areas, the mPSR showed much weaker correlations with the histological fibrosis indexes in cortex, with correlation coefficients at 0.670 and 0.609 (p < 0.005) for collagen IV and picrosirius red stains respectively.
Figure 9. Correlations between qMT and histological measures across kidneys.
(a) PSR measures and histological fibrosis indexes across kidneys. Histological fibrosis indexes (% area) were measured based on positive collagen IV and positive picrosirius red stain areas. The open markers indicate WT kidneys (N=8) and the filled markers indicate DN kidneys (N=14). The kidneys subjected to both MRI and histological examinations are shown. (b) The correlation r and p values. The tPSR-based measures at thresholds Mean+2SD, Mean+3SD, and Mean+4SD are labeled as tPSR@2SD, tPSR@3SD and tPSR@4SD respectively.
DISCUSSION
The qMT imaging method is sensitive to alterations in macromolecular components during disease progression, such as fibrosis and cell death. Our results provide the first demonstration that in vivo qMT imaging could be used for assessing the severity of renal fibrosis in diabetic kidney disease.
MRI parameters and their correlations in kidney
Kidney is a structurally and functionally highly organized organ, including glomerular filtration and tubular absorption in cortex and urine concentration in medulla. Our results showed significant regional differences in PSR and other MRI measures in both WT and DN kidneys. In principle, different MRI parameters quantify different aspects of tissue abnormalities. The PSR is a direct marker of macromolecular content. Low PSR could result from increased free water, while high PSR could be due to local macromolecular accumulation. Relaxation rates are also usually highly correlated with concentrations of macromolecules such as proteins. R2a (1/T2a) decreased from cortex to medulla as PSR decreased (Fig. 5). This could be associated with the increase in free water component (urine and blood) from the cortex to medulla. The regional differences in R1obs in both WT and DN kidneys could be related to macromolecular contents and tubular density in each renal compartment (cortex > OM > IM+P), explaining a strong positive correlation observed between R1obs and PSR (Fig. 5).
Impact from DN-associated urine retention
Polyuria is one of the features in diabetic patients and animals [47], and urine is concentrated and accumulated in medulla, especially in IM+P. In DN kidneys, a significant increase in mPSR was not observed in cortex, while high PSR regions detected by the tPSR were increased. Furthermore, mPSR was decreased in IM+P, compared to WT kidneys (Fig. 5b). These observations likely resulted from the increased urine volume in diabetic kidneys and were consistent with the significant increments of transverse time of free water pool T2a in these kidneys (Fig. 5d). Due to urine retention, the T2a of IM+P of DN kidneys lay out of the linear correlation (from cortex to IM+P) (Fig. 5d), and the T2a of extra-renal space of DN kidneys was even larger than that of IM+P, perhaps due to retained urine in renal pelvis (Fig. 4). The previous reports have shown that this DN mouse model exhibits prominent tubular dilatation and injury in a part of cortical tubules [50, 51]. Indeed, we also noted the focal tubular dilatation in the cortex of DN kidneys as compared with WT kidneys (Sup. Fig. S6). This finding could explain some local cortical regions in DN mouse kidneys, which show very low PSR (Fig. 4).
Sensitivity of qMT measures to DN-associated fibrosis
Our results showed that tPSR-based measures exhibit much higher correlation with regional histologic fibrosis indexes than the mPSR (Fig. 9). This could be because the tPSR preferentially extracts the fibrotic regions, while the mPSR across voxels senses both fibrosis and tubular dilatation/urine retention areas. The presence of the high correlation between tPSR-based measures and histologic fibrosis indexes indicates the focally accumulated distribution of renal fibrosis. In this DN model, renal fibrosis develops by 12 weeks of age and its level progressively increases as the mice age, from 12 to 26 weeks [38]. The sensitivity of tPSR-based measures is higher than mPSR (Fig. 8). The DN mice grouped at 15–17 weeks and 22–24 weeks all showed significant increments in tPSR-detected regions as compared to WT mice (Fig. 8c). In addition, slight increments of tPSR-detected regions were observed from 15–17 to 22–24 weeks (Fig. 8c). Similar differences were observed in the histological fibrosis indexes between these two different age DN mouse groups (Fig. 8a). Assuming true positives are identified for DN fibrosis by histologic staining, the true positive rates (probabilities of detection) for detecting DN fibrosis are 100% and 42.9% using tPSR and mPSR respectively. These findings suggest that high-resolution tPSR-based assessments could be used as a novel index of renal cortical fibrosis. Further work needs to be done to see whether tPSR could be used to detect mild structural changes in earlier stages of DN.
Different from MTR, PSR is independent of magnetic field strength, excluding the effect of field strength on SNR. The sensitivity of tPSR would not be scaled down if SNR maintained at similar range when measured at lower magnetic field (clinical 3T or 1.5T). This indicates that much longer data acquisition time is needed if qMT data with same resolution is acquired at lower field. This is the reason why most qMT studies of small animals are done at high field. However, given human kidney is much larger than mouse kidney (~110 mm versus ~10 mm in length), larger voxel size can be applied in human studies, which will significantly increase SNR and shorten data acquisition time. Numerical simulations will need to be performed to test qMT modeling performance for determining optimum data acquisition parameters (Sup. Fig. S2). Thus, further studies will be required to apply this technique to human patients.
Challenges in qMT mapping of mouse kidney disease
The detection of scattered macromolecular accumulations (fibrosis) in small mouse kidneys relies on the ability to acquire high-resolution images without artifacts. The use of high field increases the SNR in images (SNR for S0 is ~120) but also there are significant potential sources of artifacts. We selected pulsed MT for studying mouse kidneys because 1) sequences with long TR are more sensitive to motion and 2) SAR is lowered using pulsed saturation. The variation of B1 was less than 5% in kidney (Sup. Fig. S1), due to small murine kidney size (~4×5×10 mm3) and homogeneous B1 field provided (~30×30×30 mm3) in this study. Local Bo homogeneity is critical and a gradient echo sequence with short TE helps to reduce Bo-related artifacts. The RMS of ΔBo was less than 50 Hz in kidney; however, ΔBo could be larger than 100 Hz for pixels at the edge of the kidney (Sup. Fig. S1), especially for the left kidney adjacent to spleen that contains blood cells. Successful MT imaging was restricted to the homogeneous B1 and Bo region. In general, Bo corrections are not efficient if Bo inhomogeneity causes drastic local signal drop and low SNR in the S0 image (Sup. Fig. S2). B1 corrections are inadequate in regions where the deviations from nominal values are extremely large, when MT saturation and R1obs quantification could be largely affected. The variation of B1 could be large if the sample size is not adapted to the system.
Even though high SNR offered at high fields permits high resolution, partial volume averaging may still impact on regional quantification in small mouse kidneys. In renal cortex, variations in PSR in each voxel could reflect the net effect of pathological changes, including tubular dilation and urine retention, tubular atrophy, and interstitial inflammatory cell infiltration, myofibroblast proliferation, and fibrosis. Tubular dilation/urine retention, tubular atrophy, and inflammation would decrease the PSR in a voxel, while fibrosis would show the opposite effect. If the resolution is not high enough, the changes of PSR in each voxel would underestimate renal fibrosis. In kidney disease, fibrosis is closely associated with tubular dilatation or atrophy. Therefore, high-resolution imaging is critical to more precisely assess the extent of renal fibrosis. Also, it may be interesting to ascertain whether low PSR regions can be used for the assessment of tubular injury (tubular dilation and atrophy) in kidney disease.
The pattern of renal structural changes is different in different kidney diseases. For example, a large region of fibrosis (renal scar) is observed in nephrosclerosis [52], excessive and continuous collagen deposition in outer medulla can be caused by renal artery stenosis [27], while tubular dilatation is a major pathological finding in obstructive kidney disease [53]. Thus, the determination of optimal resolution in each kidney disease and establishing the links between the characteristic regional patterns of MT data and functional and histopathological renal changes should be a subject of future investigations.
CONCLUSIONS
In conclusion, significant PSR changes were observed in the mouse kidneys that exhibit progressive DN. The percentage of the cortical area that showed abnormally high PSR values (> Mean+2SD) were well correlated with the histological fibrosis measures. Our results provide the first demonstration that renal fibrosis in DN can be assessed by high-resolution qMT MRI with threshold analysis. The tPSR-based MRI assessment may provide more comprehensive evaluation of fibrosis in diseased kidneys, and may be used as a novel imaging biomarker for DN and other renal diseases.
Supplementary Material
Sup. Fig. S1. Representative ΔB0, B1, MTR, and T1 maps.
Sup. Fig. S2. The accuracy and precision of PSR derived from 5-parameter modeling approach based on the number of RF offsets and noisy simulated data with different SNRs.
Sup. Fig. S3. Renal regions in diabetic mouse, identified by in vivo T2-weighted, T1-weighted, and magnetization transfer contrast imaging.
Sup. Fig. S4. Comparison of MTR maps and MTR cortical distributions of WT and DN kidneys.
Sup. Fig. S5. Representative regional PSR distributions in normal (WT) mouse kidney.
Sup. Fig. S6. Comparison of cortical fibrosis in WT and DN mouse kidneys using anti-collagen IV and picrosirius red stain.
Acknowledgments
We thank Mr. Fuxue Xin, Mr. Ken Wilkens, Dr. Daniel C. Colvin, Mr. Jarrod True, and Dr. Mark D. Does in the Center for Small Animal Imaging at Vanderbilt University Institute of Imaging Science. We also thank Dr. Joseph T. Roland at the Digital Histology Shared Resource for computational analysis of stained kidney sections. This work was supported by National Institutes of Health grants DK79341, DK114809, DK97332, DK76169 (pilot project), and DK20593 (pilot program), and by Uehara Memorial Foundation, Kanae Foundation, and Nippon Medical School Grant-in-Aid for Overseas Training Program.
Footnotes
The authors declare no competing financial interests.
Additional supporting information can be found in the online version of this article.
References
- 1.Retnakaran R, et al. Risk factors for renal dysfunction in type 2 diabetes: U.K. Prospective Diabetes Study 74. Diabetes. 2006;55(6):1832–9. doi: 10.2337/db05-1620. [DOI] [PubMed] [Google Scholar]
- 2.Brosius FC, Saran R. Do we now have a prognostic biomarker for progressive diabetic nephropathy? J Am Soc Nephrol. 2012;23(3):376–7. doi: 10.1681/ASN.2012010090. [DOI] [PubMed] [Google Scholar]
- 3.Michaely HJ, et al. Functional renal MR imaging: an overview. Abdom Imaging. 2007;32(6):758–71. doi: 10.1007/s00261-006-9150-8. [DOI] [PubMed] [Google Scholar]
- 4.Takahashi T, Wang F, Quarles CC. Current MRI techniques for the assessment of renal disease. Curr Opin Nephrol Hypertens. 2015;24(3):217–23. doi: 10.1097/MNH.0000000000000122. [DOI] [PMC free article] [PubMed] [Google Scholar]
- 5.Niendorf T, et al. How bold is blood oxygenation level-dependent (BOLD) magnetic resonance imaging of the kidney? Opportunities, challenges and future directions. Acta Physiol. 2015;213(1):19–38. doi: 10.1111/apha.12393. [DOI] [PubMed] [Google Scholar]
- 6.Wang F, et al. Longitudinal assessment of mouse renal injury using high-resolution anatomic and magnetization transfer MR imaging. Magn Reson Imaging. 2014;32(9):1125–32. doi: 10.1016/j.mri.2014.07.012. [DOI] [PMC free article] [PubMed] [Google Scholar]
- 7.Togao O, et al. Assessment of renal fibrosis with diffusion-weighted MR imaging: study with murine model of unilateral ureteral obstruction. Radiology. 2010;255(3):772–80. doi: 10.1148/radiol.10091735. [DOI] [PMC free article] [PubMed] [Google Scholar]
- 8.Wang F, et al. Mapping murine diabetic kidney disease using chemical exchange saturation transfer MRI. Magn Reson Med. 2016;75(4):1685–1695. doi: 10.1002/mrm.26045. [DOI] [PMC free article] [PubMed] [Google Scholar]
- 9.Inoue T, et al. Noninvasive evaluation of kidney hypoxia and fibrosis using magnetic resonance imaging. J Am Soc Nephrol. 2011;22(8):1429–34. doi: 10.1681/ASN.2010111143. [DOI] [PMC free article] [PubMed] [Google Scholar]
- 10.Zhao J, et al. Assessment of renal fibrosis in chronic kidney disease using diffusion-weighted MRI. Clin Radiol. 2014;69(11):1117–22. doi: 10.1016/j.crad.2014.06.011. [DOI] [PubMed] [Google Scholar]
- 11.Feng Q, et al. DTI for the assessment of disease stage in patients with glomerulonephritis - correlation with renal histology. Eur Radiol. 2015;25(1):92–8. doi: 10.1007/s00330-014-3336-1. [DOI] [PubMed] [Google Scholar]
- 12.Korsmo MJ, et al. Magnetic resonance elastography noninvasively detects in vivo renal medullary fibrosis secondary to swine renal artery stenosis. Invest Radiol. 2013;48(2):61–8. doi: 10.1097/RLI.0b013e31827a4990. [DOI] [PMC free article] [PubMed] [Google Scholar]
- 13.Friedli I, et al. New Magnetic Resonance Imaging Index for Renal Fibrosis Assessment: A Comparison between Diffusion-Weighted Imaging and T1 Mapping with Histological Validation. Sci Rep. 2016;6:30088. doi: 10.1038/srep30088. [DOI] [PMC free article] [PubMed] [Google Scholar]
- 14.Boor P, et al. Diffusion-weighted MRI does not reflect kidney fibrosis in a rat model of fibrosis. J Magn Reson Imaging. 2015;42(4):990–8. doi: 10.1002/jmri.24853. [DOI] [PubMed] [Google Scholar]
- 15.Toya R, et al. Correlation between estimated glomerular filtration rate (eGFR) and apparent diffusion coefficient (ADC) values of the kidneys. Magn Reson Med Sci. 2010;9(2):59–64. doi: 10.2463/mrms.9.59. [DOI] [PubMed] [Google Scholar]
- 16.Wolff SD, Eng J, Balaban RS. Magnetization transfer contrast: method for improving contrast in gradient-recalled-echo images. Radiology. 1991;179(1):133–7. doi: 10.1148/radiology.179.1.2006263. [DOI] [PubMed] [Google Scholar]
- 17.Wolff SD, et al. Magnetization transfer contrast: MR imaging of the knee. Radiology. 1991;179(3):623–8. doi: 10.1148/radiology.179.3.2027963. [DOI] [PubMed] [Google Scholar]
- 18.Wolff SD, Balaban RS. Magnetization transfer contrast (MTC) and tissue water proton relaxation in vivo. Magn Reson Med. 1989;10(1):135–44. doi: 10.1002/mrm.1910100113. [DOI] [PubMed] [Google Scholar]
- 19.Odrobina EE, et al. MR properties of excised neural tissue following experimentally induced demyelination. NMR Biomed. 2005;18(5):277–84. doi: 10.1002/nbm.951. [DOI] [PubMed] [Google Scholar]
- 20.Catalaa I, et al. Multiple Sclerosis: Magnetization Transfer Histogram Analysis of Segmented Normal-appearing White Matter1. Radiology. 2000;216(2):351–355. doi: 10.1148/radiology.216.2.r00au16351. [DOI] [PubMed] [Google Scholar]
- 21.McDaniel JD, et al. Magnetization transfer imaging of skeletal muscle in autosomal recessive limb girdle muscular dystrophy. J Comput Assist Tomogr. 1999;23(4):609–14. doi: 10.1097/00004728-199907000-00023. [DOI] [PubMed] [Google Scholar]
- 22.Wang F, et al. Multiparametric MRI reveals dynamic changes in molecular signatures of injured spinal cord in monkeys. Magn Reson Med. 2015;74(4):1125–1137. doi: 10.1002/mrm.25488. [DOI] [PMC free article] [PubMed] [Google Scholar]
- 23.Aisen AM, Doi K, Swanson SD. Detection of liver fibrosis with magnetic cross-relaxation. Magnetic Resonance in Medicine. 1994;31(5):551–556. doi: 10.1002/mrm.1910310513. [DOI] [PubMed] [Google Scholar]
- 24.Quesson B, et al. Magnetization transfer fast imaging of implanted glioma in the rat brain at 4.7T: Interpretation using a binary spin-bath model. J Magn Reson Imaging. 1997;7(6):1076–1083. doi: 10.1002/jmri.1880070621. [DOI] [PubMed] [Google Scholar]
- 25.Kline TL, et al. Utilizing magnetization transfer imaging to investigate tissue remodeling in a murine model of autosomal dominant polycystic kidney disease. Magn Reson Med. 2016;75(4):1466–73. doi: 10.1002/mrm.25701. [DOI] [PMC free article] [PubMed] [Google Scholar]
- 26.Jiang K, et al. Magnetization Transfer Magnetic Resonance Imaging Noninvasively Detects Renal Fibrosis in Swine Atherosclerotic Renal Artery Stenosis at 3.0 T. Invest Radiol. 2017;52(11):686–692. doi: 10.1097/RLI.0000000000000390. [DOI] [PMC free article] [PubMed] [Google Scholar]
- 27.Jiang K, et al. Noninvasive Assessment of Renal Fibrosis with Magnetization Transfer MR Imaging: Validation and Evaluation in Murine Renal Artery Stenosis. Radiology. 2017;283(1):77–86. doi: 10.1148/radiol.2016160566. [DOI] [PMC free article] [PubMed] [Google Scholar]
- 28.Ramani A, et al. Precise estimate of fundamental in-vivo MT parameters in human brain in clinically feasible times. Magn Reson Imaging. 2002;20(10):721–31. doi: 10.1016/s0730-725x(02)00598-2. [DOI] [PubMed] [Google Scholar]
- 29.McGowan JC, Schnall MD, Leigh JS. Magnetization-Transfer Imaging with Pulsed Off-Resonance Saturation - Variation in Contrast with Saturation Duty Cycle. J Magn Reson Imaging. 1994;4(1):79–82. doi: 10.1002/jmri.1880040116. [DOI] [PubMed] [Google Scholar]
- 30.Eng J, Ceckler TL, Balaban RS. Quantitative 1H magnetization transfer imaging in vivo. Magn Reson Med. 1991;17(2):304–14. doi: 10.1002/mrm.1910170203. [DOI] [PubMed] [Google Scholar]
- 31.Henkelman RM, et al. Quantitative interpretation of magnetization transfer. Magn Reson Med. 1993;29(6):759–66. doi: 10.1002/mrm.1910290607. [DOI] [PubMed] [Google Scholar]
- 32.Sled JG, Pike GB. Quantitative interpretation of magnetization transfer in spoiled gradient echo MRI sequences. J Magn Reson. 2000;145(1):24–36. doi: 10.1006/jmre.2000.2059. [DOI] [PubMed] [Google Scholar]
- 33.Gochberg DF, Gore JC. Quantitative imaging of magnetization transfer using an inversion recovery sequence. Magn Reson Med. 2003;49(3):501–5. doi: 10.1002/mrm.10386. [DOI] [PubMed] [Google Scholar]
- 34.Wang F, et al. Longitudinal assessment of spinal cord injuries in nonhuman primates with quantitative magnetization transfer. Magn Reson Med. 2016;75(4):1685–96. doi: 10.1002/mrm.25725. [DOI] [PMC free article] [PubMed] [Google Scholar]
- 35.Wang F, et al. Assessment of unilateral ureter obstruction with multi-parametric MRI. Magn Reson Med. 2018;79(4):2216–2227. doi: 10.1002/mrm.26849. [DOI] [PMC free article] [PubMed] [Google Scholar]
- 36.Prabhakar SS. Pathogenic role of nitric oxide alterations in diabetic nephropathy. Curr Diab Rep. 2005;5(6):449–54. doi: 10.1007/s11892-005-0054-8. [DOI] [PubMed] [Google Scholar]
- 37.Takahashi T, Harris RC. Role of endothelial nitric oxide synthase in diabetic nephropathy: lessons from diabetic eNOS knockout mice. J Diabetes Res. 2014;2014:590541. doi: 10.1155/2014/590541. [DOI] [PMC free article] [PubMed] [Google Scholar]
- 38.Zhao HJ, et al. Endothelial nitric oxide synthase deficiency produces accelerated nephropathy in diabetic mice. J Am Soc Nephrol. 2006;17(10):2664–2669. doi: 10.1681/ASN.2006070798. [DOI] [PMC free article] [PubMed] [Google Scholar]
- 39.Brosius FC, 3rd, et al. Mouse models of diabetic nephropathy. J Am Soc Nephrol. 2009;20(12):2503–12. doi: 10.1681/ASN.2009070721. [DOI] [PMC free article] [PubMed] [Google Scholar]
- 40.Cercignani M, Barker GJ. A comparison between equations describing in vivo MT: the effects of noise and sequence parameters. J Magn Reson. 2008;191(2):171–83. doi: 10.1016/j.jmr.2007.12.012. [DOI] [PMC free article] [PubMed] [Google Scholar]
- 41.Hara S, et al. Diffuse glomerular nodular lesions in diabetic pigs carrying a dominant-negative mutant hepatocyte nuclear factor 1-alpha, an inheritant diabetic gene in humans. PloS one. 2014;9(3):e92219. doi: 10.1371/journal.pone.0092219. [DOI] [PMC free article] [PubMed] [Google Scholar]
- 42.Katagiri D, et al. Interstitial renal fibrosis due to multiple cisplatin treatments is ameliorated by semicarbazide-sensitive amine oxidase inhibition. Kidney Int. 2016;89(2):374–85. doi: 10.1038/ki.2015.327. [DOI] [PubMed] [Google Scholar]
- 43.Pluim JPW, Maintz JBA, Viergever MA. Mutual-information-based registration of medical images: A survey. IEEE Trans Med Imaging. 2003;22(8):986–1004. doi: 10.1109/TMI.2003.815867. [DOI] [PubMed] [Google Scholar]
- 44.Smith SA, et al. Measurement of T1 and T2 in the cervical spinal cord at 3 tesla. Magn Reson Med. 2008;60(1):213–9. doi: 10.1002/mrm.21596. [DOI] [PMC free article] [PubMed] [Google Scholar]
- 45.Wang F, et al. Repeatability and sensitivity of high resolution blood volume mapping in mouse kidney disease. J Magn Reson Imaging. 2014;39(4):866–71. doi: 10.1002/jmri.24242. [DOI] [PMC free article] [PubMed] [Google Scholar]
- 46.Clarke CJ, et al. The Initiator Methionine tRNA Drives Secretion of Type II Collagen from Stromal Fibroblasts to Promote Tumor Growth and Angiogenesis. Curr Biol. 2016;26(6):755–65. doi: 10.1016/j.cub.2016.01.045. [DOI] [PMC free article] [PubMed] [Google Scholar]
- 47.Breyer MD, et al. Diabetic nephropathy: of mice and men. Adv Chronic Kidney Dis. 2005;12(2):128–45. doi: 10.1053/j.ackd.2005.01.004. [DOI] [PubMed] [Google Scholar]
- 48.Farris AB, Colvin RB. Renal interstitial fibrosis: mechanisms and evaluation. Curr Opin Nephrol Hypertens. 2012;21(3):289–300. doi: 10.1097/MNH.0b013e3283521cfa. [DOI] [PMC free article] [PubMed] [Google Scholar]
- 49.Kaneto H, et al. Enalapril reduces collagen type IV synthesis and expansion of the interstitium in the obstructed rat kidney. Kidney Int. 1994;45(6):1637–47. doi: 10.1038/ki.1994.215. [DOI] [PubMed] [Google Scholar]
- 50.Mohan S, et al. Diabetic eNOS knockout mice develop distinct macro- and microvascular complications. Lab Invest. 2008;88(5):515–28. doi: 10.1038/labinvest.2008.23. [DOI] [PubMed] [Google Scholar]
- 51.Zhang MZ, et al. Role of blood pressure and the renin-angiotensin system in development of diabetic nephropathy (DN) in eNOS−/− db/db mice. Am J Physiol Renal Physiol. 2012;302(4):F433–8. doi: 10.1152/ajprenal.00292.2011. [DOI] [PMC free article] [PubMed] [Google Scholar]
- 52.Meyrier A. Nephrosclerosis: update on a centenarian. Nephrol Dial Transplant. 2015;30(11):1833–41. doi: 10.1093/ndt/gfu366. [DOI] [PubMed] [Google Scholar]
- 53.Chevalier RL. Obstructive nephropathy: towards biomarker discovery and gene therapy. Nat Clin Pract Nephrol. 2006;2(3):157–68. doi: 10.1038/ncpneph0098. [DOI] [PubMed] [Google Scholar]
Associated Data
This section collects any data citations, data availability statements, or supplementary materials included in this article.
Supplementary Materials
Sup. Fig. S1. Representative ΔB0, B1, MTR, and T1 maps.
Sup. Fig. S2. The accuracy and precision of PSR derived from 5-parameter modeling approach based on the number of RF offsets and noisy simulated data with different SNRs.
Sup. Fig. S3. Renal regions in diabetic mouse, identified by in vivo T2-weighted, T1-weighted, and magnetization transfer contrast imaging.
Sup. Fig. S4. Comparison of MTR maps and MTR cortical distributions of WT and DN kidneys.
Sup. Fig. S5. Representative regional PSR distributions in normal (WT) mouse kidney.
Sup. Fig. S6. Comparison of cortical fibrosis in WT and DN mouse kidneys using anti-collagen IV and picrosirius red stain.


