

Abstract
Mendelian randomization (MR) is gaining in recognition and popularity as a method for strengthening causal inference in epidemiology by utilizing genetic variants as instrumental variables. Concurrently with the explosion in empirical MR studies, there has been the steady production of new approaches for MR analysis. The recently proposed “global and individual tests for direct effects” (GLIDE) approach fits into a family of methods that aim to detect horizontal pleiotropy—at the individual single nucleotide polymorphism level and at the global level—and to adjust the analysis by removing outlying single nucleotide polymorphisms. In this commentary, we explain how existing methods can (and indeed are) being used to detect pleiotropy at the individual and global levels, although not explicitly using this terminology. By doing so, we show that the true comparator for GLIDE is not MR-Egger regression (as Dai et al., the authors of the accompanying article (Am J Epidemiol. 2018;187(12):2672–2680), claim) but rather the humble heterogeneity statistic.
Keywords: heterogeneity statistic, horizontal pleiotropy, Mendelian randomization, MR-Egger regression, outlier detection
Mendelian randomization (MR) (1) is gaining in recognition and popularity as a method for strengthening causal inference in epidemiology by utilizing genetic variants as instrumental variables. Its use has been accelerated in recent years by the increasing availability of genome-wide association studies and large-scale biobank cohort data. Indeed, most traits that are analyzed with sufficiently large sample sizes (e.g., hundreds of thousands of individuals) yield large numbers of robustly associated variants. Human height is perhaps the most extreme example, with over 3,000 independent variants identified so far (2). To ascertain, for example, whether height exerts a generic causal effect on risk of colorectal cancer, we would need to assume that each variant additionally 1) is not associated with any confounders of the height–colorectal cancer relationship and 2) only affects the risk of colorectal cancer through height (or an automatic concomitant of height, such as cell number). It seems implausible in this case that all 3,000 variants will meet these strict assumptions, due to their exerting an influence on multiple downstream traits through many different pathways. This phenomenon is referred to as horizontal pleiotropy (3, 4), and its existence is well documented (5).
Concurrently with the explosion in empirical MR studies, there has been the steady production of new approaches for MR analysis. For example, simple methods have been adapted from mainstream meta-analysis to synthesize causal estimates obtained from many independent variants, while accounting for both heterogeneity and bias due to pleiotropy. These include the inverse-variance–weighted (IVW) approach (6), MR-Egger regression (7) and multivariate extensions thereof (8, 9). Another stream of methods instead aim for natural robustness to pleiotropy, rather than enacting an explicit bias correction. These include the weighted median estimator (10) and mode-based estimation (11, 12). (For a recent review, see Hemani et al. (13).) All of these methods require only summary data estimates of single nucleotide polymorphism (SNP)–trait associations that are often nondisclosive and publicly available (14).
The approach recently proposed by Dai et al. (15), termed “global and individual tests for direct effects” (GLIDE), fits into a family of methods that aim to detect horizontal pleiotropy—at the individual SNP level and at the global level—and to adjust the analysis by removing outlying SNPs. Specifically, the GLIDE method is introduced for contexts in which individual-level data are available on a set of genetic instruments, an exposure and a binary outcome, and where the data have been collected under case-control sampling. A relative risk model is used under a rare disease assumption to address the issue of noncollapsibility, and inverse probability weighting is used to adjust for ascertainment bias. It uses P values derived by simulation and a P value combination approach to derive tests for pleiotropy. Dai et al. show that the GLIDE method is far more powerful at detecting global pleiotropy than is MR-Egger regression (15).
Verbanck et al. (5) have also recently proposed a new test for global pleiotropy based on a simulated unweighted heterogeneity statistic, as well as an approach with which to detect and remove individual outliers from the analysis. Their method—“Mendelian randomization pleiotropy residual sum and outlier” (MR-PRESSO) is close in spirit to GLIDE.
It is welcome that the MR problem is now being scrutinized by many independent scientific groups across the world. This will undoubtedly lead to improved methods, inference, and understanding. In this commentary, we explain how existing methods (partly borrowed from mainstream meta-analysis) can, and indeed are, being used to detect pleiotropy at the individual and global levels, although not explicitly using this terminology. By doing so, we show that the true comparator for GLIDE is not MR-Egger regression but rather the humble heterogeneity statistic.
COCHRAN’S Q STATISTIC
Following equation 2 in the paper by Dai et al. (15) and using their notation, we start by assuming the causal relative risk model for the outcome given the genetic variant (or SNP) out of holds in a cohort (e.g., cohort 1) of individuals
| (1) |
Here represents the association between the jth SNP and the exposure X, represents the pleiotropic effect of SNP j on the outcome Y, and represents the causal effect of X on Y we wish to estimate. This setup is illustrated in Figure 1, where we assume that horizontal pleiotropy operates via pathways that are independent of the exposure, although this is not crucial to any of our following arguments.
Figure 2.

A) Power of Cochran’s Q statistic, Rucker’s Q′ statistic, and the Mendelian randomization (MR)-Egger intercept to detect global pleiotropy for simulated MR data containing 25 single nucleotide polymorphisms. B) Individual contributions to Cochran’s Q statistic and Rucker’s Q′ statistic. The single nucleotide polymorphisms were individually numbered from 1 to 25 for illustrative purposes. Horizontal lines indicate the 95th (dotted lines) and 99.8th (dashed line) percentiles of the χ2 distribution with 1 degree of freedom.
Figure 1.
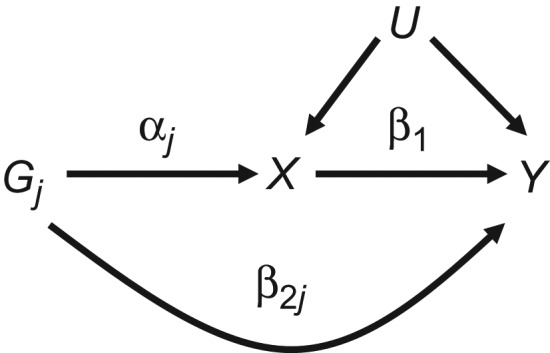
Relationship between genetic variant Gj, exposure X, outcome Y, and unmeasured variable(s) U, with effects as defined in equation 1.
Assume, as Dai et al. do (15), that an independent, external data source (e.g., cohort 2) is available with which we can obtain an estimate for the parameter with negligible error. That is, our estimate . This requires cohort 2 to be large and also homogenous with respect to cohort 1 (16, 17). Further assume that our estimate for the SNP-outcome association has variance . We can then derive an estimate, , for the causal effect parameter . This is obtained by dividing the SNP-outcome association by the jth SNP-exposure association . The estimate has mean and variance
The inverse-variance–weighted average of the ratio estimates . Finally, define Cochran’s statistic . When all SNPs are uncorrelated, and the independent samples in cohort 1 and cohort 2 are drawn from the same underlying population, the IVW estimate is asymptotically equivalent to the 2-stage least-squares estimate that would be obtained with individual-level data. If for all j in (1, …, m), so that the global null hypothesis of no pleiotropy is true, then
is an unbiased estimate for ;
Cochran’s Q statistic should follow a χ2 distribution with degrees of freedom (df); and
provided that is sufficiently large, the contribution to , , is approximately χ2 distributed on 1 df.
Therefore, can be used to test for global pleiotropy and can be used to test for individual pleiotropy. The use of Cochran’s statistic makes perfect sense, since it is equivalent to the Sargan test statistic for detecting invalid instruments (18) from the econometrics literature.
MR-EGGER REGRESSION
When for some in 1, …, m, then the IVW estimate can still unbiasedly estimate the causal effect when 1) the sample covariance between and is zero—the “instrument strength independent of direct effect” (InSIDE) assumption—and 2) the sample mean of the terms is zero. This is referred to as balanced pleiotropy. Pleiotropy is said to be “directional” if the InSIDE assumption holds but the sample mean of the terms is nonzero. The MR-Egger method performs a regression of the SNP-outcome associations on the SNP-exposure associations with the intercept left unconstrained to test this hypothesis, by assuming the mean model:
The MR-Egger method still relies on the InSIDE assumption, but if satisfied the intercept term provides an estimate of the mean pleiotropic effect, and the slope provides an estimate of the causal effect adjusted for any nonzero mean pleiotropy. After fitting the MR-Egger regression model and adjusting for the mean pleiotropic effect, it is then possible to test whether any residual heterogeneity due to pleiotropy remains. This can be assessed by using Rucker’s Q statistic:
Under the null hypothesis that all SNPs have the same direct effect , estimating and adjusting for their mean value (via ) is sufficient to completely remove all pleiotropy from the analysis. If this is true (which is unlikely):
Rucker’s statistic should follow a χ2 distribution with df and
The jth component of , should approximately follow a χ2 distribution on 1 df.
Rejection of the null hypothesis implies that residual direct effects, with magnitudes , remain in the data. Therefore, Rucker’s statistic and its individual components can be used to test for global and individual pleiotropy after MR-Egger adjustment.
SIMULATION EXAMPLE
To illustrate the above, Figure 2A shows the power of Cochran’s statistic and Rucker’s statistic to detect global pleiotropy at the 5% significance level for simulated MR data sets of 25 SNPs. Also shown on the same plot is the power of the MR-Egger method to detect a statistically significant intercept at the 5% level. The simulation assumes balanced pleiotropy, but we vary the magnitude of the pleiotropic effects so that their maximum value lies between 0 and ±0.2. The simulation is therefore analogous to Figure 2B in the paper by Dai et al. (15).
The power of Cochran’s statistic and Rucker’s statistic to detect global pleiotropy is seen to increase sharply as a function of direct effect magnitudes, whereas the power of MR-Egger to detect a nonzero intercept increases slowly. In fact, its power depends strongly on the amount of variability in the instrument strengths across the set of SNPs (17, 19). The key message we wish to convey in this commentary is the following:
MR-Egger regression provides a very poor test for global pleiotropy, and it was never intended to be used for this purpose. Cochran’sstatistic and Rucker’sstatistic should instead be used.
Figure 2B shows, for a single MR analysis containing 25 SNPs, the individual contributions to Cochran’s statistic and Rucker’s statistic. This time, the data are generated under directional pleiotropy with mean value 0.1 to induce a difference between the and contributions. Horizontal lines indicate the 95th percentile and Bonferroni-corrected 99.8th percentile of the χ2 (1 df) distribution; the latter threshold can be used to guide the detection of individual outliers in order to control the familywise error rate. In this case, 2 variants’ contributions to are extreme enough to be considered for removal. The fact that no variant’s contribution to is large enough to warrant removal is a sign that the MR-Egger model constitutes a better fit to the data than the IVW model in this instance. This is not surprising because it is a 2-parameter rather than a 1-parameter model. The R computer code (R Foundation for Statistical Computing, Vienna, Austria) used to perform the simulations in Figure 2 can be found in the accompanying Web Appendix (available at https://academic.oup.com/aje).
A framework for using and to detect global pleiotropy and decide on the appropriateness of either IVW or MR-Egger regression for a given analysis is contained in an article by Bowden et al. (17). (See also Thompson et al. (20) and Schmidt and Dudbridge (21) for closely related Bayesian approaches.) The GLIDE method proposed by Dai et al. (15) is an interesting addition to the literature on MR methods, but it should be compared directly with Cochran’s statistic and Rucker’s statistic when evaluating its utility in this regard. It may well give very similar results.
Because of their derivation under the 2-stage least-squares framework, the IVW and MR-Egger approaches are only approximate when the outcome is binary, due to the noncollapsibility of the odds ratio (22), and case-control sampling is used. The GLIDE approach does at least address these issues head-on with the use of a causal relative risk model. However, when the binary outcome has a relatively low prevalence, a more straightforward logistic regression with inverse probability weighting provides a convenient and reasonable way to obtain parameter estimates for GLIDE’s causal relative risk model (23). Indeed, in the authors’ own applied example, this is the approach taken (15). Furthermore, because each SNP explains only a small amount of variation in the exposure in an MR study and makes up a small contribution of the total instrument strength, a linear model provides a surprisingly accurate approximation with which to identify a “local” causal effect. For further details of this argument, see Appendix A.2 in another paper by Zhao et al. (24).
COMPARISON WITH MR-PRESSO AND THE MR ROBUST ADJUSTED PROFILE SCORE
Dai et al. assume in the development of their method that SNP-exposure associations utilized in the analysis are estimated with negligible error (i.e., that they are strong instruments) (15). This is referred to as the “no measurement error” assumption (25). When the no measurement error assumption is violated due to the presence of weak instruments, the standard meta-analytical framework outlined in this commentary breaks down and the type I error rate of Cochran’s statistic for detecting pleiotropy can be grossly inflated. This fact has also been noted by Verbanck et al. (5), which provided the motivation for MR-PRESSO. In recent work (25), we modified the inverse variance weights used to calculate Cochran’s statistic to improve their performance with weak instruments. Verbanck et al. helpfully compared MR-PRESSO with a preliminary version of our modified statistic and showed that it performs similarly (5).
Both MR-PRESSO and GLIDE use tests for individual pleiotropy to explicitly remove variants from the analysis before estimating the causal effect. A simpler and arguably more objective approach is to use robust estimators that penalize, rather than remove the contribution of, outlying variants. See, for example, the MR “robust adjusted profile score” approach of Zhao et al. (24), which also accounts for bias due to weak instruments.
In conclusion, we hope we have explained how to use the standard heterogeneity statistic to learn about individual and global pleiotropy in MR, as a useful comparator to GLIDE. Further comparison of all of these approaches is needed to reach a better understanding of their relative merits.
Supplementary Material
ACKNOWLEDGMENTS
Author affiliations: MRC Integrative Epidemiology Unit, University of Bristol, Bristol, United Kingdom (Jack Bowden, Gibran Hemani, George Davey Smith).
This work was funded by Medical Research Council program grants MC_UU_00011/2 and MC_UU_00011/1.
Conflict of interest: none declared.
Abbreviations
- df
degrees of freedom
- GLIDE
global and individual tests for direct effects
- InSIDE
instrument strength independent of direct effect
- IVW
inverse-variance–weighted
- MR
Mendelian randomization
- MR-PRESSO
Mendelian randomization pleiotropy residual sum and outlier
- SNP
single nucleotide polymorphism
REFERENCES
- 1. Davey Smith G, Ebrahim S. Mendelian randomization: can genetic epidemiology contribute to understanding environmental determinants of disease? Int J Epidemiol. 2003;32(1):1–22. [DOI] [PubMed] [Google Scholar]
- 2. Yengo L, Sidorenko J, Kemper KE, et al. Meta-analysis of genome-wide association studies for height and body mass index in ~700,000 individuals of European ancestry. bioRxiv. 2018. (doi: 10.1101/274654). Accessed June 20, 2018. [DOI] [PMC free article] [PubMed] [Google Scholar]
- 3. Stearns FW. One hundred years of pleiotropy: a retrospective. Genetics. 2010;186(3):767–773. [DOI] [PMC free article] [PubMed] [Google Scholar]
- 4. Davey Smith G, Hemani G. Mendelian randomization: genetic anchors for causal inference in epidemiological studies. Hum Mol Genet. 2014;23(R1):R89–R98. [DOI] [PMC free article] [PubMed] [Google Scholar]
- 5. Verbanck M, Chen CY, Neale B, et al. Detection of widespread horizontal pleiotropy in causal relationships inferred from Mendelian randomization between complex traits and diseases. Nat Genet. 2018;50:693–698. [DOI] [PMC free article] [PubMed] [Google Scholar]
- 6. Burgess S, Butterworth A, Thompson SG. Mendelian randomization analysis with multiple genetic variants using summarized data. Genet Epidemiol. 2013;37(7):658–665. [DOI] [PMC free article] [PubMed] [Google Scholar]
- 7. Bowden J, Davey Smith G, Burgess S. Mendelian randomization with invalid instruments: effect estimation and bias detection through Egger regression. Int J Epidemiol. 2015;44(2):512–525. [DOI] [PMC free article] [PubMed] [Google Scholar]
- 8. Burgess S, Dudbridge F, Thompson SG. Re: “Multivariable Mendelian randomization: the use of pleiotropic genetic variants to estimate causal effects” [letter]. Am J Epidemiol. 2015;181(4):290–291. [DOI] [PubMed] [Google Scholar]
- 9. Rees JMB, Wood AM, Burgess S. Extending the MR-Egger method for multivariable Mendelian randomization to correct for both measured and unmeasured pleiotropy. Stat Med. 2017;36(29):4705–4718. [DOI] [PMC free article] [PubMed] [Google Scholar]
- 10. Bowden J, Davey Smith G, Haycock PC, et al. Consistent estimation in Mendelian randomization with some invalid instruments using a weighted median estimator. Genet Epidemiol. 2016;40(4):304–314. [DOI] [PMC free article] [PubMed] [Google Scholar]
- 11. Hartwig FP, Davey Smith G, Bowden J. Robust inference in summary data Mendelian randomization via the zero modal pleiotropy assumption. Int J Epidemiol. 2017;46(6):1985–1998. [DOI] [PMC free article] [PubMed] [Google Scholar]
- 12. Burgess S, Zuber V, Gkatzionis A, et al. Modal-based estimation via heterogeneity-penalized weighting: model averaging for consistent and efficient estimation in Mendelian randomization when a plurality of candidate instruments are valid. Int J Epidemiol. 2018;47(4):1242–1254. [DOI] [PMC free article] [PubMed] [Google Scholar]
- 13. Hemani G, Bowden J, Davey Smith G. Evaluating the potential role of pleiotropy in Mendelian randomization studies. Hum Mol Genet. 2018;27(R2):R195–R208. [DOI] [PMC free article] [PubMed] [Google Scholar]
- 14. Hemani G, Zheng J, Elsworth B, et al. The MR-Base platform supports systematic causal inference across the human phenome. Elife. 2018;7:e34408. [DOI] [PMC free article] [PubMed] [Google Scholar]
- 15. Dai JY, Peters U, Wang X, et al. Diagnostics for pleiotropy in Mendelian randomization studies: global and individual tests for direct effects. Am J Epidemiol. 2018;187(12):2672–2680. [DOI] [PMC free article] [PubMed] [Google Scholar]
- 16. Zhao Q, Wang J, Bowden J, et al. Two-sample instrumental variable analyses using heterogeneous samples. ArXiv. 2018. https://arxiv.org/abs/1709.00081. Submitted August 31, 2017. Revised September 5, 2018. Accessed June 20, 2018. [Google Scholar]
- 17. Bowden J, Del Greco MF, Minelli C, et al. A framework for the investigation of pleiotropy in two-sample summary data Mendelian randomization. Stat Med. 2017;36(11):1783–1802. [DOI] [PMC free article] [PubMed] [Google Scholar]
- 18. Greco MFD, Minelli C, Sheehan NA, et al. Detecting pleiotropy in Mendelian randomisation studies with summary data and a continuous outcome. Stat Med. 2015; 34(21):2926–2940. [DOI] [PubMed] [Google Scholar]
- 19. Bowden J, Del Greco MF, Minelli C, et al. Assessing the suitability of summary data for two-sample Mendelian randomization analyses using MR-Egger regression: the role of the I2 statistic. Int J Epidemiol. 2016;45(6):1961–1974. [DOI] [PMC free article] [PubMed] [Google Scholar]
- 20. Thompson JR, Minelli C, Bowden J, et al. Mendelian randomization incorporating uncertainty about pleiotropy. Stat Med. 2017;36(29):4627–4645. [DOI] [PubMed] [Google Scholar]
- 21. Schmidt AF, Dudbridge F. Mendelian randomization with Egger pleiotropy correction and weakly informative Bayesian priors. Int J Epidemiol. 2018;47(4):1217–1228. [DOI] [PMC free article] [PubMed] [Google Scholar]
- 22. Vansteelandt S, Bowden J, Babanezhad M, et al. On instrumental variables estimation of causal odds ratios. Stat Sci. 2011;26(3):403–422. [Google Scholar]
- 23. Bowden J, Vansteelandt S. Mendelian randomization analysis of case-control data using structural mean models. Stat Med. 2011;30(6):678–694. [DOI] [PubMed] [Google Scholar]
- 24. Zhao Q, Wang J, Hemani G, et al. Statistical inference in two-sample summary-data Mendelian randomization using robust adjusted profile score. ArXiv. 2018. https://arxiv.org/pdf/1801.09652.pdf. Accessed June 20, 2018. [Google Scholar]
- 25. Bowden J, Del Greco MF, Minelli C, et al. Improving the accuracy of two-sample summary data Mendelian randomization: moving beyond the NOME assumption. bioRxiv. 2017. doi: 10.1101/159442. Accessed June 20, 2018. [DOI] [PMC free article] [PubMed] [Google Scholar]
Associated Data
This section collects any data citations, data availability statements, or supplementary materials included in this article.