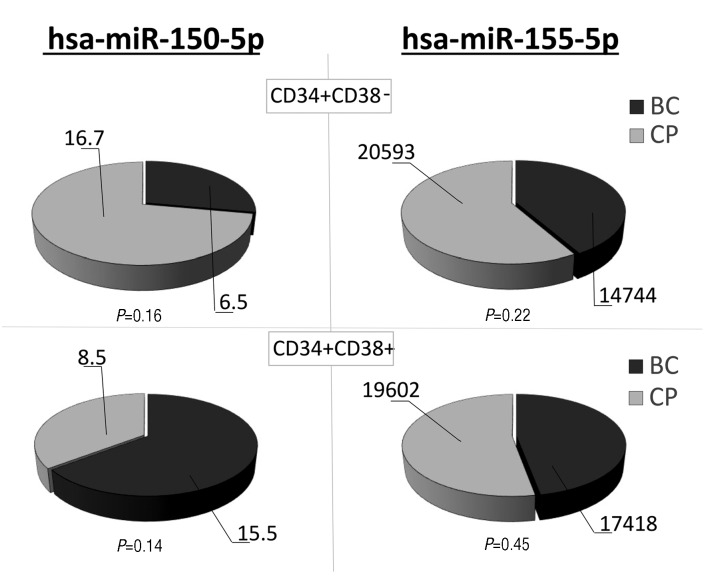
Figure 2.
Comparison of miR-150 and miR-155 expression in leukemic stem/progenitor cells (LSPCs) in blast crisis and chronic phase (CP) chronic myeloid leukemia (CML). Pie charts illustrate the proportions of read count median values for miR-150 (left column) and miR-155 (right column) expression obtained by miRNA RNA sequencing. The read counts that overlapped with miR-150 and miR-155 after alignment with human genome GRCh38 were calculated using miRDeep quantifier module and normalized to counts per million (CPM). Primary bone marrow (BM) cell populations used for the measurement and comparison are indicated for each pair of charts. P-values in the miR expression between the compared cell populations are illustrated below each chart. Paired two-tailed Student t-test was used for determining of P-values. BC: blast crisis CML (n=3); CP: chronic phase CML (n=3).

