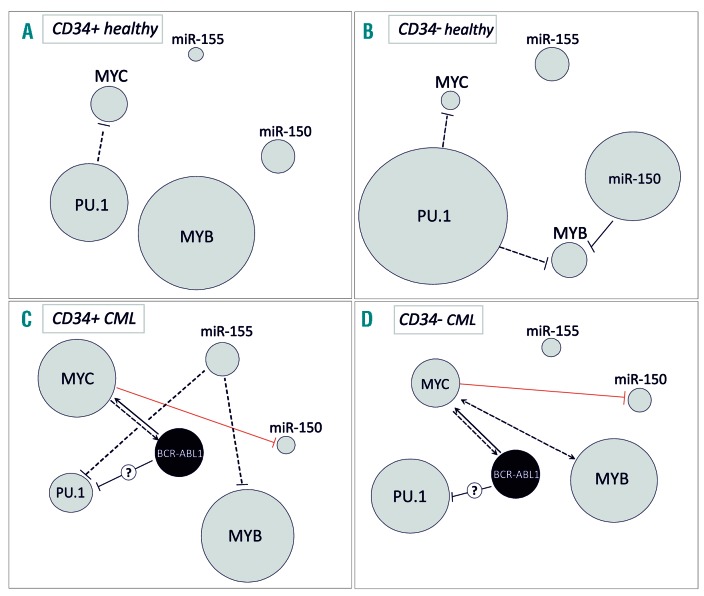
Figure 7.
The suggested model of relationships among BCR-ABL1, MYC, MYB, PU.1, miR-150 and miR-155 in CD34+ and CD34− cells from chronic myeloid leukemia (CML) patients and healthy donors. The schemes represent the expression levels and mutual relationships among the molecules in CD34+ (A) and CD34− (B) cells from healthy donors compared with the profiles of CD34+ (C) or CD34− (D) cells, respectively, from CML patients at diagnosis. The circle sizes denote the expression levels of specific molecules. The black lines represent the active stimulatory (arrowheads) or inhibitory (flat-heads) relationships described in the manuscript. The red line emphasizes the novelty mechanism of miR-150 repression by MYC in CML CD34+ cells. By the dashed lines we outlined regulations that we assumed based on published observations.15,17,18,24,25,27

