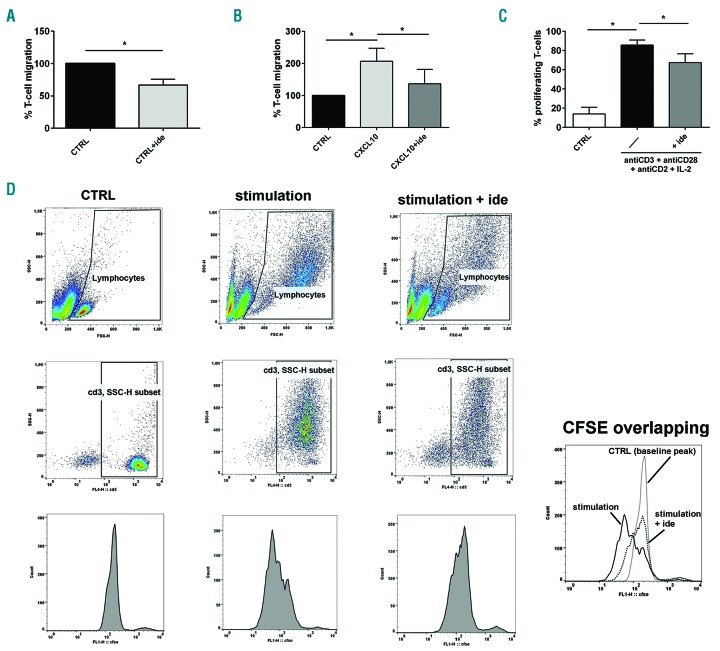
Figure 3.
Idelalisib inhibits T-cell migration and proliferation in chronic lymphocytic leukemia (CLL). (A) Migration experiments were performed on T cells purified from 5 CLL patients, in presence or in absence of 5 μM idelalisib [Control (CTRL)+ide and CTRL, respectively]. The histograms represent the mean percentages±Standard Error (SE) of migrated cells normalized to CTRL, defined as 100%. The drug strongly reduced the number of T cells that spontaneously migrated (*P<0.05, Student t-test). (B) T cells purified from 6 CLL patients were stimulated with CXCL10 in the presence or absence of 5 μM idelalisib and tested for their migration. The mean percentage±SE of migrated T cells was normalized to CTRL (no treatment/no stimulation), defined as 100%. The number of migrated cells is increased by CXCL10 stimulation but is significantly decreased by idelalisib (*P<0.05, Student t-test). (C) Proliferation ability was evaluated by flow cytometry by analyzing the CFSE dilution peaks in T cells purified from 3 CLL patients, pre-treated or not with 5 μM idelalisib and stimulated with a mix of antiCD3+antiCD28+antiCD2 antibodies and IL-2. Not treated/non-stimulated cells were used as controls (CTRL). The mean percentages±SE of proliferating T cells are represented by the histograms. The increased T-cell proliferation obtained with stimulation is significantly reduced by the drug (*P<0.05, Student t-test). (D) Strategy example for the flow-cytometry analysis of T-cell proliferation in the three tested conditions: i) CTRL (not treated/non-stimulated cells), ii) stimulation (stimulation with a mix of antiCD3+antiCD28+antiCD2 and IL-2), iii) stimulation+ide (pre-treatment with 5 μM idelalisib followed by stimulation with a mix of antiCD3+antiCD28+antiCD2 and IL-2). We acquired approximately 10,000 events inside the “lymphocytes” gate based on FSC-H and SSC-H features. For the analysis, inside this first gate we drew a “CD3, SSC-H subset” gate, including only CD3+ cells. Inside this last gate, we evaluated the CFSE dilution peaks of proliferating cells, located to the left of the baseline CFSE peak identified based on the CTRL. For each studied case, we drew the same gates for all three conditions. In the single box on the bottom right, the CSFE dilution peaks of T cells are overlapped and compared between the described conditions.

