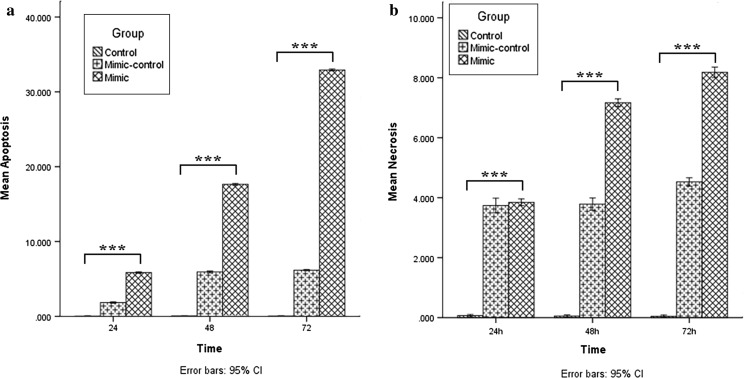
Fig. 5.
Assessment of apoptosis and necrosis using the Annexin-V/PI assay performed 24, 48 and 72 h after transfection. Based on the analysis presented in Fig. 4, apoptosis of the untreated cells at each time point was considered as ~ 0%, and apoptosis of other groups is presented as the percentage of the untreated cells at the same time point (a). Data are presented as mean ± SD of three independent experiments (***p < 0.001). Necrosis of the untreated cells at each time point was considered as ~ 0% and necrosis of other groups is presented as the percentage of the untreated cells at the same time point (b). Data are presented as mean ± SD of three independent experiments (***p < 0.001)

