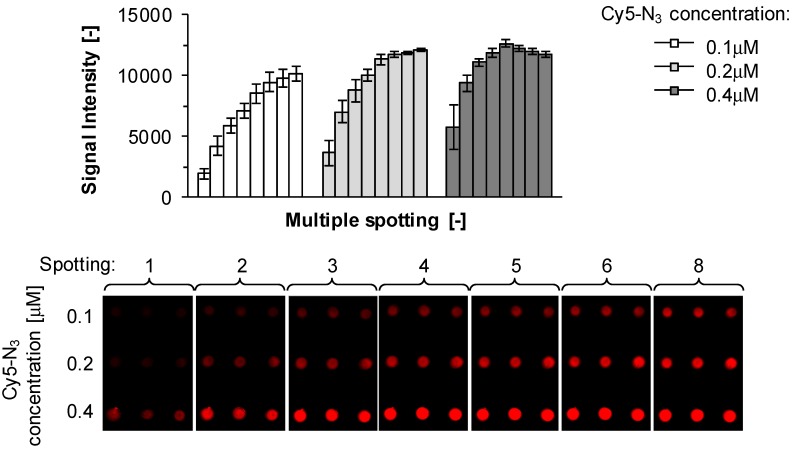
Figure 2.
Characterization of slide reactivity. Fluorescence signal intensity at λ = 635 nm recorded on ADIBO-activated glass slides after sequential spotting (8 times) of 2 μL of Cy5-N3 in 25% DMSO/H2O at three different concentrations (0.1, 0.2 and 0.4 μM, respectively) and corresponding wash cycles (top). A microarray image is shown from one representative experiment (bottom). Data are mean values ± SD of triplicate measurements.

