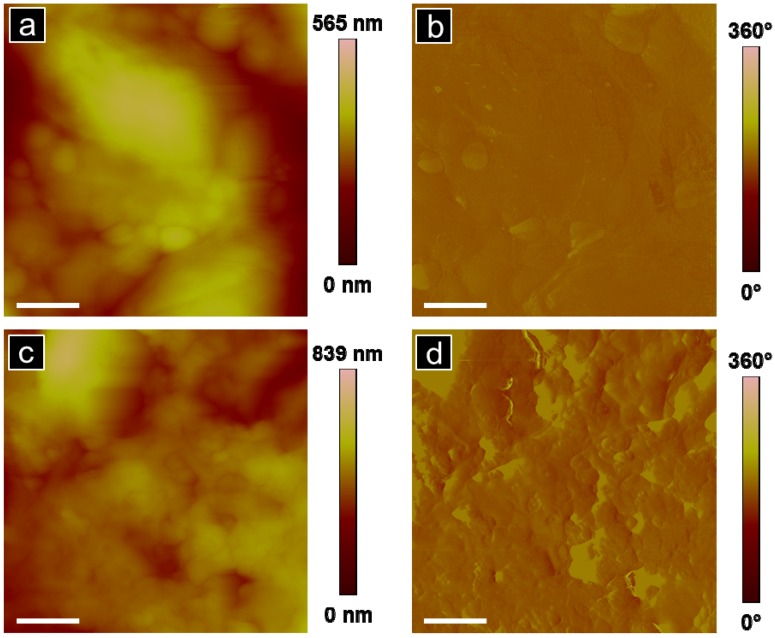
Figure 5.
(a and b) AFM analysis of the dorsal striatum of a rat treated with G4 biotinylated PAMAM dendrimers: (a) topography and (b) phase image in a region where no dendrimers are observed. (c and d) AFM analysis of an untreated rat dorsal striatum (no systemic treatment of G4 biotinylated PAMAM dendrimers): (c) topography and (d) phase image. Scale bar is 1 µm for all images.

